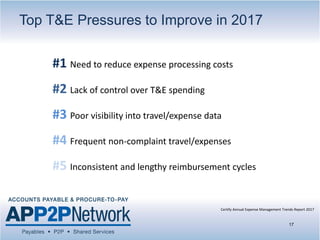
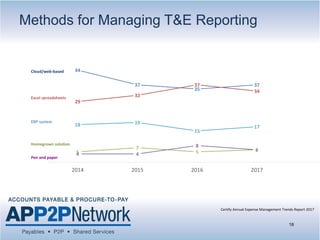
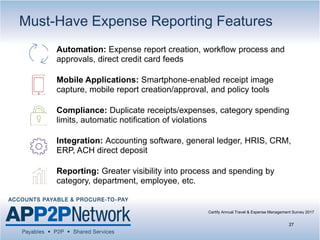
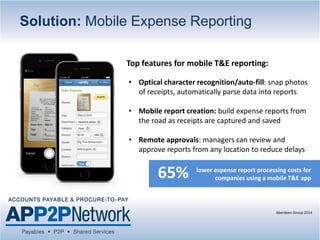
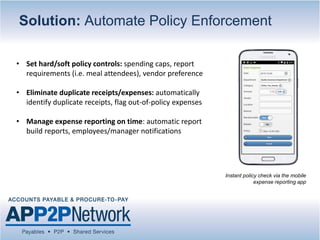
The webinar will begin shortly.
You will hear silence until the webinar begins.
Audio is provided through your computer speakers only.
If you are unable to hear the audio through your computer speakers, simply click on the phone icon above
the chat window to receive teleconference information.
Technical Support Problems for this Webinar:
Email: webinars@iofm.com
Solving Your Toughest T&E
Expense Management Challenges
Tips for using WebEx
• Receiving Teleconference Info
• The chat box (asking questions/tech issues)
Housekeeping
• Handouts
• This program will be recorded
Mark Brousseau
Editor of Special Projects
IOFM
Today’s Presenter
Featured Speaker
4
Ernie Humphrey
CEO & Founder,
360 Thought Leadership Consulting
Learning Objectives
• T&E expense spending by category and benchmark average costs
• Today’s most common expense management technologies and system features
• Why 80% of enterprise companies are using automation to manage T&E
• Effective methods for enforcing employee compliance with travel policies
• How companies are benefiting from automation and quickly achieving ROI
Attending this event will help you understand:
5
• Industry-leading, first fully automated travel and expense
management system
• 64 languages, 140+ currencies, clients in 80 countries
• #1 highest rated expense management software for user
satisfaction on G2 Crowd
• PC Magazine Editors’ Choice for best expense management
software of 2016
• Processing nearly 40 million expenses and receipts valued
at $10+ billion in 2016
About Certify
Certify Annual Trends Study 2017
600+ accounting professionals from outside
the Certify customer base:
7
Why T&E Matters
T&E Spending by U.S. Companies
1. Global Business Travel Association 2016
9
$293.1b
2017 travel and entertainment
spending by U.S. companies
+ 3.8%
from the
previous year
6-12%
total annual budget
for T&E expenses
(Aberdeen Group 2014)
PayStream Advisors 2016
Company Revenue Annual Spend
Under $100MM $700,000
$100MM to $500MM $1,500,000
$501MM to $2b $7,400,000
$2b and above $58,000,000
Business Investment in T&E
1. Meals 19%
2. Airfare 15%
3. Lodging 14%
4. Misc. 13%
5. Gas 11%
6. Taxi 9%
7. Cell phone 5%
8. Car rental 5%
9. Supplies 5%
10. Shipping 2%
11. Tolls 1%
12. Parking 1%
How the Expense Budget is Spent
Certify SpendSmart Report, Q4 2016
11
Meals
Airfare
Lodging
Misc.
Gas
Taxi
Cell
Phone
Car
Rental
Supplies
Shipping Tolls Parking
1. Meals 19%
2. Airfare 15%
3. Lodging 14%
4. Misc. 13%
5. Gas 11%
6. Taxi 9%
7. Cell phone 5%
8. Car rental 5%
9. Supplies 5%
10. Shipping 2%
11. Tolls 1%
12. Parking 1%
How the Expense Budget is Spent
12
Meals
Airfare
Lodging
Misc.
Gas
Taxi
Cell
Phone
Car
Rental
Supplies
Shipping Tolls Parking
$98.74
DAILY
MEAL COST
2016
Certify SpendSmart Report, Q4 2016
2016 Business Travel News Corporate Travel Index
Category 2016 2017 Difference
Gas $30.32 $29.77 –1.81%
Airfare $274.00 $316.17 +15.39%
Lodging $223.45 $210.19 –5.93%
Car Rental $186.45 $190.74 +2.30%
Cell Phone $92.24 $89.00 –3.51%
Meals $26.06 $27.02 +3.68%
Misc. $55.71 $68.20 +22.41%
Taxi $31.82 $27.90 –12.31%
Benchmark Spending by Category
Certify SpendSmart Report, Q4 2016-2017
13
Polling Question 1
a) Meals
b) Mileage
c) Airfare
d) Lodging
e) Other
As a percent of total spending, what was your company’s
largest expense category in 2016?
The Many Challenges of T&E
Expense Management
Expense Reporting Inefficiencies
Expense Reporting Around the World: Practices, Pain Points, and Productivity, GBTA, 2015
16
up to
minutes to complete
one expense report
minutes to correct
expense reports errors
average number of
reports with errors
23 15-22
22%
Top T&E Pressures to Improve in 2017
#1 Need to reduce expense processing costs
#2 Lack of control over T&E spending
#3 Poor visibility into travel/expense data
#4 Frequent non-complaint travel/expenses
#5 Inconsistent and lengthy reimbursement cycles
17
Certify Annual Expense Management Trends Report 2017
44
37
35
37
29
32
37
34
5
7
5 6
4 4
8
6
18 19
15
17
2014 2015 2016 2017
Methods for Managing T&E Reporting
Certify Annual Expense Management Trends Report 2017
18
Cloud/web-based
Excel spreadsheets
ERP system
Homegrown solution
Pen and paper
SMALL
BUSINESS
MID-SIZE
BUSINESS ENTERPRISE
33%
37%
8%
6%
16%
56%
10%
2%
8%
24%24%
55%
7%
2%
12%
Web-based solution (Concur, IBM, etc.)
Microsoft Excel/spreadsheets
Pen and paper
Homegrown solution
ERP/accounting package (Oracle, SAP, etc.)
T&E Systems by Company Size
19
Certify Annual Expense Management Trends Report 2017
56%
10%
2%
8%
24%
SMALL
BUSINESS
MID-SIZE
BUSINESS ENTERPRISE
24%
55%
7%
2%
12%
33%
37%
8%
6%
16%
Web-based solution (Concur, IBM, etc.)
Microsoft Excel/spreadsheets
Pen and paper
Homegrown solution
ERP/accounting package (Oracle, SAP, etc.)
T&E Systems by Company Size
20
MANUAL SYSTEMS:
20% enterprise • 64% small businesses
Certify Annual Expense Management Trends Report 2017
Print spreadsheets,
tape or staple receipts
and make copies
Enter expenses in Excel with
category, vendor, dates, etc.
And then … waitGather receipts,
itineraries and write down
non-receipt items
Sign report/date
report and present
or mail to manager
Employees
Manual Expense Reporting Process
AccountantsManagers
Check expenses for
receipts, review for out-
of-policy items, etc.
Receive reports for all
employees at different times
during the month/quarter
If errors, return report to
employee to start over;
wait for resubmission Sign/approve reports
and route to the next
manager or to AP
Manual Expense Reporting Process
Employees AccountantsManagers
Manually enter data
from accounting
software to payroll for
reimbursementManually enter
expense data into
accounting software
Check for receipts,
manager approvals,
out-of-policy items, etc.
Receive reports for all
employees at different
times of the month/quarter
Match receipts with line-
items, verify all charges,
dates and vendors
Manual Expense Reporting Process
Employees AccountantsManagers
Leading frustrations for T&E program administrators:
Top Expense Management Pain Points
24
Certify Annual Expense Management Trends Report 2015-2017
2015 2016 2017
Employees losing paper receipts/submitting without receipts 33% 50% 52%
Employees failure to submit reports on time 39% 45% 51%
Time it takes to reconcile, review and approve reports 38% 38% 36%
Reviewing for policy violations 20% 30% 28%
Errors on expense reports (incorrect codes, amounts, etc.) 23% 28% 26%
Polling Question 2
a) Paper-based/spreadsheets
b) ERP system (Oracle, Microsoft Dynamics, etc.)
c) Web-based expense software (Certify, Concur, etc.)
d) Not applicable
How does your organization currently manage
T&E expense reporting?
How Automation Solves the
Toughest T&E Challenges
Must-Have Expense Reporting Features
Automation: Expense report creation, workflow process and
approvals, direct credit card feeds
Mobile Applications: Smartphone-enabled receipt image
capture, mobile report creation/approval, and policy tools
Compliance: Duplicate receipts/expenses, category spending
limits, automatic notification of violations
Integration: Accounting software, general ledger, HRIS, CRM,
ERP, ACH direct deposit
Reporting: Greater visibility into process and spending by
category, department, employee, etc.
27
Certify Annual Travel & Expense Management Survey 2017
Lower processing costs is the
top driver of T&E investments
for 49% of all companies
Forrester Research 2016
Challenge #1: Lower processing costs
$6.85
fully automated
$17.31
semi-automated
$26.63
manual process
29
PayStream Advisors 2016
Average processing cost per report by system type:
31%
16%
9%
Under $7 per report $10−$20 per report
$25 or more per report We do not track these costs
30
Certify Annual Expense Management Trends Report 2017
44%
do not track expense
report processing costs
Challenge #1: Lower processing costs
Solution: Mobile Expense Reporting
• Optical character recognition/auto-fill: snap photos
of receipts, automatically parse data into reports
• Mobile report creation: build expense reports from
the road as receipts are captured and saved
• Remote approvals: managers can review and
approve reports from any location to reduce delays
Top features for mobile T&E reporting:
Aberdeen Group 2014
65% lower expense report processing costs for
companies using a mobile T&E app
2016
T&E spending ranks as the 2nd
most difficult operating expense
category to control
Forrester Research 2014
Certify Annual Travel & Expense Management Survey 2017
Challenge #2: Controlling Spending
33
We do not have
expense category
limits
26%
Based on internal
historical spending
23%
Follow U.S. GSA per
rate guidelines
23%
Determined by
annual budgeting
process
21%
Other
7%
www.gsa.gov, accessed 1/30/17
34
GSA Lodging, Meals & Incidentals for San Francisco, CA
Lodging (per night) Breakfast Lunch Dinner
$267 $17 $18 $31
Incidental -- $5 $5 $5
Challenge #2: Controlling Spending
Solution: Integrated Travel Booking Controls
Pre-Trip Approval:
Requires manager authorization prior
to booking; configurable by employee,
policy specifics, etc.
Lowest Logical Fare:
Automatically identifies best available
rates for proposed itinerary (and only
best available rates)
$
35
Improving visibility into spend is a
driving force behind the switch to
automation for 30% of companies
Certify Annual Expense Management Trends Report 2017
Certify Annual Travel & Expense Management Survey 2017
Challenge #3: Poor Visibility into Data
37
2nd biggest driver of T&E
improvements for companies
on a manual process
FACT:
You can’t control it
if you can’t see it
Certify Annual Travel & Expense Management Survey 2017
38
Challenge #3: Poor Visibility into Data
of companies switching
to T&E automation …45%
Certify Annual Travel & Expense Management Survey 2017
39
Challenge #3: Poor Visibility into Data
of companies switching
to T&E automation …45%
report increased visibility
into spending and data
$
Solution: Reporting Visibility Delivers Control
Workflow: monitor people and process, approval paths,
identify delays and other roadblocks
Compliance: review processed and in-progress reports,
policy violations, fraudulent behavior
Spending: analyze by expense category, mileage,
department, employee, and more
An estimated 20% of a total T&E
spend is considered out of policy
for the average company
Aberdeen Group 2012
Challenge #4: T&E Policy Compliance
79%of all companies report
having a written
T&E policy in place
42
Certify Annual Expense Management Trends Report 2017
75%manually review each
expense report report
for policy violations
7%
39%
41%
15%
26%
0%
5%
10%
15%
20%
25%
30%
35%
40%
45%
T&E policy is not
enforced
Employee is responsible Manager manually
review each expense
Manager manually
review, checking only
high value expenses
T&E system
automatically flags out-
of-policy violations
43
Certify Annual Expense Management Trends Report 2017
Challenge #4: T&E Policy Compliance
Solution: Automate Policy Enforcement
• Set hard/soft policy controls: spending caps, report
requirements (i.e. meal attendees), vendor preference
• Eliminate duplicate receipts/expenses: automatically
identify duplicate receipts, flag out-of-policy expenses
• Manage expense reporting on time: automatic report
build reports, employees/manager notifications
Instant policy check via the mobile
expense reporting app
Companies with an integrated T&E
solution experience 64% fewer
instances of reimbursement errors
Aberdeen Group 2014
Certify Annual Travel & Expense Management Survey 2017
Challenge #5: Reimbursement Cycle
46
65%
of companies require reports
be submitted one month or
less from expense date
Certify Annual Travel & Expense Management Survey 2017
47
34%
of companies take between
8 and 20 days to reimburse
employee expenses
Reimbursement times affect employee morale and cash flow
Challenge #5: Reimbursement Cycle
Solution: Integrated ACH Direct Deposit
Manual Process
of companies switching to
T&E automation reimburse
employees faster
45%
58% 18%
Who’s using ACH?
Automated System
Polling Question 3
a) Reducing process and workflow inefficiencies
b) Tighter controls for employee T&E spending
c) Lowering expense report processing costs
d) Increasing travel policy compliance
What is your organization’s top area for T&E
improvement in the year ahead?
Questions?
Our Sponsor
Thank You!
Questions after the event? E-mail webinars@iofm.com
We hope to see you at a future AP Network event! For upcoming events please visit
www.tapn.com.

Solving Your Toughest T&E Expense Management Challenges

  • 1.
    The webinar willbegin shortly. You will hear silence until the webinar begins. Audio is provided through your computer speakers only. If you are unable to hear the audio through your computer speakers, simply click on the phone icon above the chat window to receive teleconference information. Technical Support Problems for this Webinar: Email: webinars@iofm.com Solving Your Toughest T&E Expense Management Challenges
  • 2.
    Tips for usingWebEx • Receiving Teleconference Info • The chat box (asking questions/tech issues) Housekeeping • Handouts • This program will be recorded
  • 3.
    Mark Brousseau Editor ofSpecial Projects IOFM Today’s Presenter
  • 4.
    Featured Speaker 4 Ernie Humphrey CEO& Founder, 360 Thought Leadership Consulting
  • 5.
    Learning Objectives • T&Eexpense spending by category and benchmark average costs • Today’s most common expense management technologies and system features • Why 80% of enterprise companies are using automation to manage T&E • Effective methods for enforcing employee compliance with travel policies • How companies are benefiting from automation and quickly achieving ROI Attending this event will help you understand: 5
  • 6.
    • Industry-leading, firstfully automated travel and expense management system • 64 languages, 140+ currencies, clients in 80 countries • #1 highest rated expense management software for user satisfaction on G2 Crowd • PC Magazine Editors’ Choice for best expense management software of 2016 • Processing nearly 40 million expenses and receipts valued at $10+ billion in 2016 About Certify
  • 7.
    Certify Annual TrendsStudy 2017 600+ accounting professionals from outside the Certify customer base: 7
  • 8.
  • 9.
    T&E Spending byU.S. Companies 1. Global Business Travel Association 2016 9 $293.1b 2017 travel and entertainment spending by U.S. companies + 3.8% from the previous year
  • 10.
    6-12% total annual budget forT&E expenses (Aberdeen Group 2014) PayStream Advisors 2016 Company Revenue Annual Spend Under $100MM $700,000 $100MM to $500MM $1,500,000 $501MM to $2b $7,400,000 $2b and above $58,000,000 Business Investment in T&E
  • 11.
    1. Meals 19% 2.Airfare 15% 3. Lodging 14% 4. Misc. 13% 5. Gas 11% 6. Taxi 9% 7. Cell phone 5% 8. Car rental 5% 9. Supplies 5% 10. Shipping 2% 11. Tolls 1% 12. Parking 1% How the Expense Budget is Spent Certify SpendSmart Report, Q4 2016 11 Meals Airfare Lodging Misc. Gas Taxi Cell Phone Car Rental Supplies Shipping Tolls Parking
  • 12.
    1. Meals 19% 2.Airfare 15% 3. Lodging 14% 4. Misc. 13% 5. Gas 11% 6. Taxi 9% 7. Cell phone 5% 8. Car rental 5% 9. Supplies 5% 10. Shipping 2% 11. Tolls 1% 12. Parking 1% How the Expense Budget is Spent 12 Meals Airfare Lodging Misc. Gas Taxi Cell Phone Car Rental Supplies Shipping Tolls Parking $98.74 DAILY MEAL COST 2016 Certify SpendSmart Report, Q4 2016 2016 Business Travel News Corporate Travel Index
  • 13.
    Category 2016 2017Difference Gas $30.32 $29.77 –1.81% Airfare $274.00 $316.17 +15.39% Lodging $223.45 $210.19 –5.93% Car Rental $186.45 $190.74 +2.30% Cell Phone $92.24 $89.00 –3.51% Meals $26.06 $27.02 +3.68% Misc. $55.71 $68.20 +22.41% Taxi $31.82 $27.90 –12.31% Benchmark Spending by Category Certify SpendSmart Report, Q4 2016-2017 13
  • 14.
    Polling Question 1 a)Meals b) Mileage c) Airfare d) Lodging e) Other As a percent of total spending, what was your company’s largest expense category in 2016?
  • 15.
    The Many Challengesof T&E Expense Management
  • 16.
    Expense Reporting Inefficiencies ExpenseReporting Around the World: Practices, Pain Points, and Productivity, GBTA, 2015 16 up to minutes to complete one expense report minutes to correct expense reports errors average number of reports with errors 23 15-22 22%
  • 17.
    Top T&E Pressuresto Improve in 2017 #1 Need to reduce expense processing costs #2 Lack of control over T&E spending #3 Poor visibility into travel/expense data #4 Frequent non-complaint travel/expenses #5 Inconsistent and lengthy reimbursement cycles 17 Certify Annual Expense Management Trends Report 2017
  • 18.
    44 37 35 37 29 32 37 34 5 7 5 6 4 4 8 6 1819 15 17 2014 2015 2016 2017 Methods for Managing T&E Reporting Certify Annual Expense Management Trends Report 2017 18 Cloud/web-based Excel spreadsheets ERP system Homegrown solution Pen and paper
  • 19.
    SMALL BUSINESS MID-SIZE BUSINESS ENTERPRISE 33% 37% 8% 6% 16% 56% 10% 2% 8% 24%24% 55% 7% 2% 12% Web-based solution(Concur, IBM, etc.) Microsoft Excel/spreadsheets Pen and paper Homegrown solution ERP/accounting package (Oracle, SAP, etc.) T&E Systems by Company Size 19 Certify Annual Expense Management Trends Report 2017
  • 20.
    56% 10% 2% 8% 24% SMALL BUSINESS MID-SIZE BUSINESS ENTERPRISE 24% 55% 7% 2% 12% 33% 37% 8% 6% 16% Web-based solution(Concur, IBM, etc.) Microsoft Excel/spreadsheets Pen and paper Homegrown solution ERP/accounting package (Oracle, SAP, etc.) T&E Systems by Company Size 20 MANUAL SYSTEMS: 20% enterprise • 64% small businesses Certify Annual Expense Management Trends Report 2017
  • 21.
    Print spreadsheets, tape orstaple receipts and make copies Enter expenses in Excel with category, vendor, dates, etc. And then … waitGather receipts, itineraries and write down non-receipt items Sign report/date report and present or mail to manager Employees Manual Expense Reporting Process AccountantsManagers
  • 22.
    Check expenses for receipts,review for out- of-policy items, etc. Receive reports for all employees at different times during the month/quarter If errors, return report to employee to start over; wait for resubmission Sign/approve reports and route to the next manager or to AP Manual Expense Reporting Process Employees AccountantsManagers
  • 23.
    Manually enter data fromaccounting software to payroll for reimbursementManually enter expense data into accounting software Check for receipts, manager approvals, out-of-policy items, etc. Receive reports for all employees at different times of the month/quarter Match receipts with line- items, verify all charges, dates and vendors Manual Expense Reporting Process Employees AccountantsManagers
  • 24.
    Leading frustrations forT&E program administrators: Top Expense Management Pain Points 24 Certify Annual Expense Management Trends Report 2015-2017 2015 2016 2017 Employees losing paper receipts/submitting without receipts 33% 50% 52% Employees failure to submit reports on time 39% 45% 51% Time it takes to reconcile, review and approve reports 38% 38% 36% Reviewing for policy violations 20% 30% 28% Errors on expense reports (incorrect codes, amounts, etc.) 23% 28% 26%
  • 25.
    Polling Question 2 a)Paper-based/spreadsheets b) ERP system (Oracle, Microsoft Dynamics, etc.) c) Web-based expense software (Certify, Concur, etc.) d) Not applicable How does your organization currently manage T&E expense reporting?
  • 26.
    How Automation Solvesthe Toughest T&E Challenges
  • 27.
    Must-Have Expense ReportingFeatures Automation: Expense report creation, workflow process and approvals, direct credit card feeds Mobile Applications: Smartphone-enabled receipt image capture, mobile report creation/approval, and policy tools Compliance: Duplicate receipts/expenses, category spending limits, automatic notification of violations Integration: Accounting software, general ledger, HRIS, CRM, ERP, ACH direct deposit Reporting: Greater visibility into process and spending by category, department, employee, etc. 27 Certify Annual Travel & Expense Management Survey 2017
  • 28.
    Lower processing costsis the top driver of T&E investments for 49% of all companies Forrester Research 2016
  • 29.
    Challenge #1: Lowerprocessing costs $6.85 fully automated $17.31 semi-automated $26.63 manual process 29 PayStream Advisors 2016 Average processing cost per report by system type:
  • 30.
    31% 16% 9% Under $7 perreport $10−$20 per report $25 or more per report We do not track these costs 30 Certify Annual Expense Management Trends Report 2017 44% do not track expense report processing costs Challenge #1: Lower processing costs
  • 31.
    Solution: Mobile ExpenseReporting • Optical character recognition/auto-fill: snap photos of receipts, automatically parse data into reports • Mobile report creation: build expense reports from the road as receipts are captured and saved • Remote approvals: managers can review and approve reports from any location to reduce delays Top features for mobile T&E reporting: Aberdeen Group 2014 65% lower expense report processing costs for companies using a mobile T&E app 2016
  • 32.
    T&E spending ranksas the 2nd most difficult operating expense category to control Forrester Research 2014
  • 33.
    Certify Annual Travel& Expense Management Survey 2017 Challenge #2: Controlling Spending 33 We do not have expense category limits 26% Based on internal historical spending 23% Follow U.S. GSA per rate guidelines 23% Determined by annual budgeting process 21% Other 7%
  • 34.
    www.gsa.gov, accessed 1/30/17 34 GSALodging, Meals & Incidentals for San Francisco, CA Lodging (per night) Breakfast Lunch Dinner $267 $17 $18 $31 Incidental -- $5 $5 $5 Challenge #2: Controlling Spending
  • 35.
    Solution: Integrated TravelBooking Controls Pre-Trip Approval: Requires manager authorization prior to booking; configurable by employee, policy specifics, etc. Lowest Logical Fare: Automatically identifies best available rates for proposed itinerary (and only best available rates) $ 35
  • 36.
    Improving visibility intospend is a driving force behind the switch to automation for 30% of companies Certify Annual Expense Management Trends Report 2017
  • 37.
    Certify Annual Travel& Expense Management Survey 2017 Challenge #3: Poor Visibility into Data 37 2nd biggest driver of T&E improvements for companies on a manual process FACT: You can’t control it if you can’t see it
  • 38.
    Certify Annual Travel& Expense Management Survey 2017 38 Challenge #3: Poor Visibility into Data of companies switching to T&E automation …45%
  • 39.
    Certify Annual Travel& Expense Management Survey 2017 39 Challenge #3: Poor Visibility into Data of companies switching to T&E automation …45% report increased visibility into spending and data $
  • 40.
    Solution: Reporting VisibilityDelivers Control Workflow: monitor people and process, approval paths, identify delays and other roadblocks Compliance: review processed and in-progress reports, policy violations, fraudulent behavior Spending: analyze by expense category, mileage, department, employee, and more
  • 41.
    An estimated 20%of a total T&E spend is considered out of policy for the average company Aberdeen Group 2012
  • 42.
    Challenge #4: T&EPolicy Compliance 79%of all companies report having a written T&E policy in place 42 Certify Annual Expense Management Trends Report 2017 75%manually review each expense report report for policy violations
  • 43.
    7% 39% 41% 15% 26% 0% 5% 10% 15% 20% 25% 30% 35% 40% 45% T&E policy isnot enforced Employee is responsible Manager manually review each expense Manager manually review, checking only high value expenses T&E system automatically flags out- of-policy violations 43 Certify Annual Expense Management Trends Report 2017 Challenge #4: T&E Policy Compliance
  • 44.
    Solution: Automate PolicyEnforcement • Set hard/soft policy controls: spending caps, report requirements (i.e. meal attendees), vendor preference • Eliminate duplicate receipts/expenses: automatically identify duplicate receipts, flag out-of-policy expenses • Manage expense reporting on time: automatic report build reports, employees/manager notifications Instant policy check via the mobile expense reporting app
  • 45.
    Companies with anintegrated T&E solution experience 64% fewer instances of reimbursement errors Aberdeen Group 2014
  • 46.
    Certify Annual Travel& Expense Management Survey 2017 Challenge #5: Reimbursement Cycle 46 65% of companies require reports be submitted one month or less from expense date
  • 47.
    Certify Annual Travel& Expense Management Survey 2017 47 34% of companies take between 8 and 20 days to reimburse employee expenses Reimbursement times affect employee morale and cash flow Challenge #5: Reimbursement Cycle
  • 48.
    Solution: Integrated ACHDirect Deposit Manual Process of companies switching to T&E automation reimburse employees faster 45% 58% 18% Who’s using ACH? Automated System
  • 49.
    Polling Question 3 a)Reducing process and workflow inefficiencies b) Tighter controls for employee T&E spending c) Lowering expense report processing costs d) Increasing travel policy compliance What is your organization’s top area for T&E improvement in the year ahead?
  • 50.
  • 51.
  • 52.
    Thank You! Questions afterthe event? E-mail webinars@iofm.com We hope to see you at a future AP Network event! For upcoming events please visit www.tapn.com.