Download to read offline

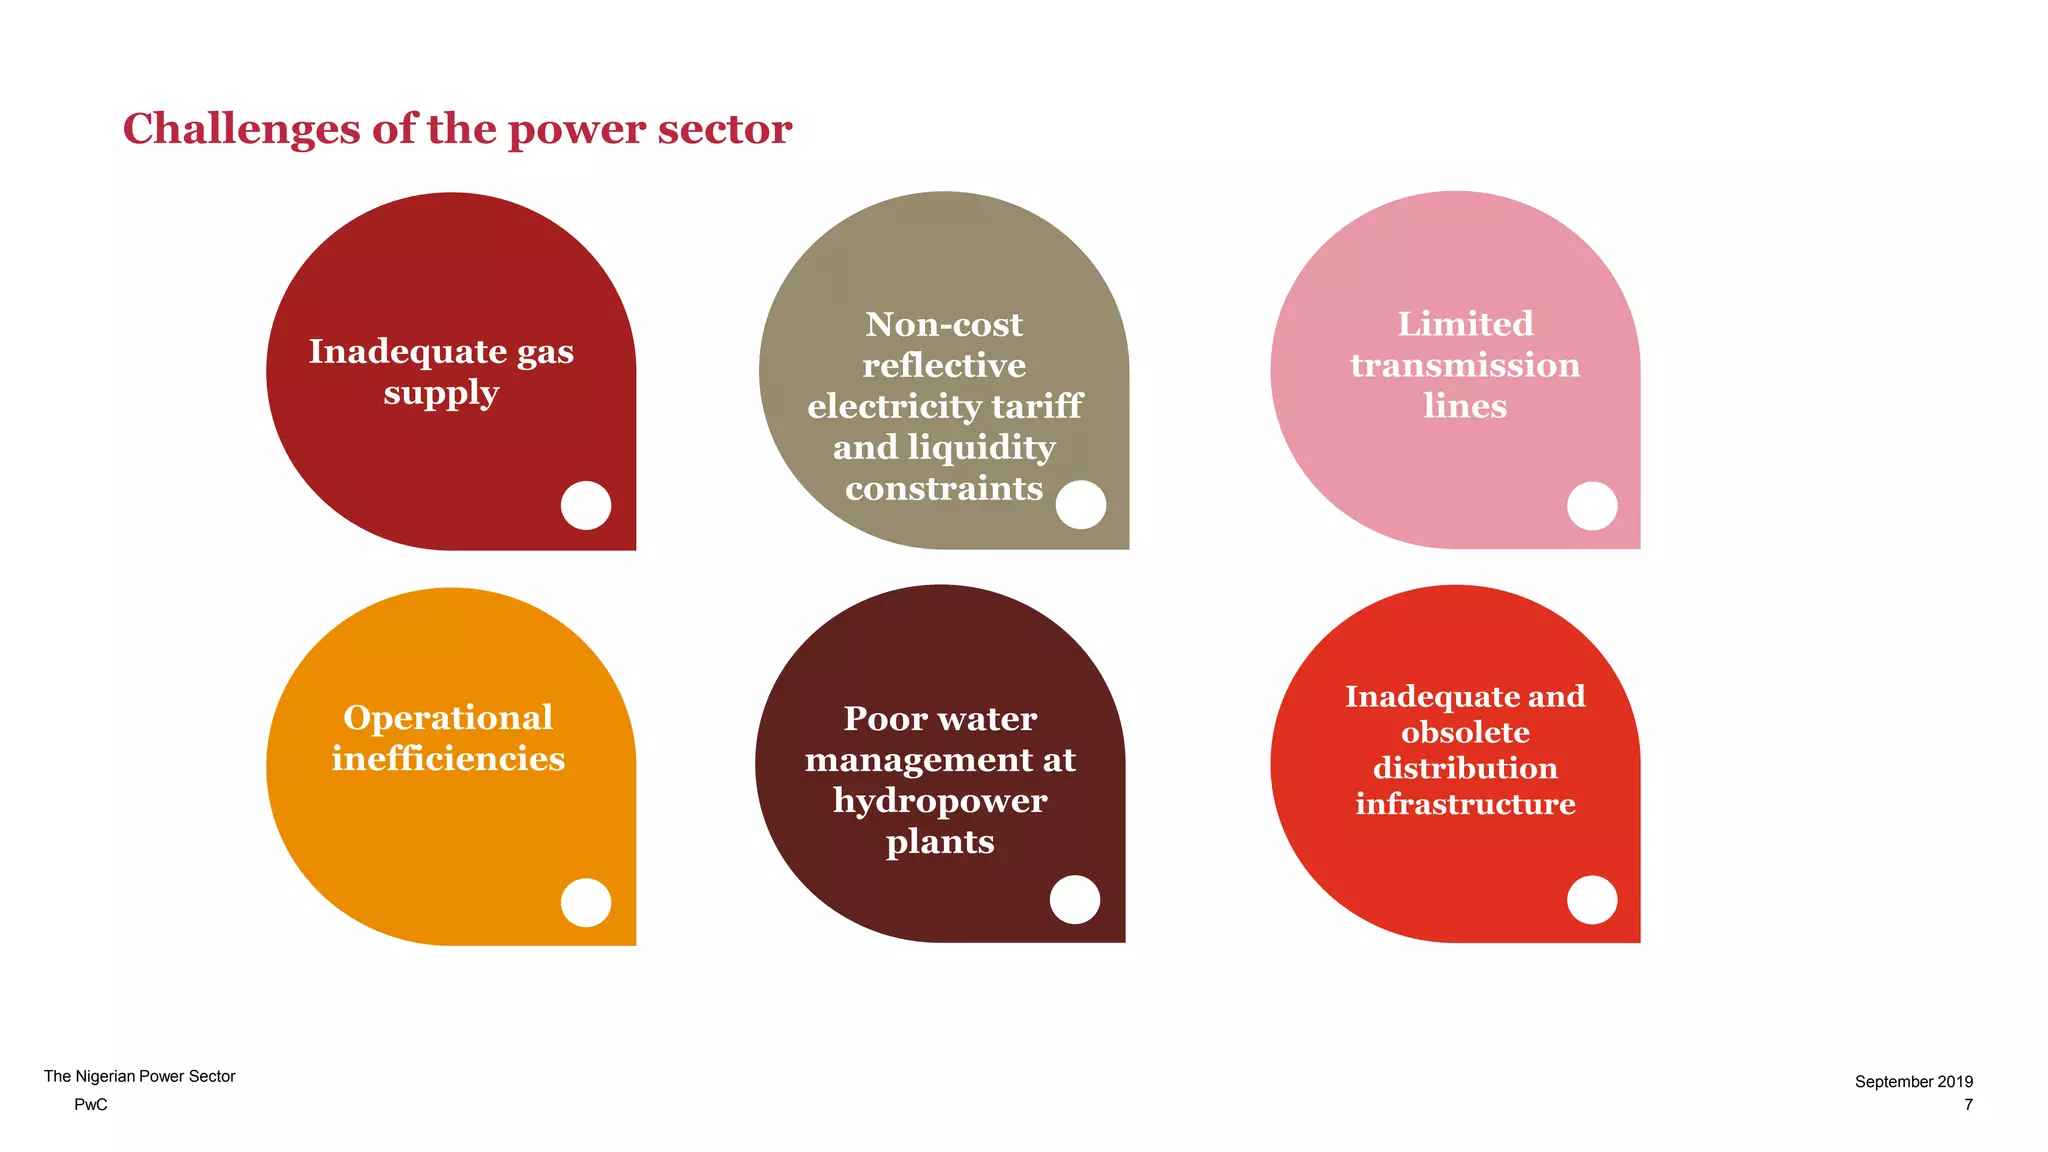
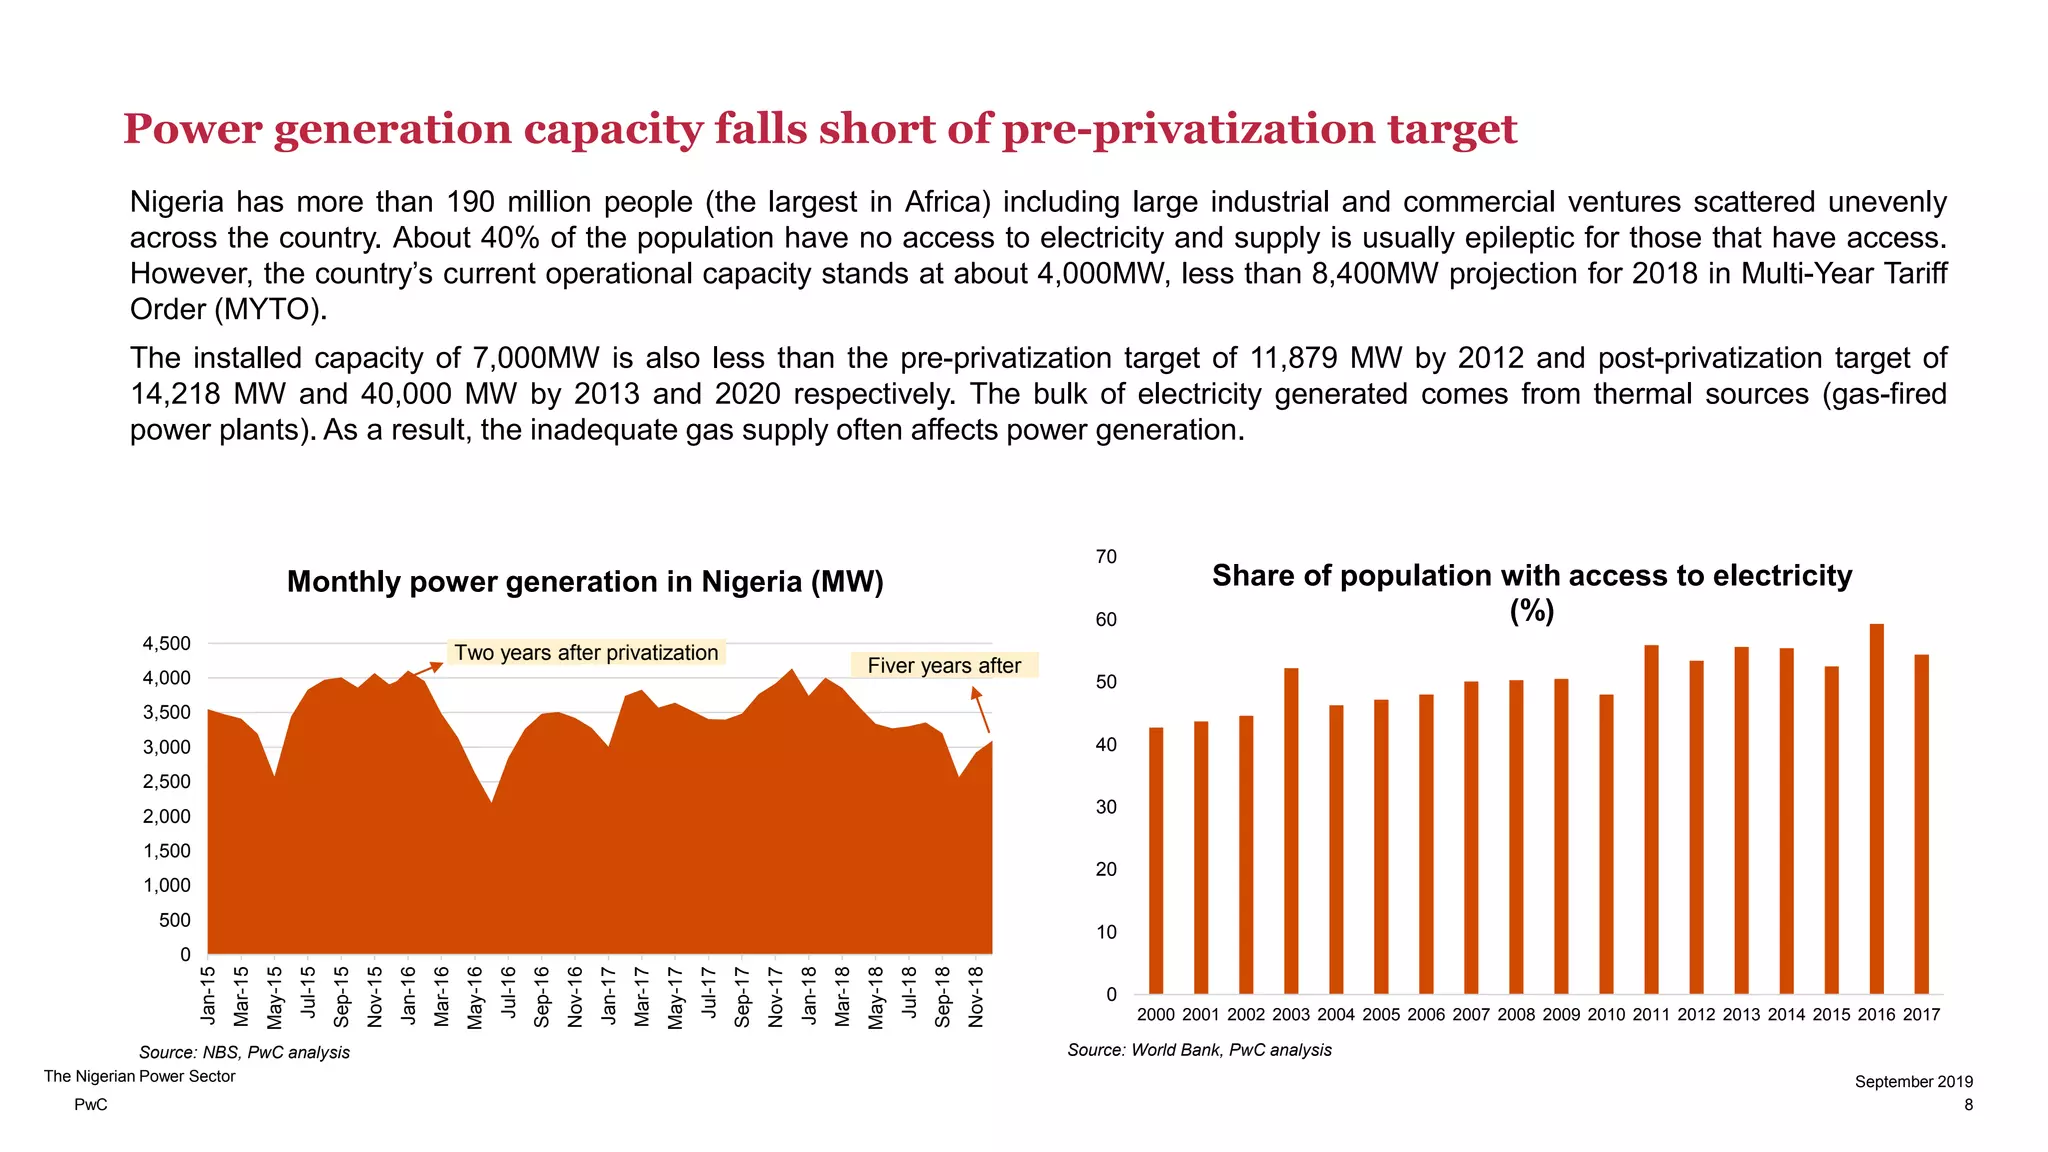
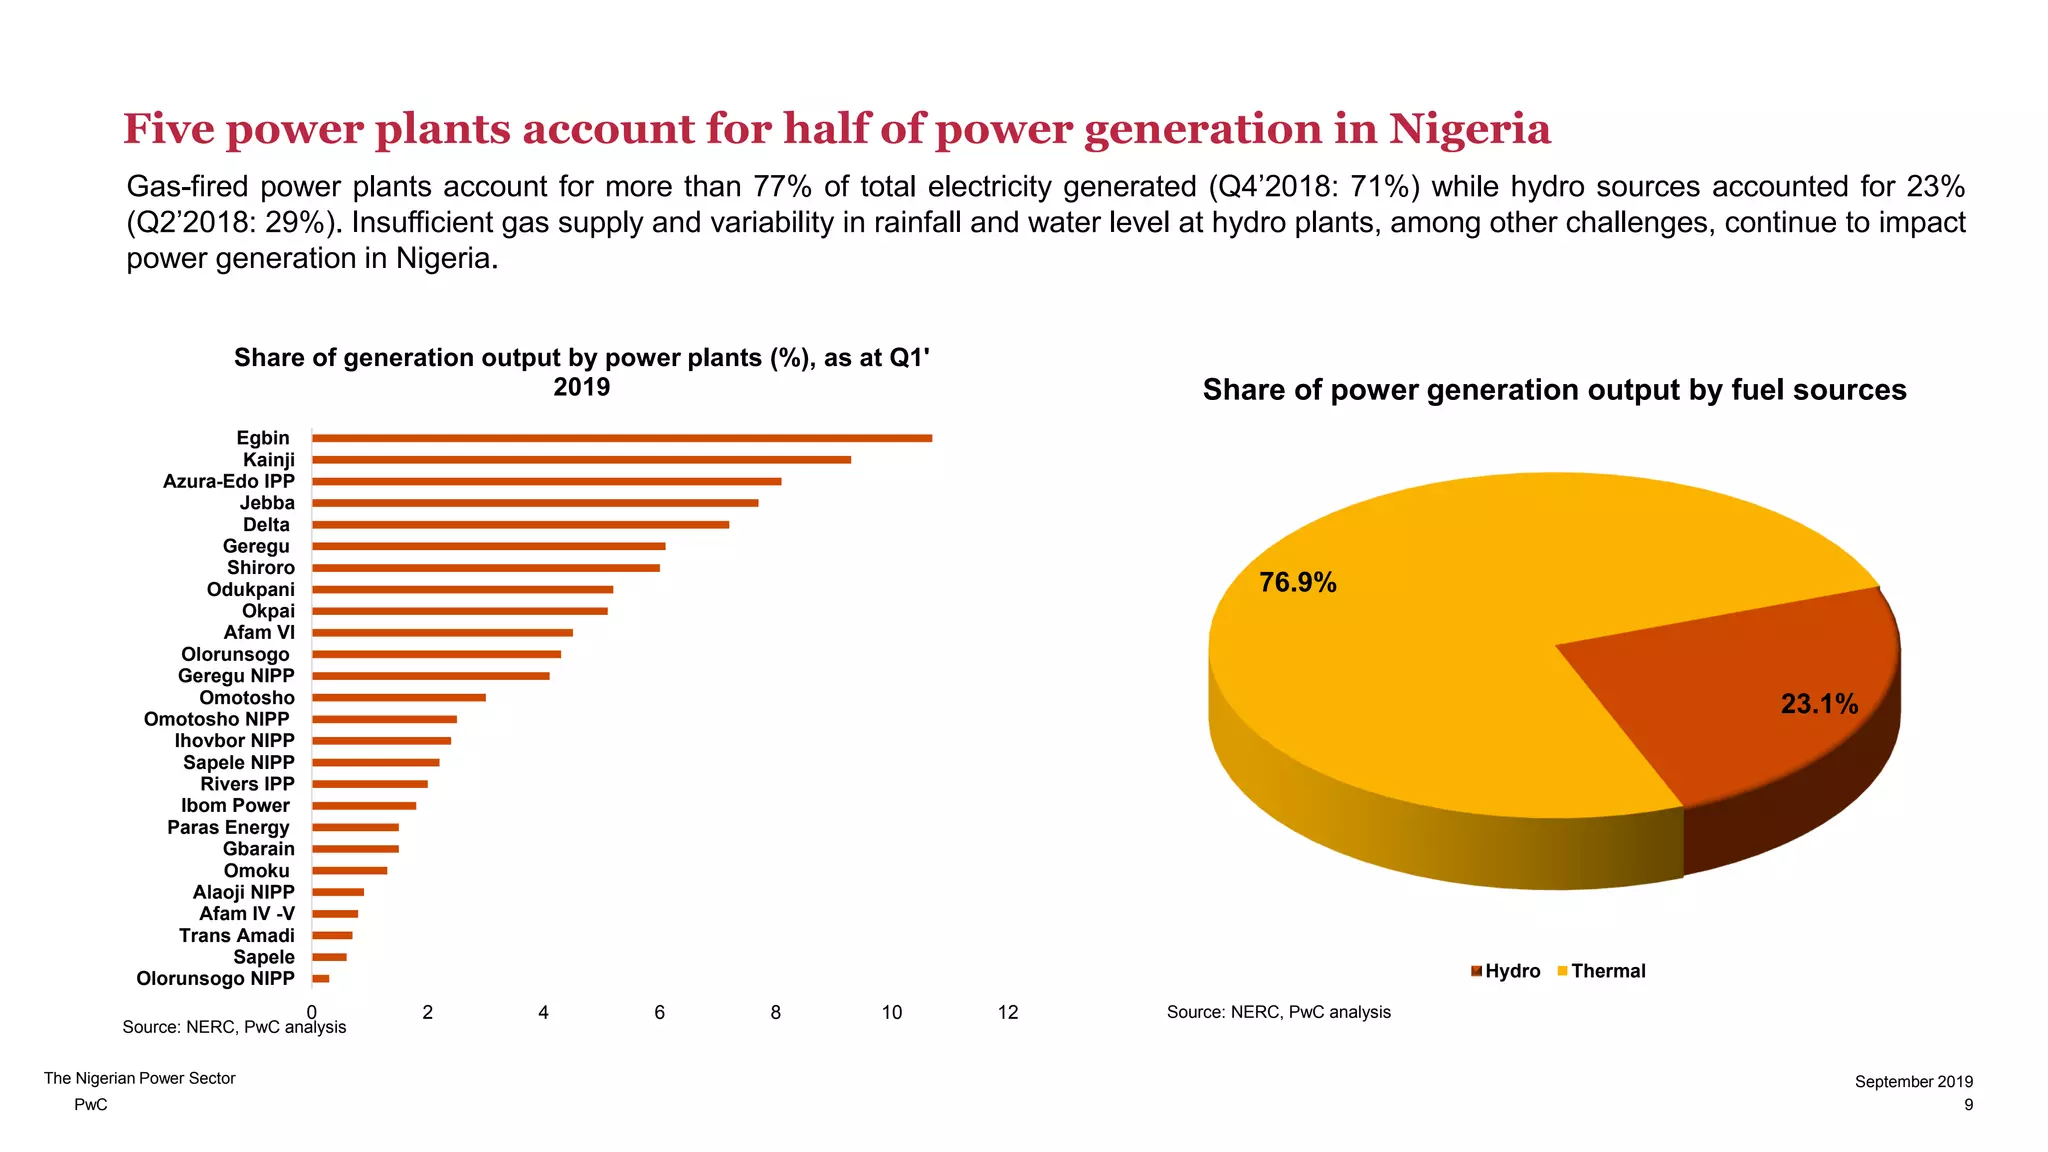
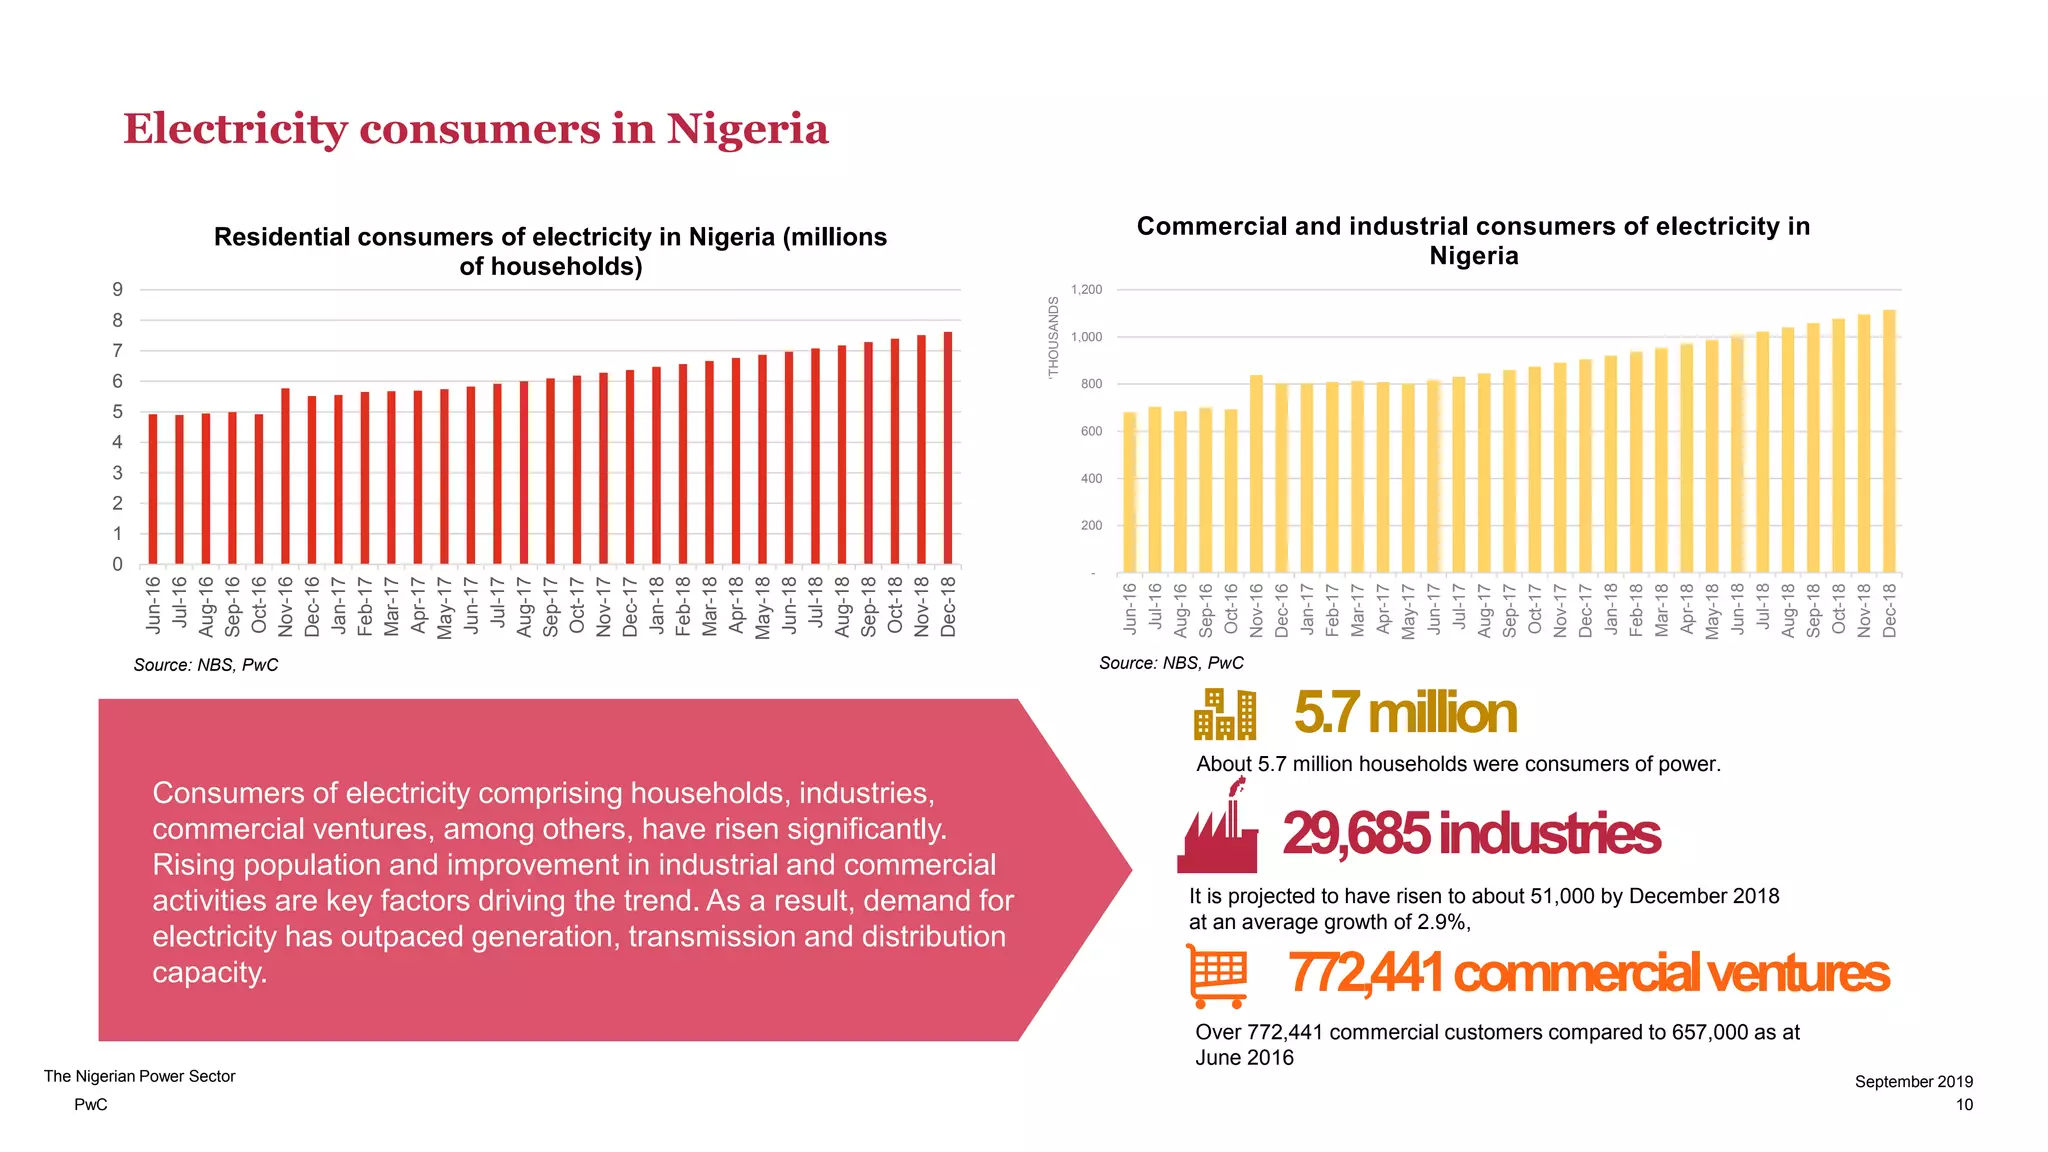

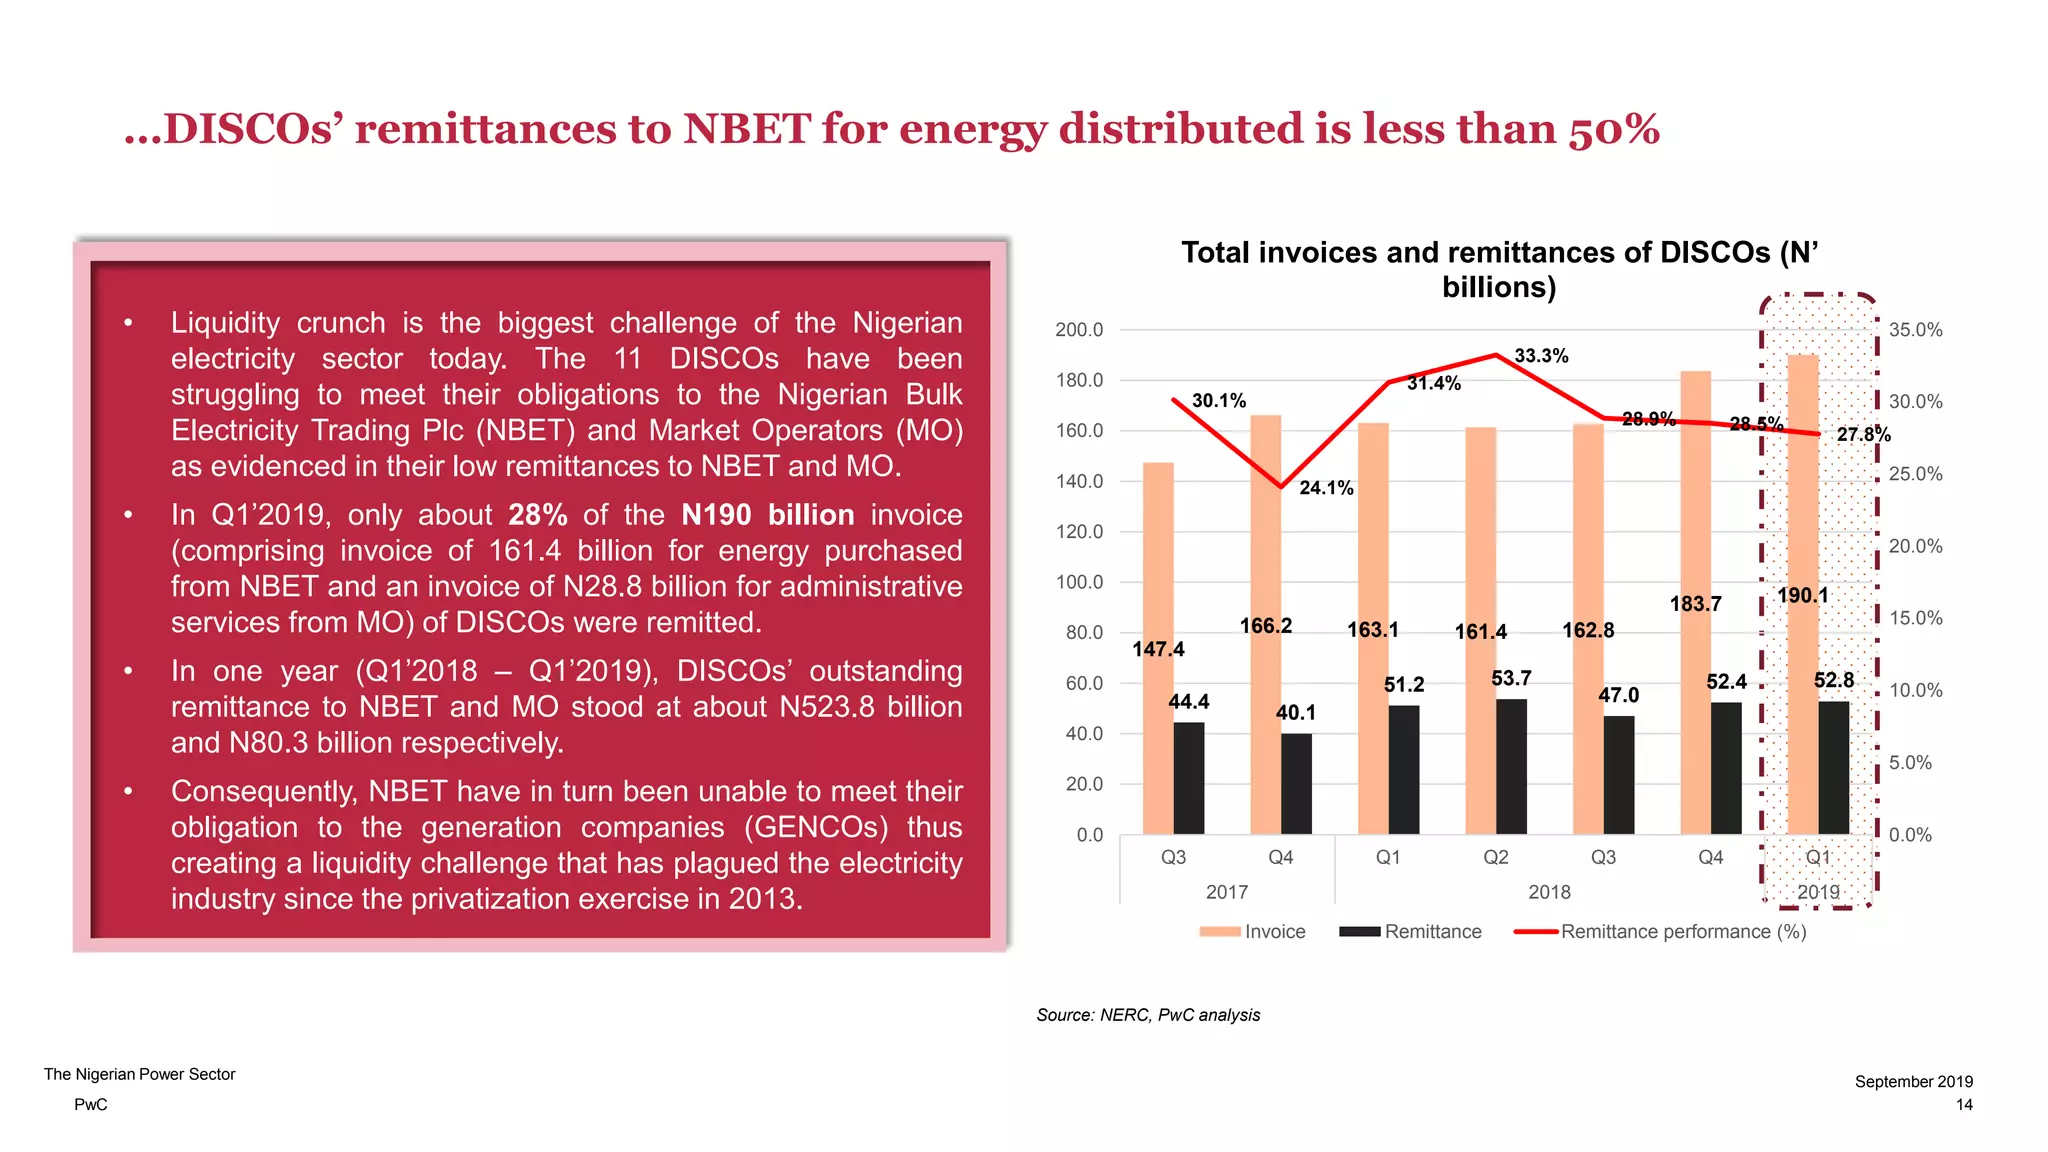
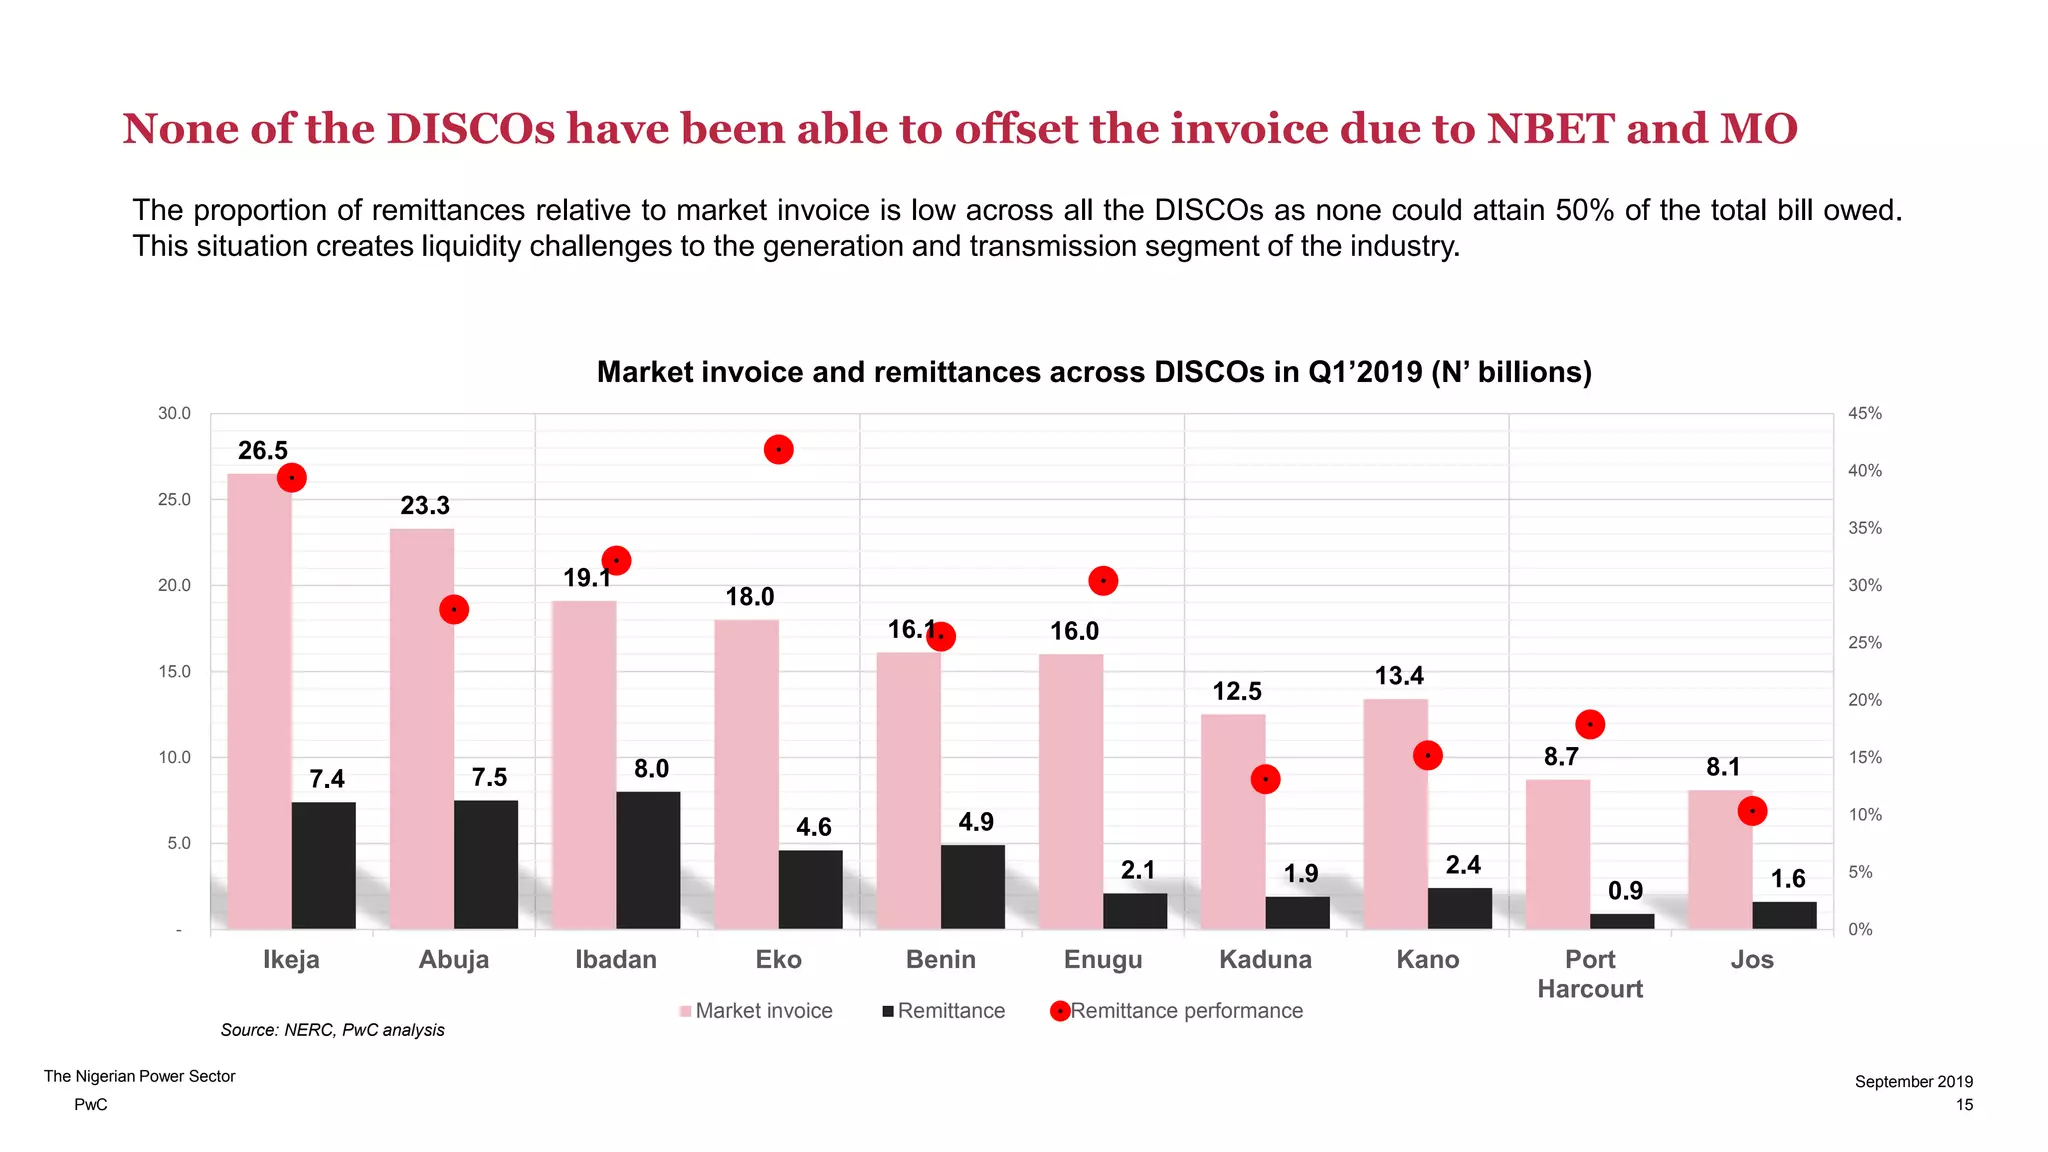
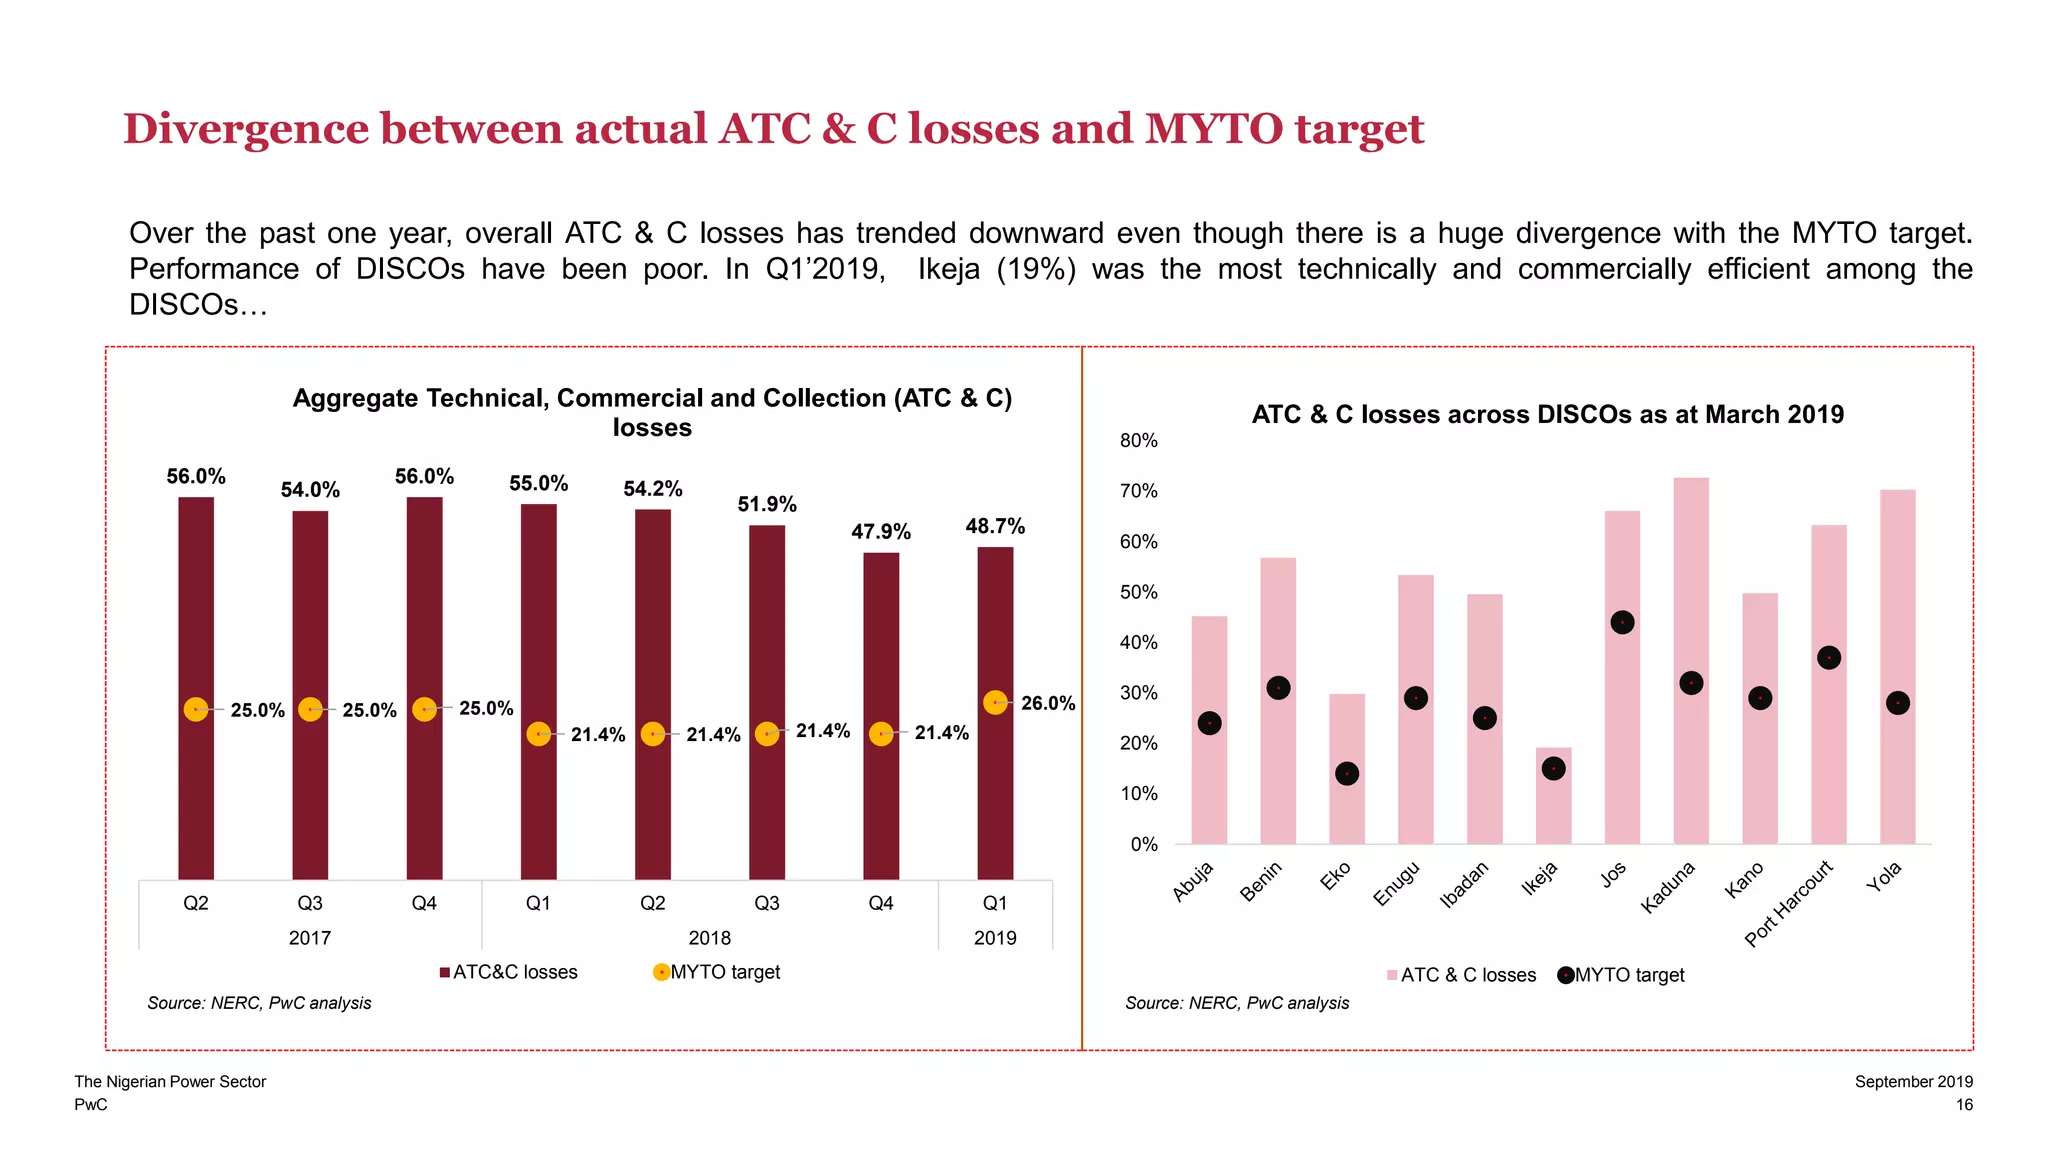
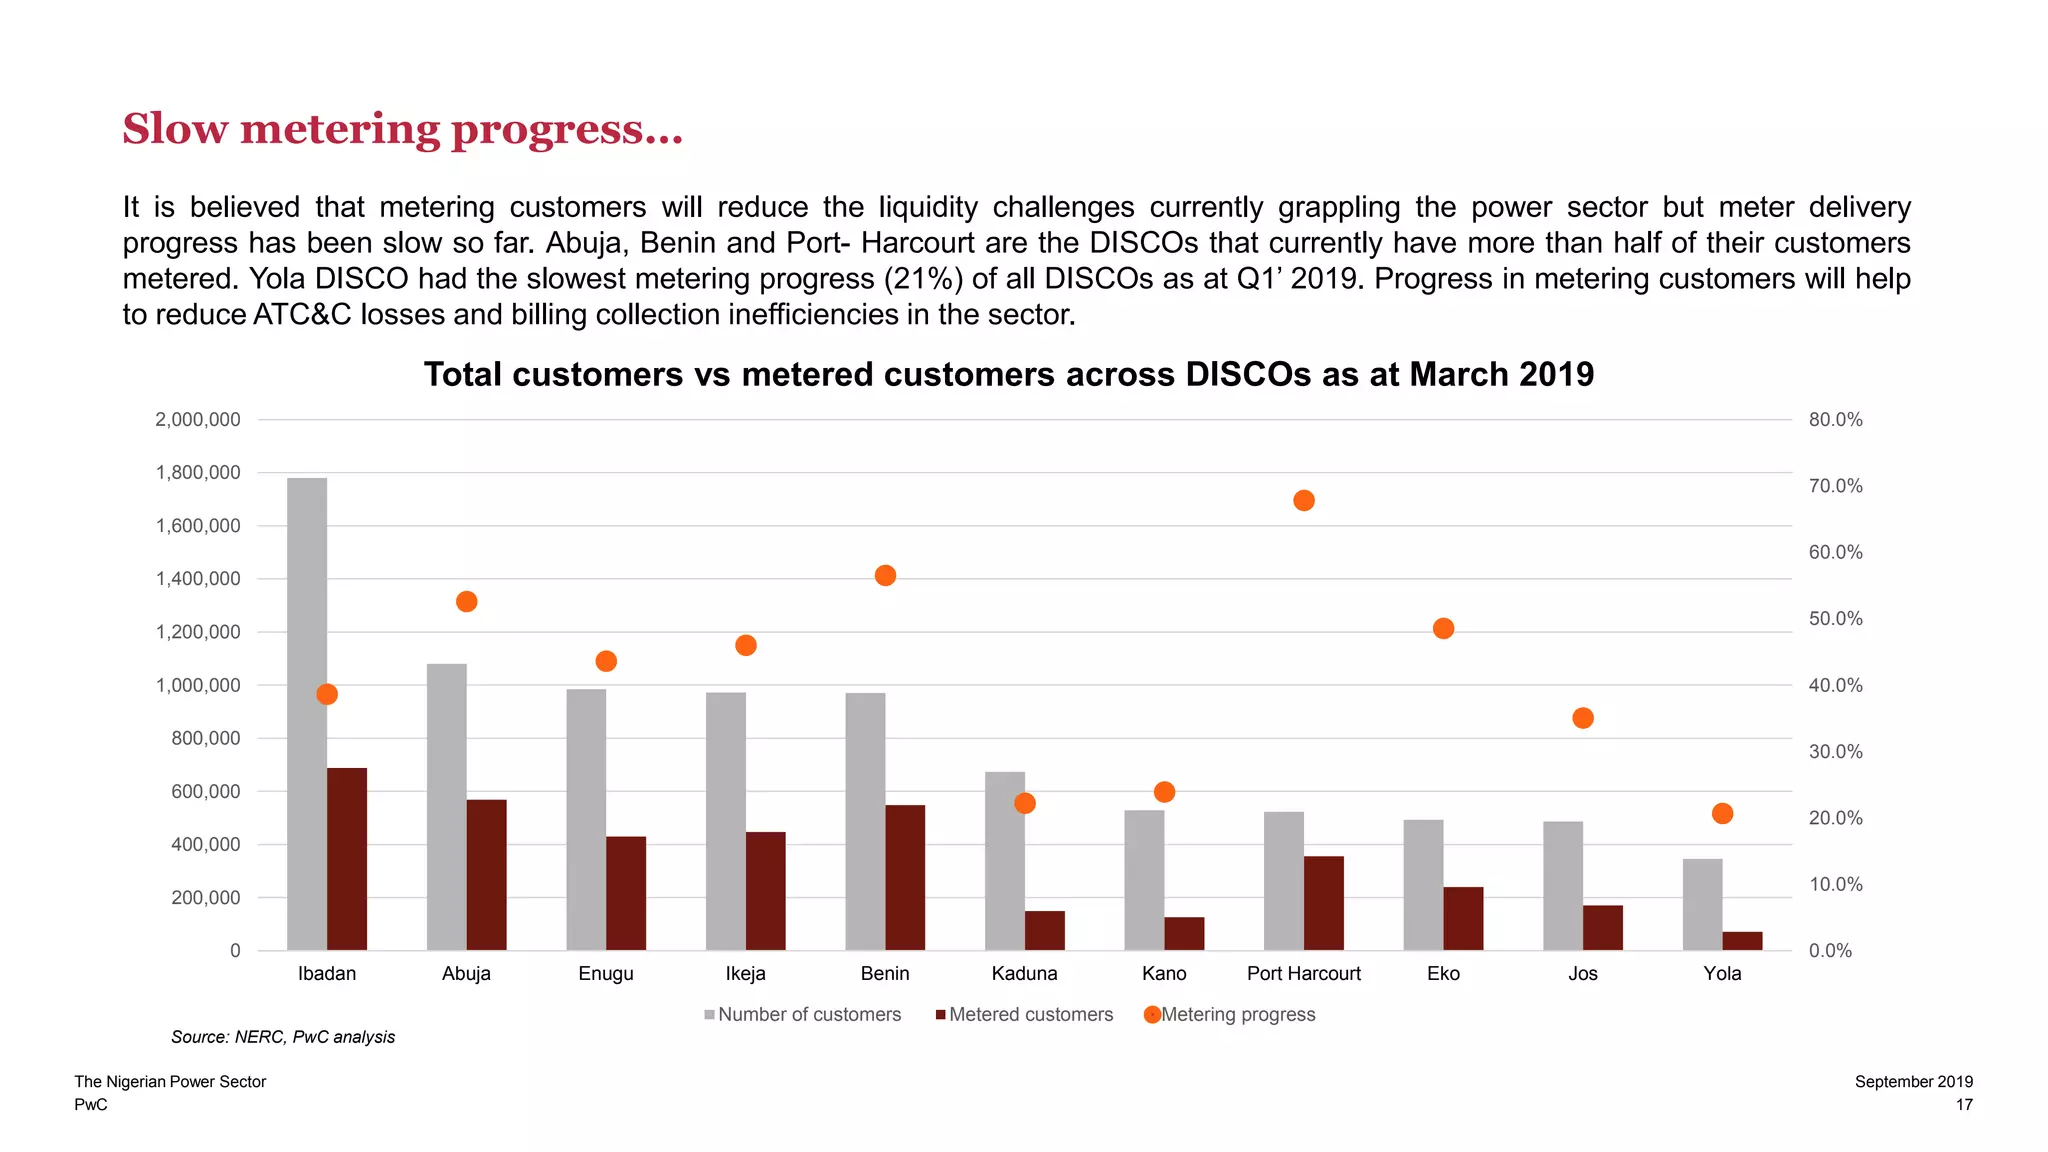
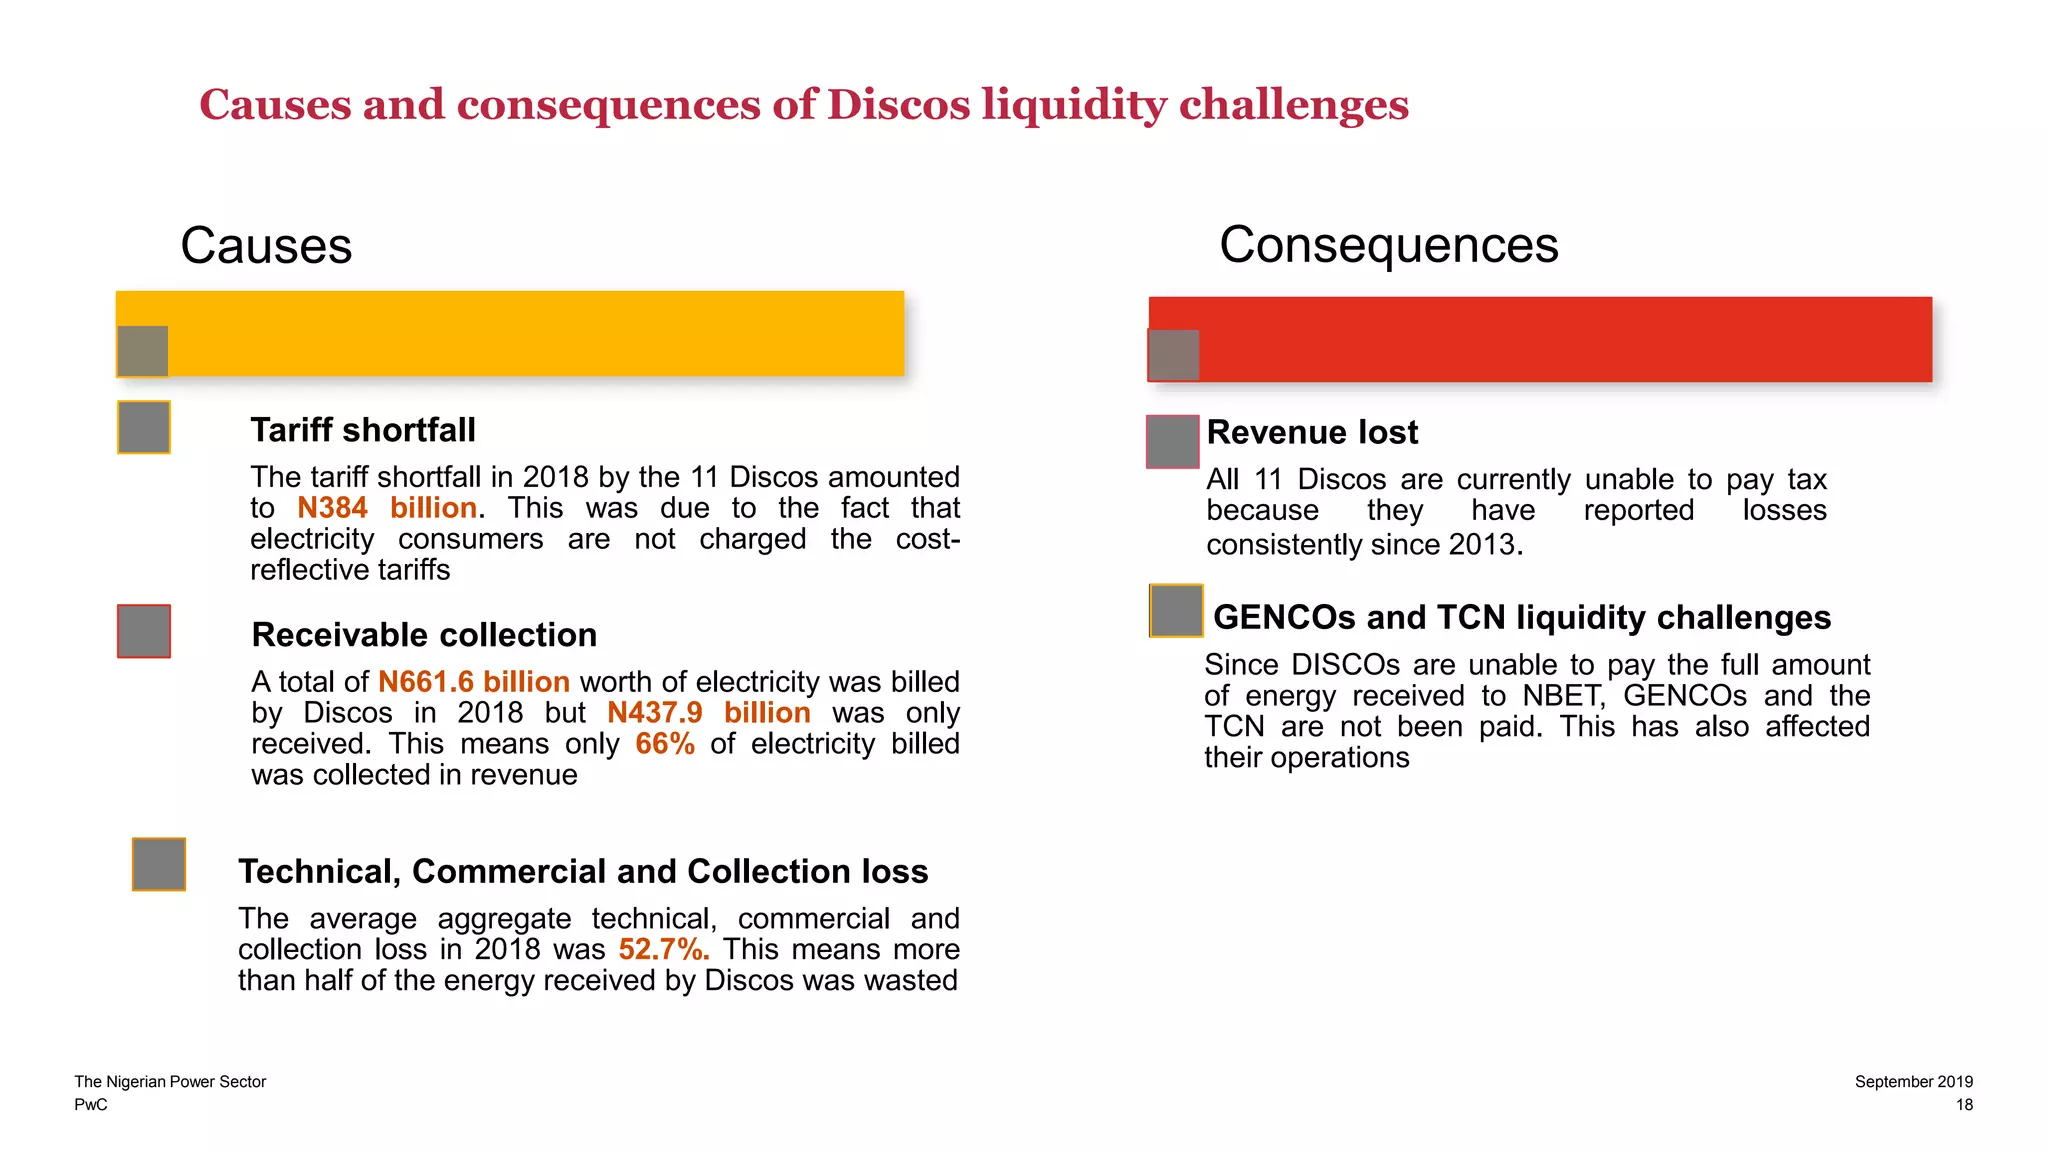

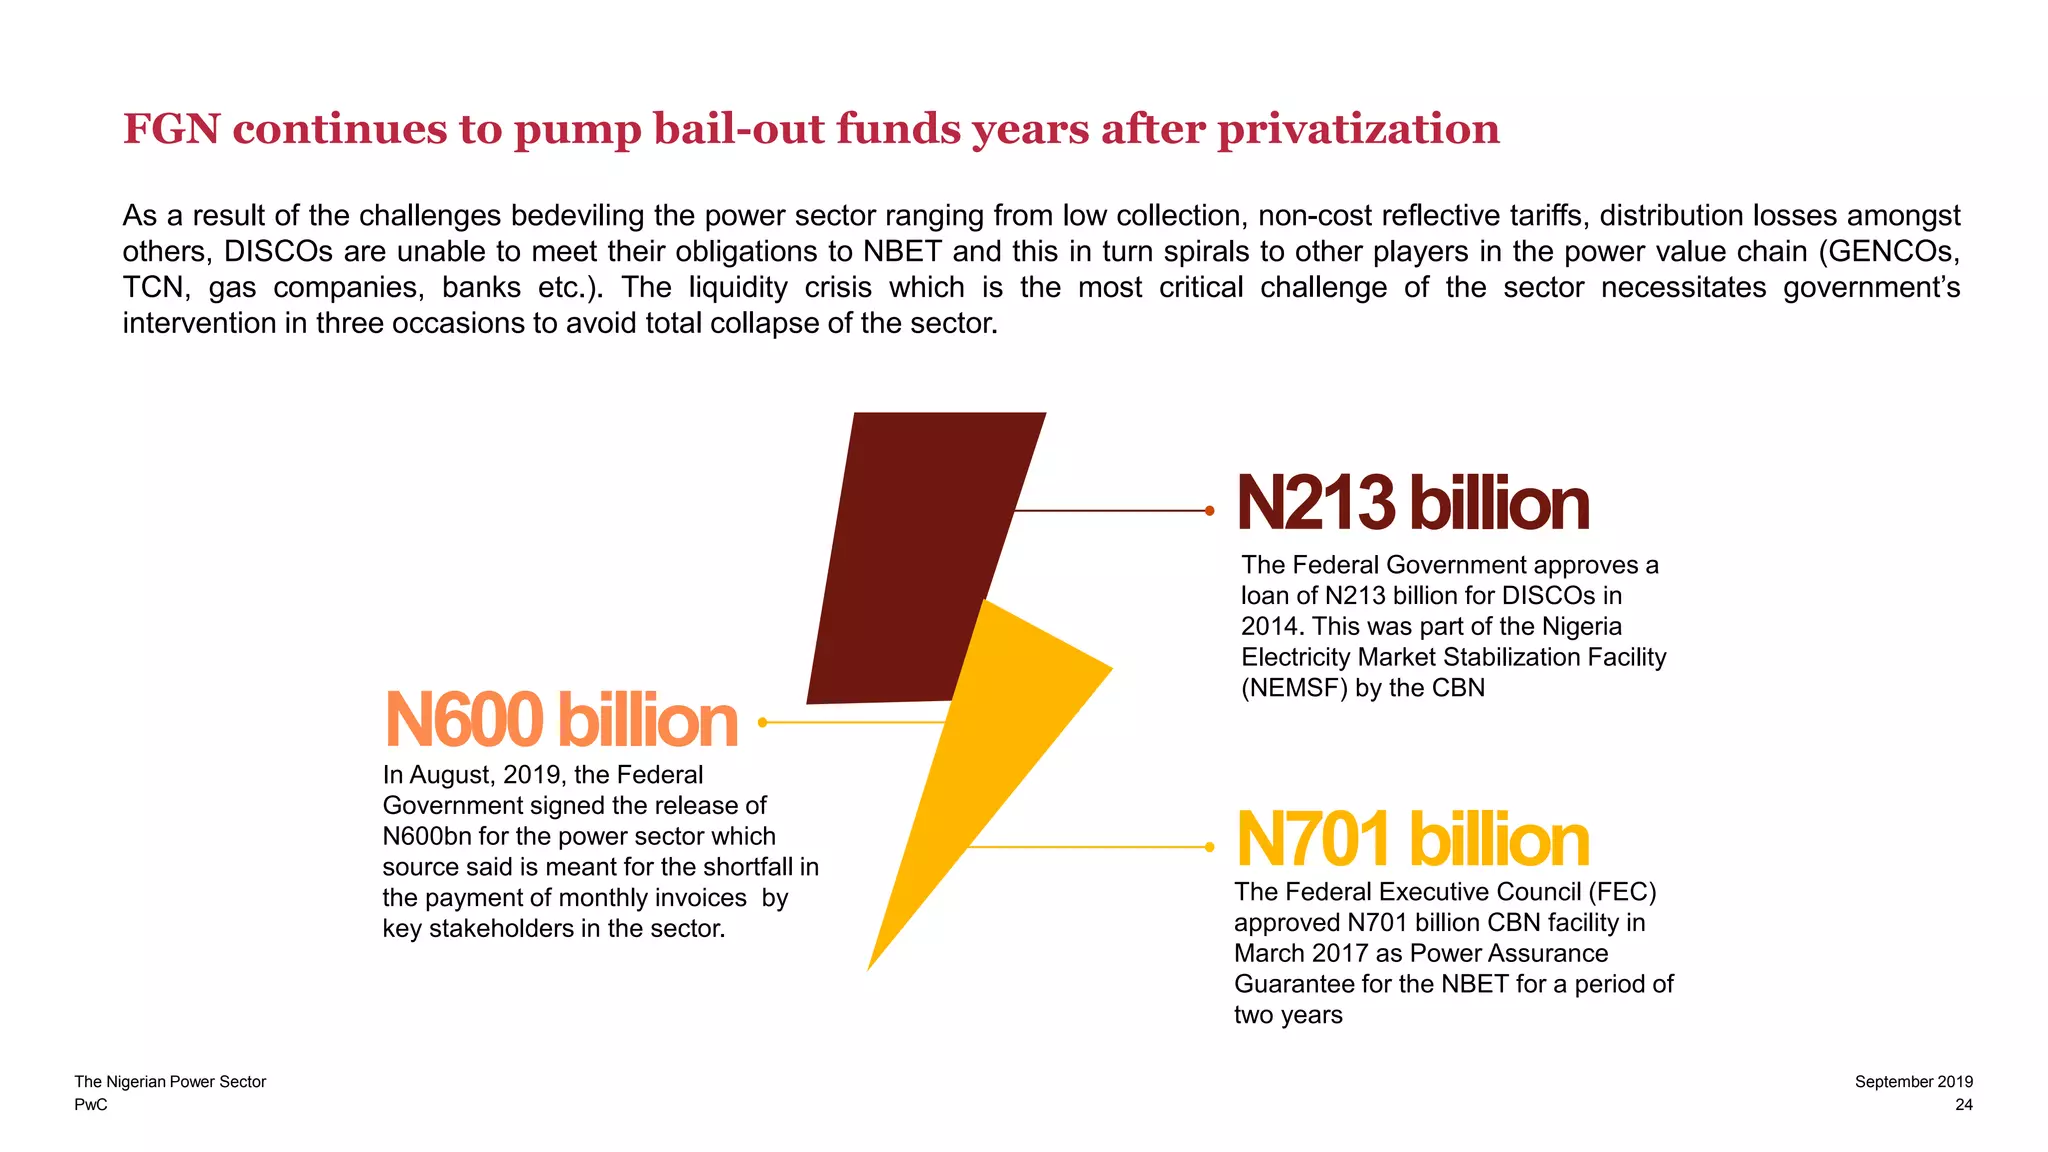
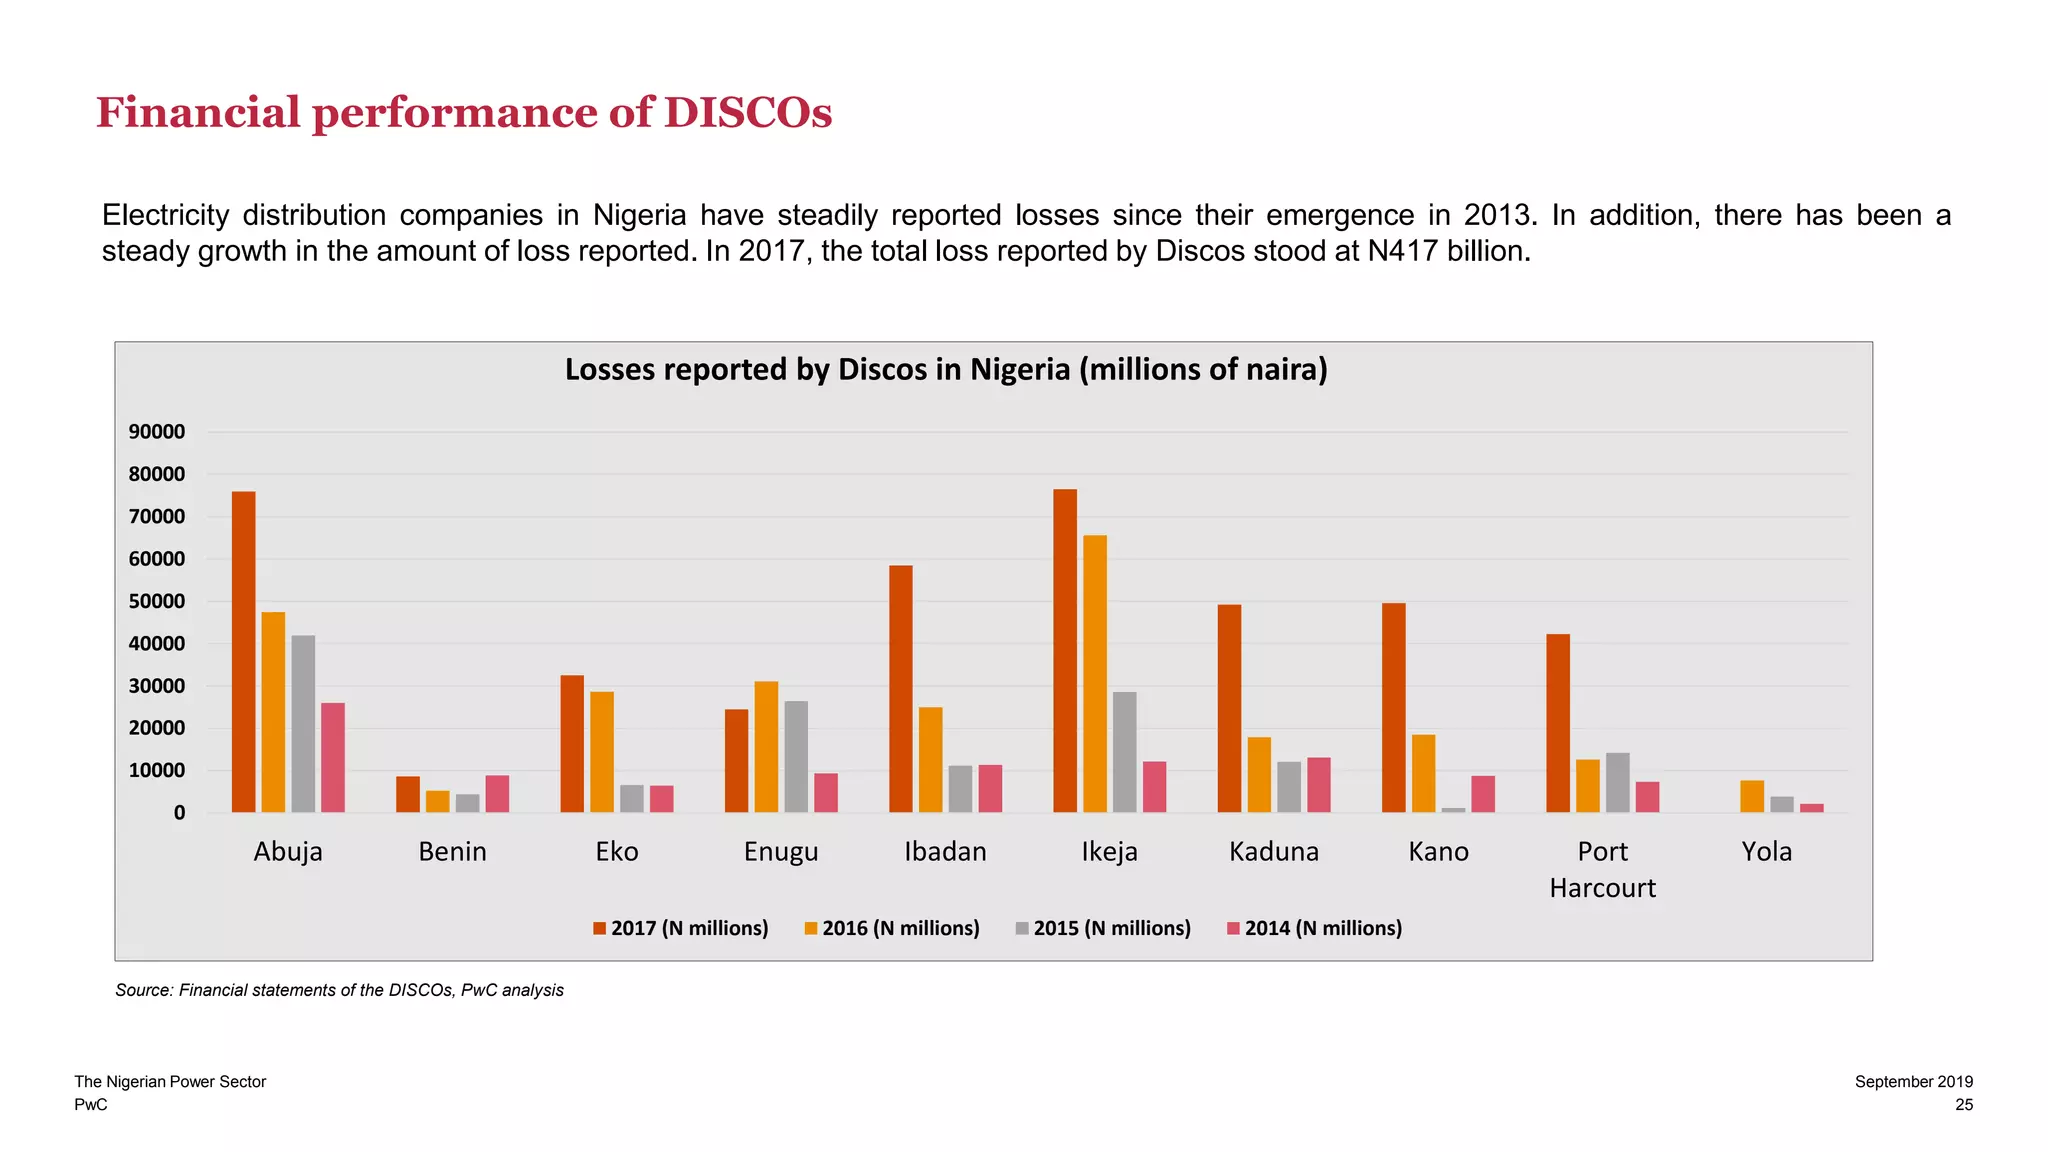
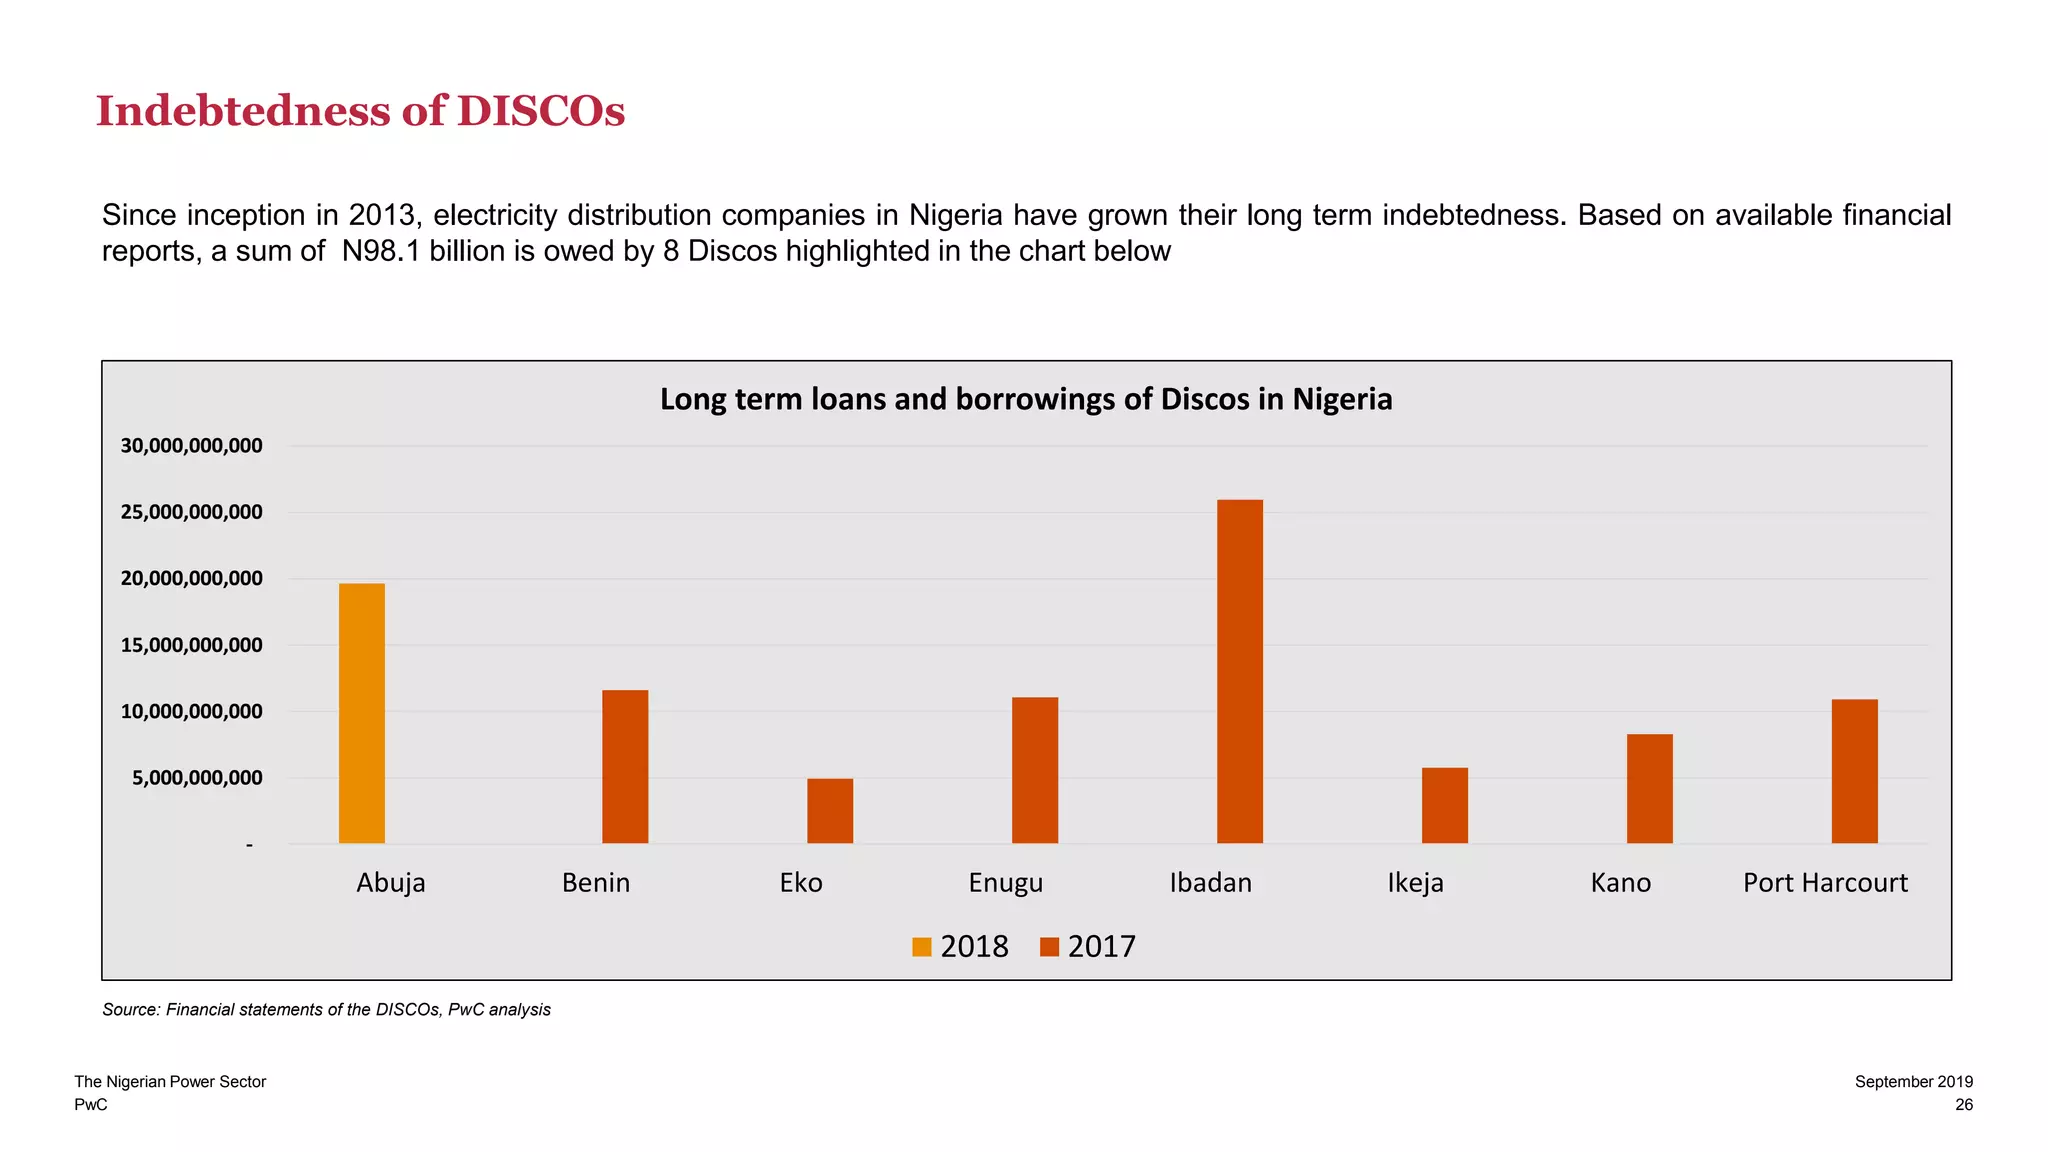

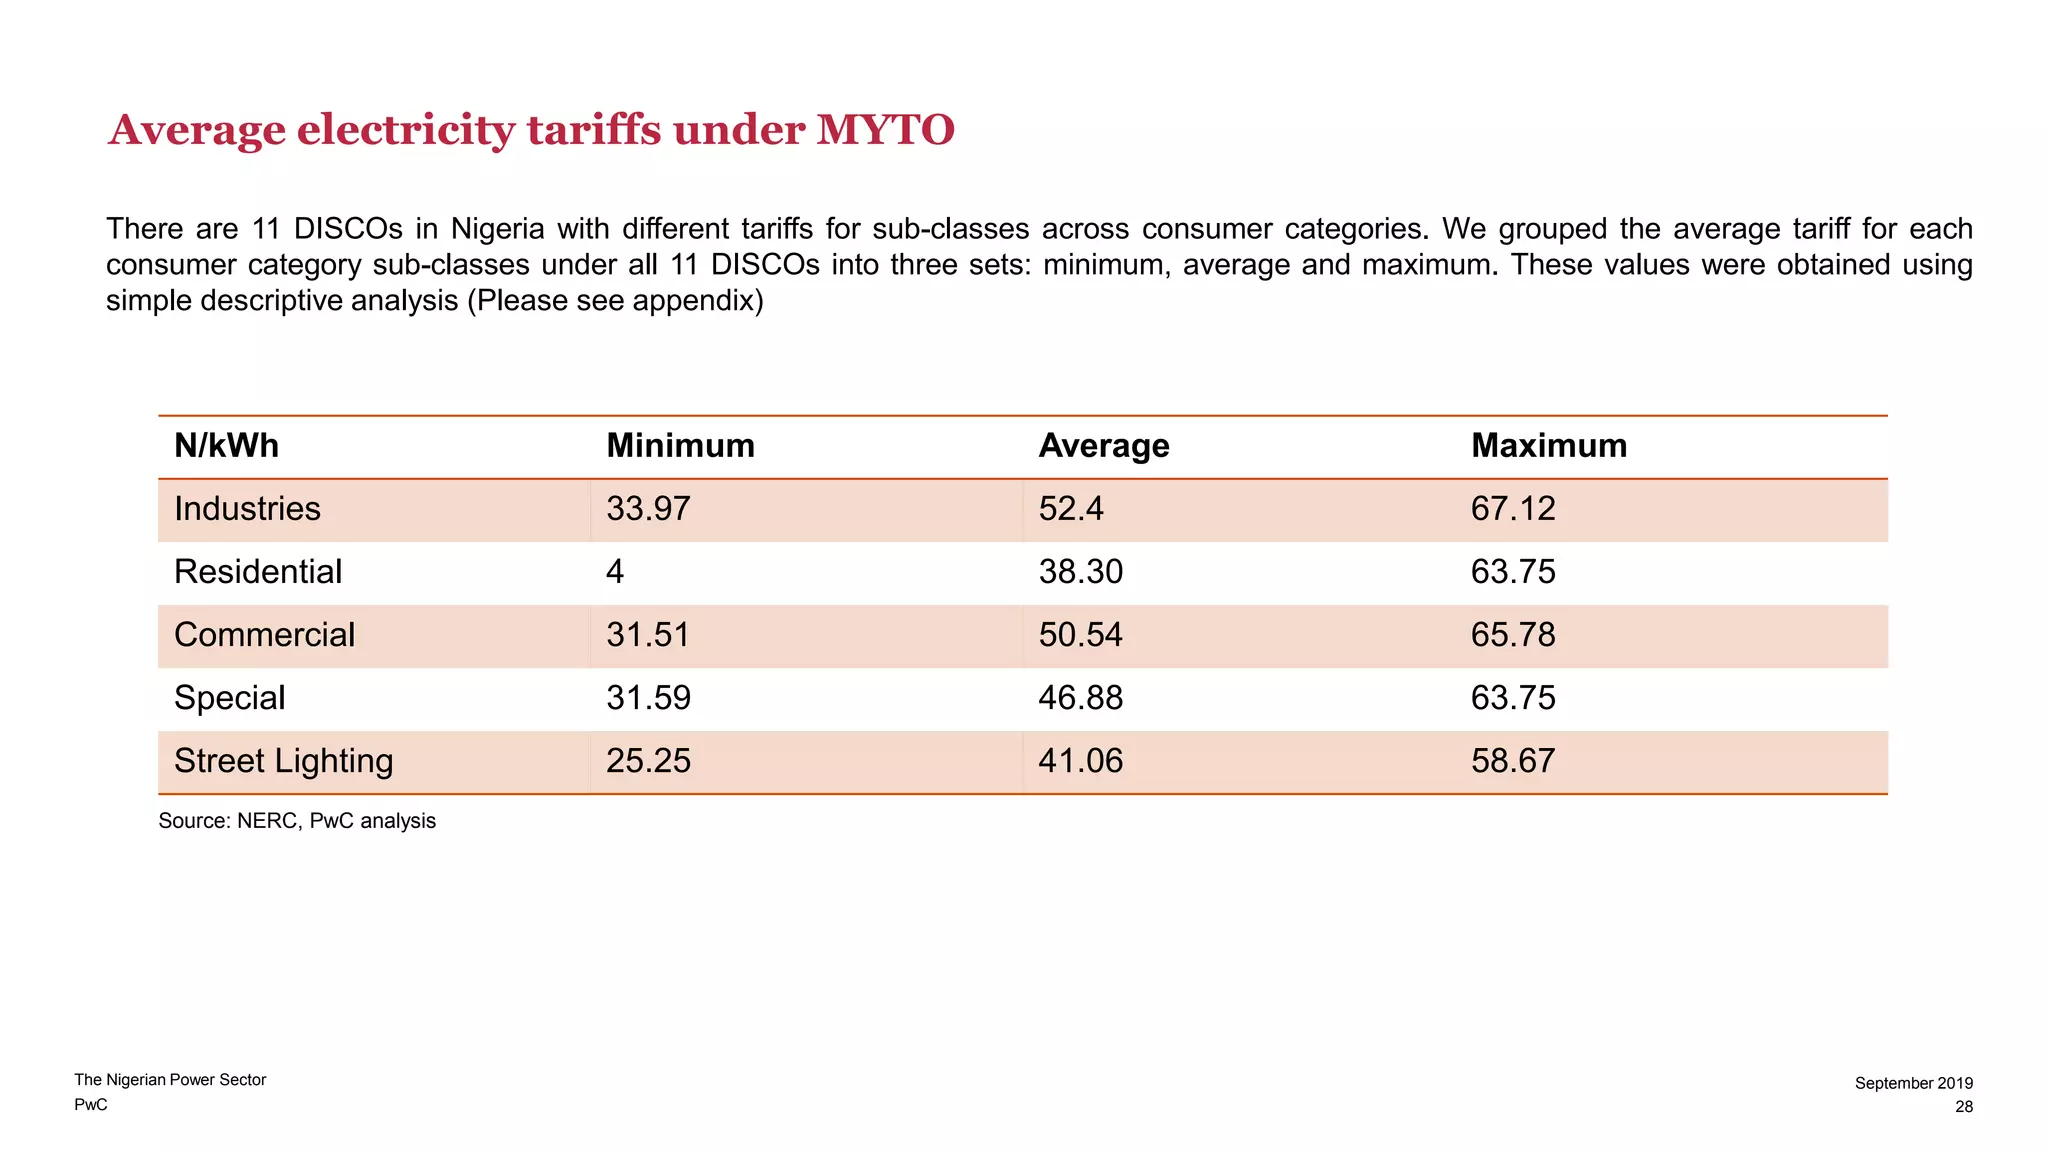
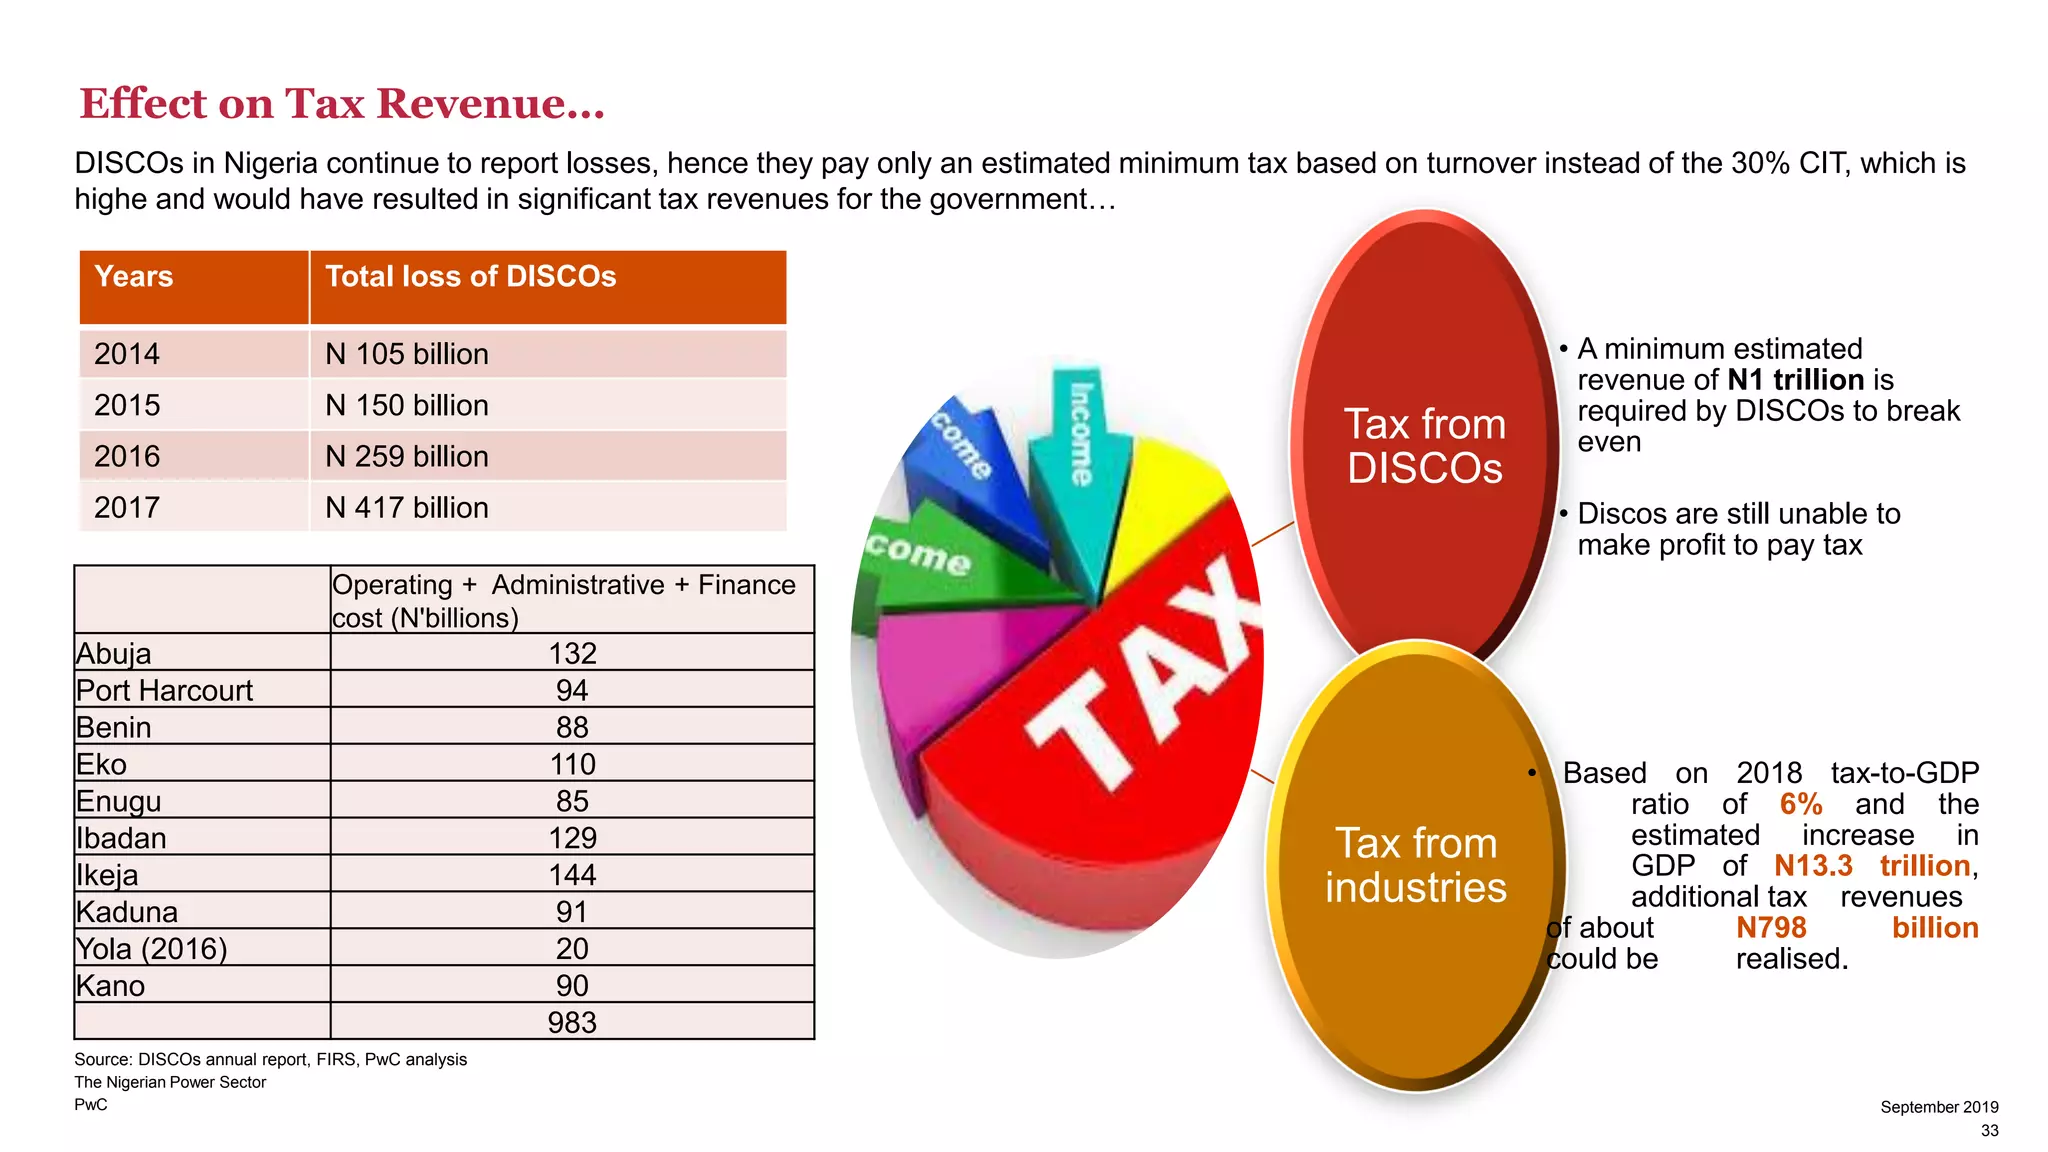


The white paper discusses the liquidity crisis in the Nigerian power sector, highlighting the inadequate supply of gas to thermal plants, outdated infrastructure, and low electricity tariff rates as critical challenges. Despite the growing demand for electricity, driven by population and industrial growth, the sector's operational capacity remains insufficient, with over 40% of the population lacking access to reliable electricity. The liquidity issues are exacerbated by low remittances from distribution companies to the Nigerian Bulk Electricity Trading PLC, which negatively impact the entire electricity supply chain.


