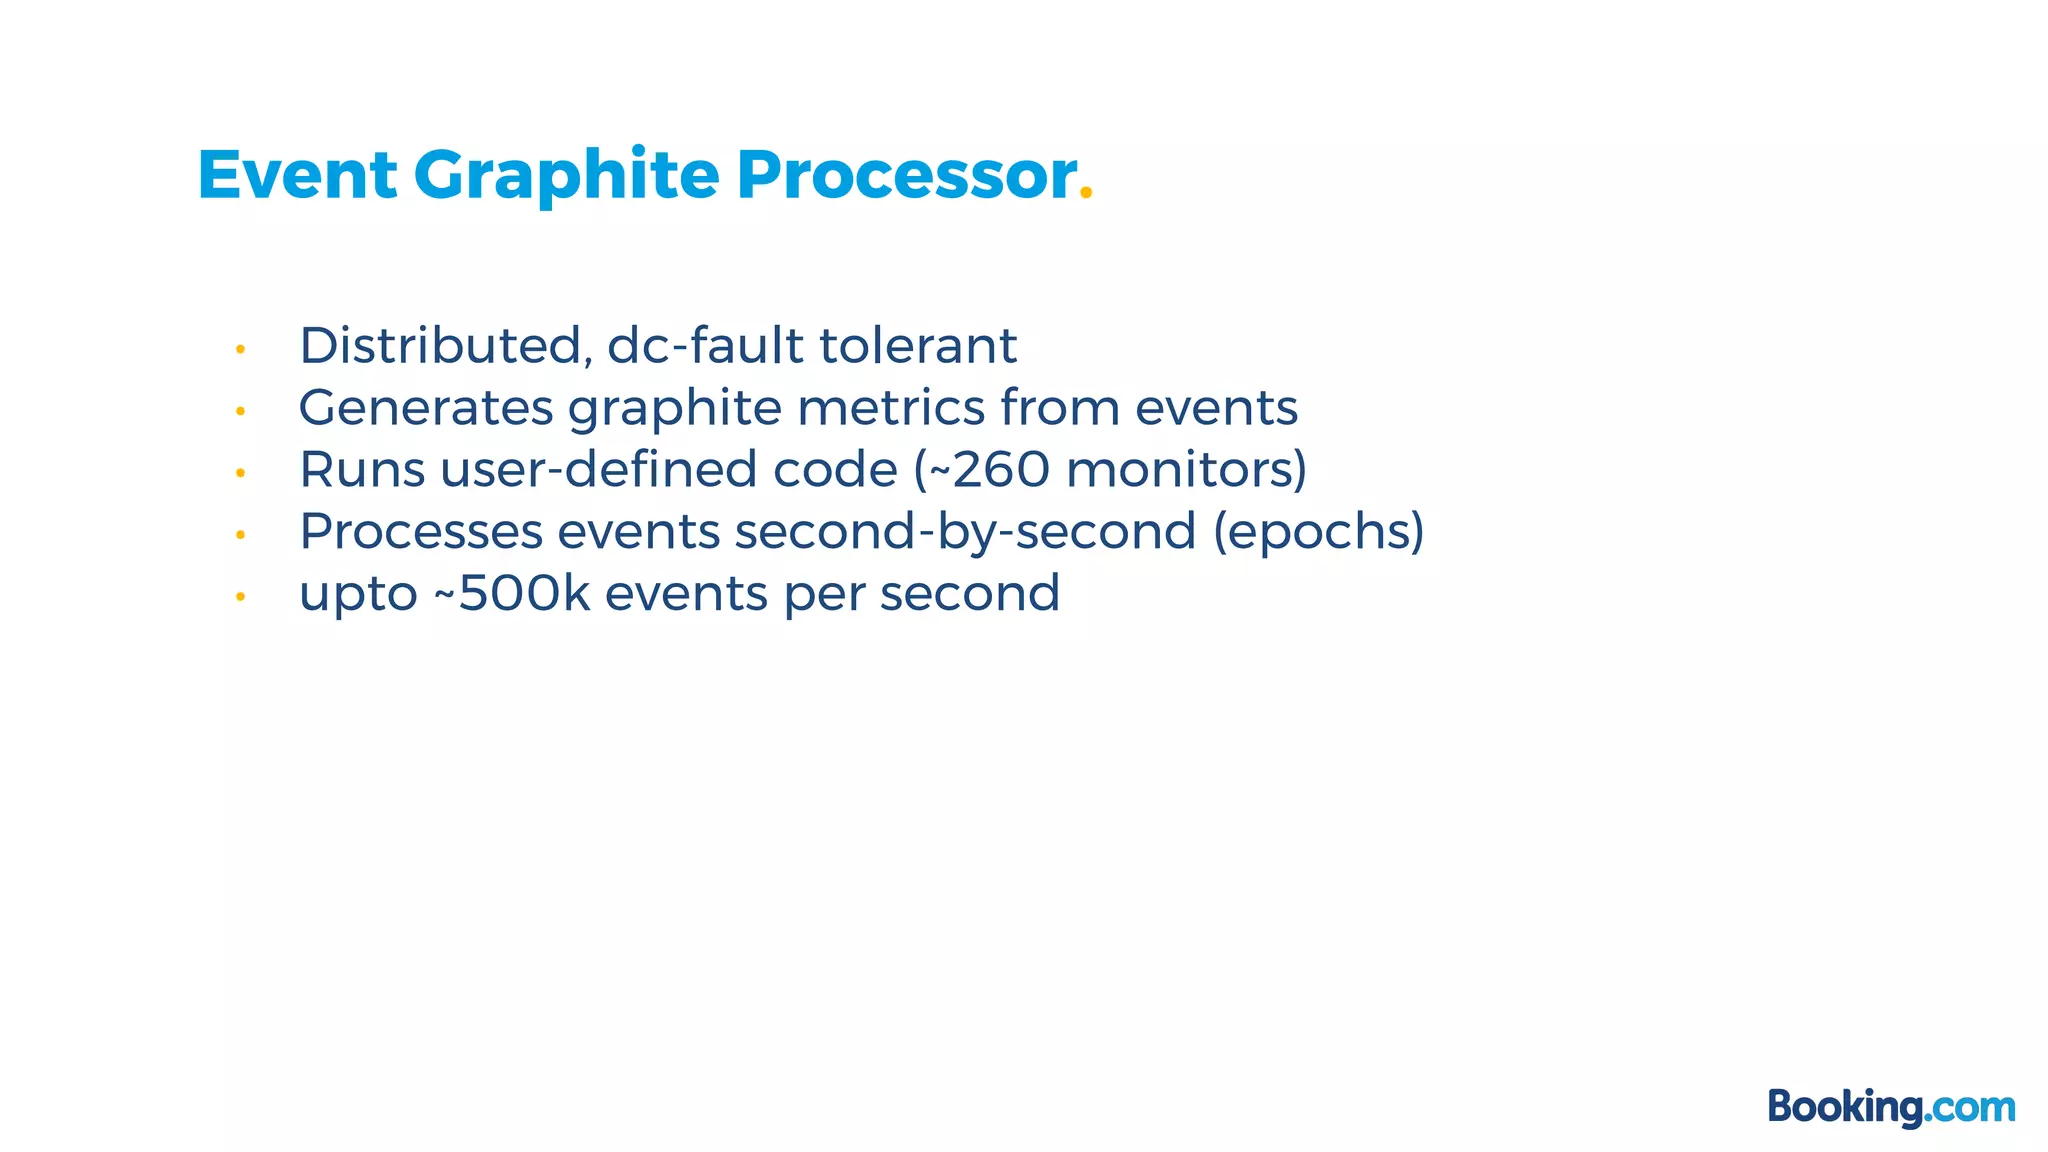
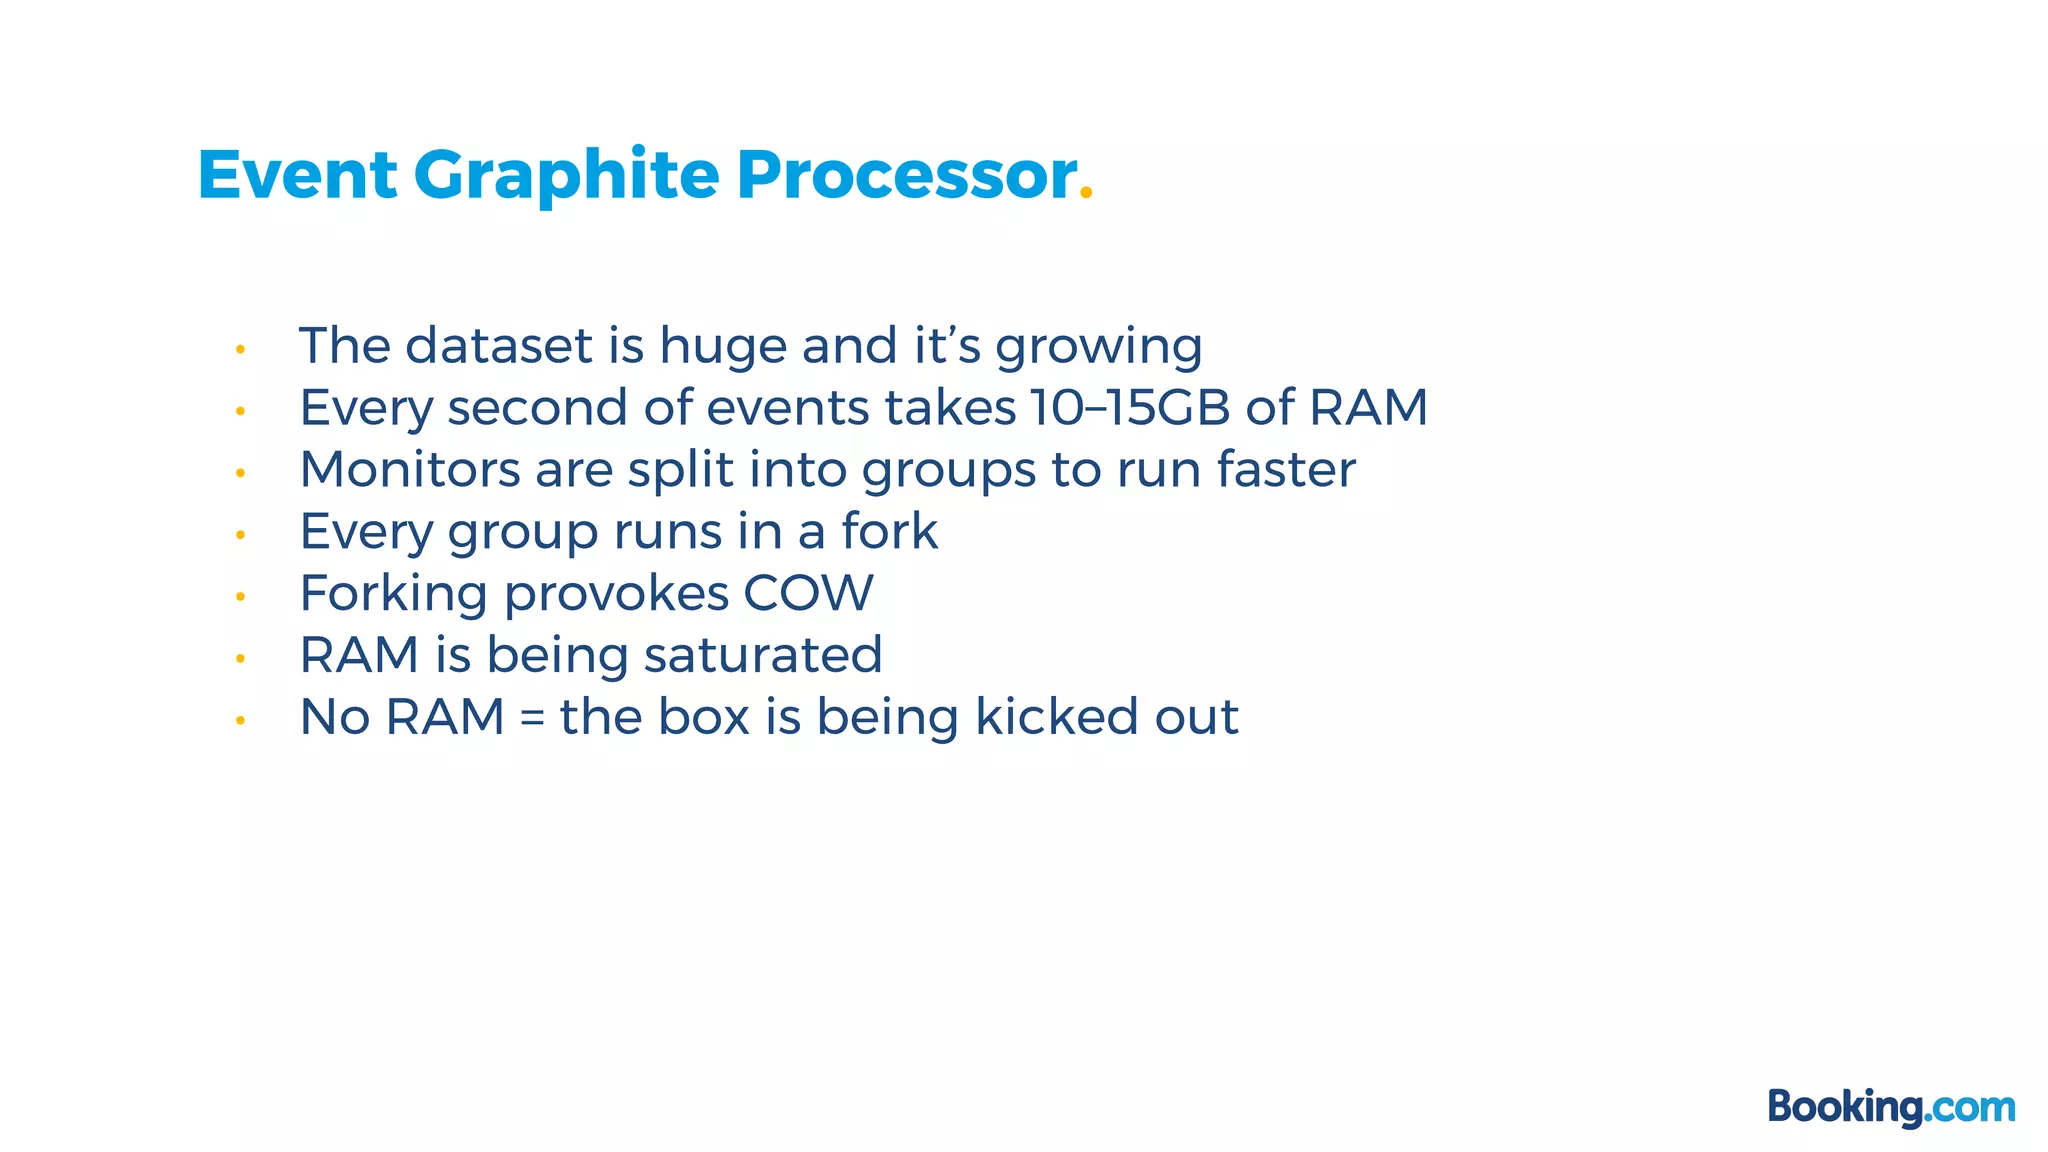
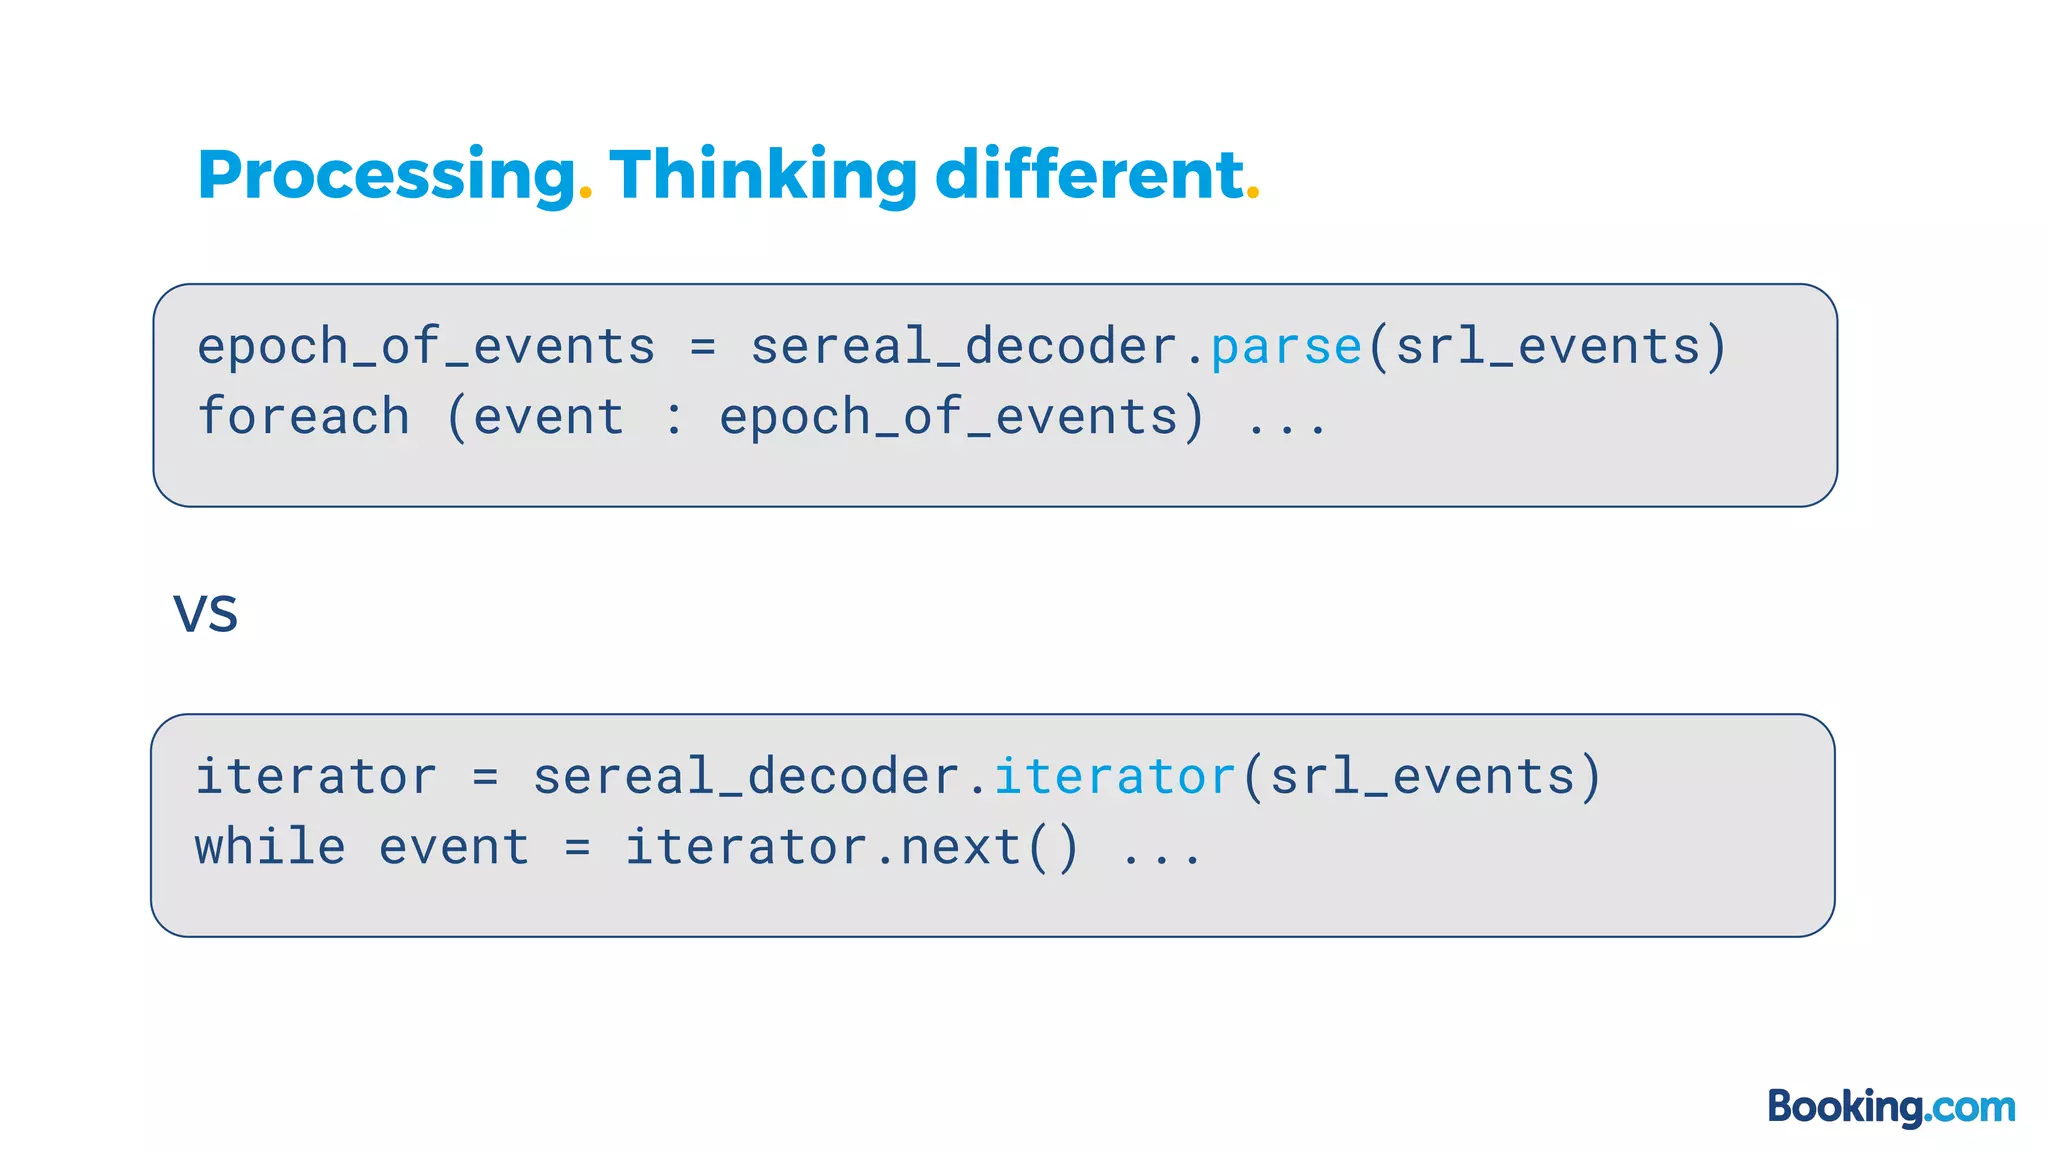
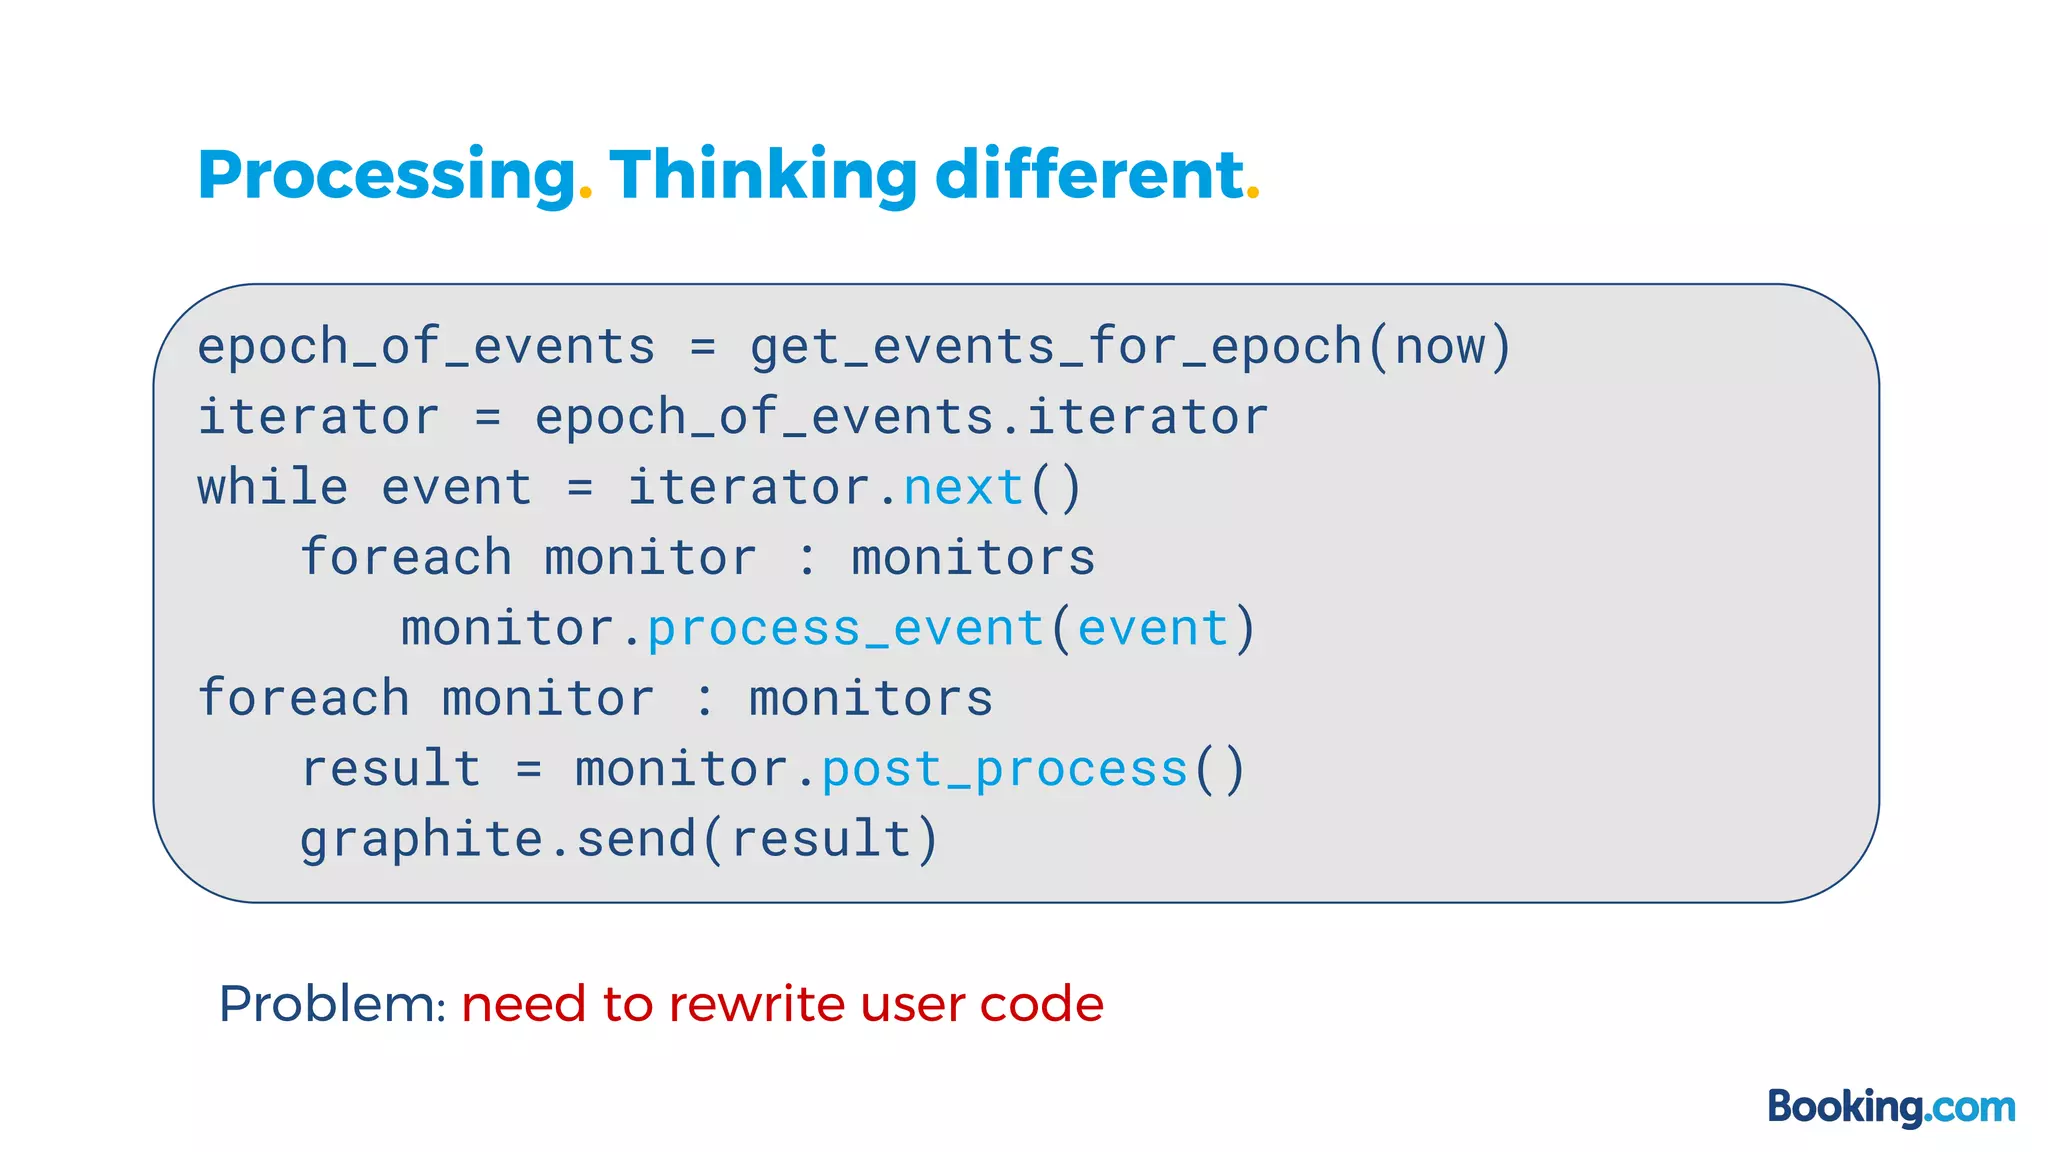
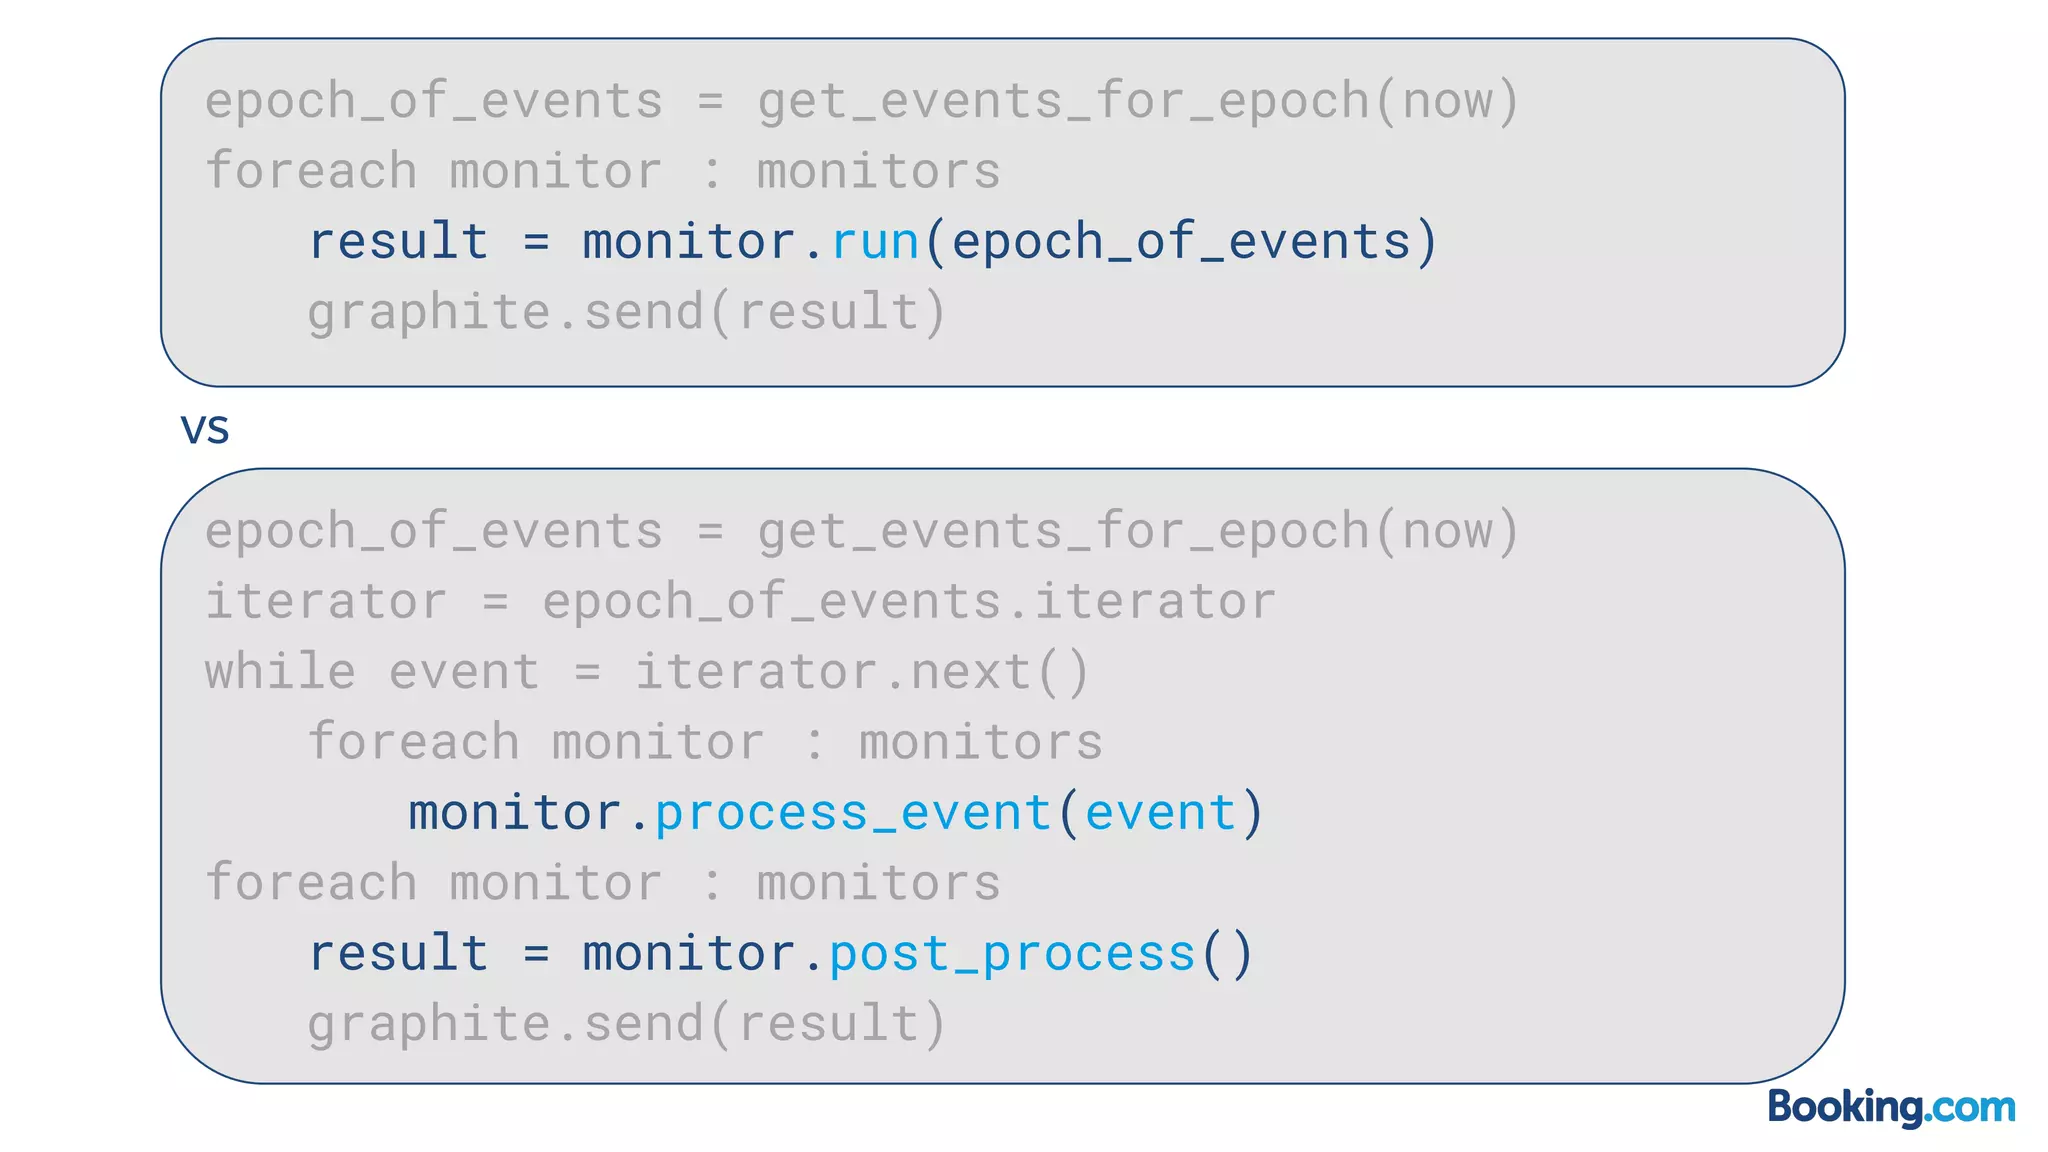
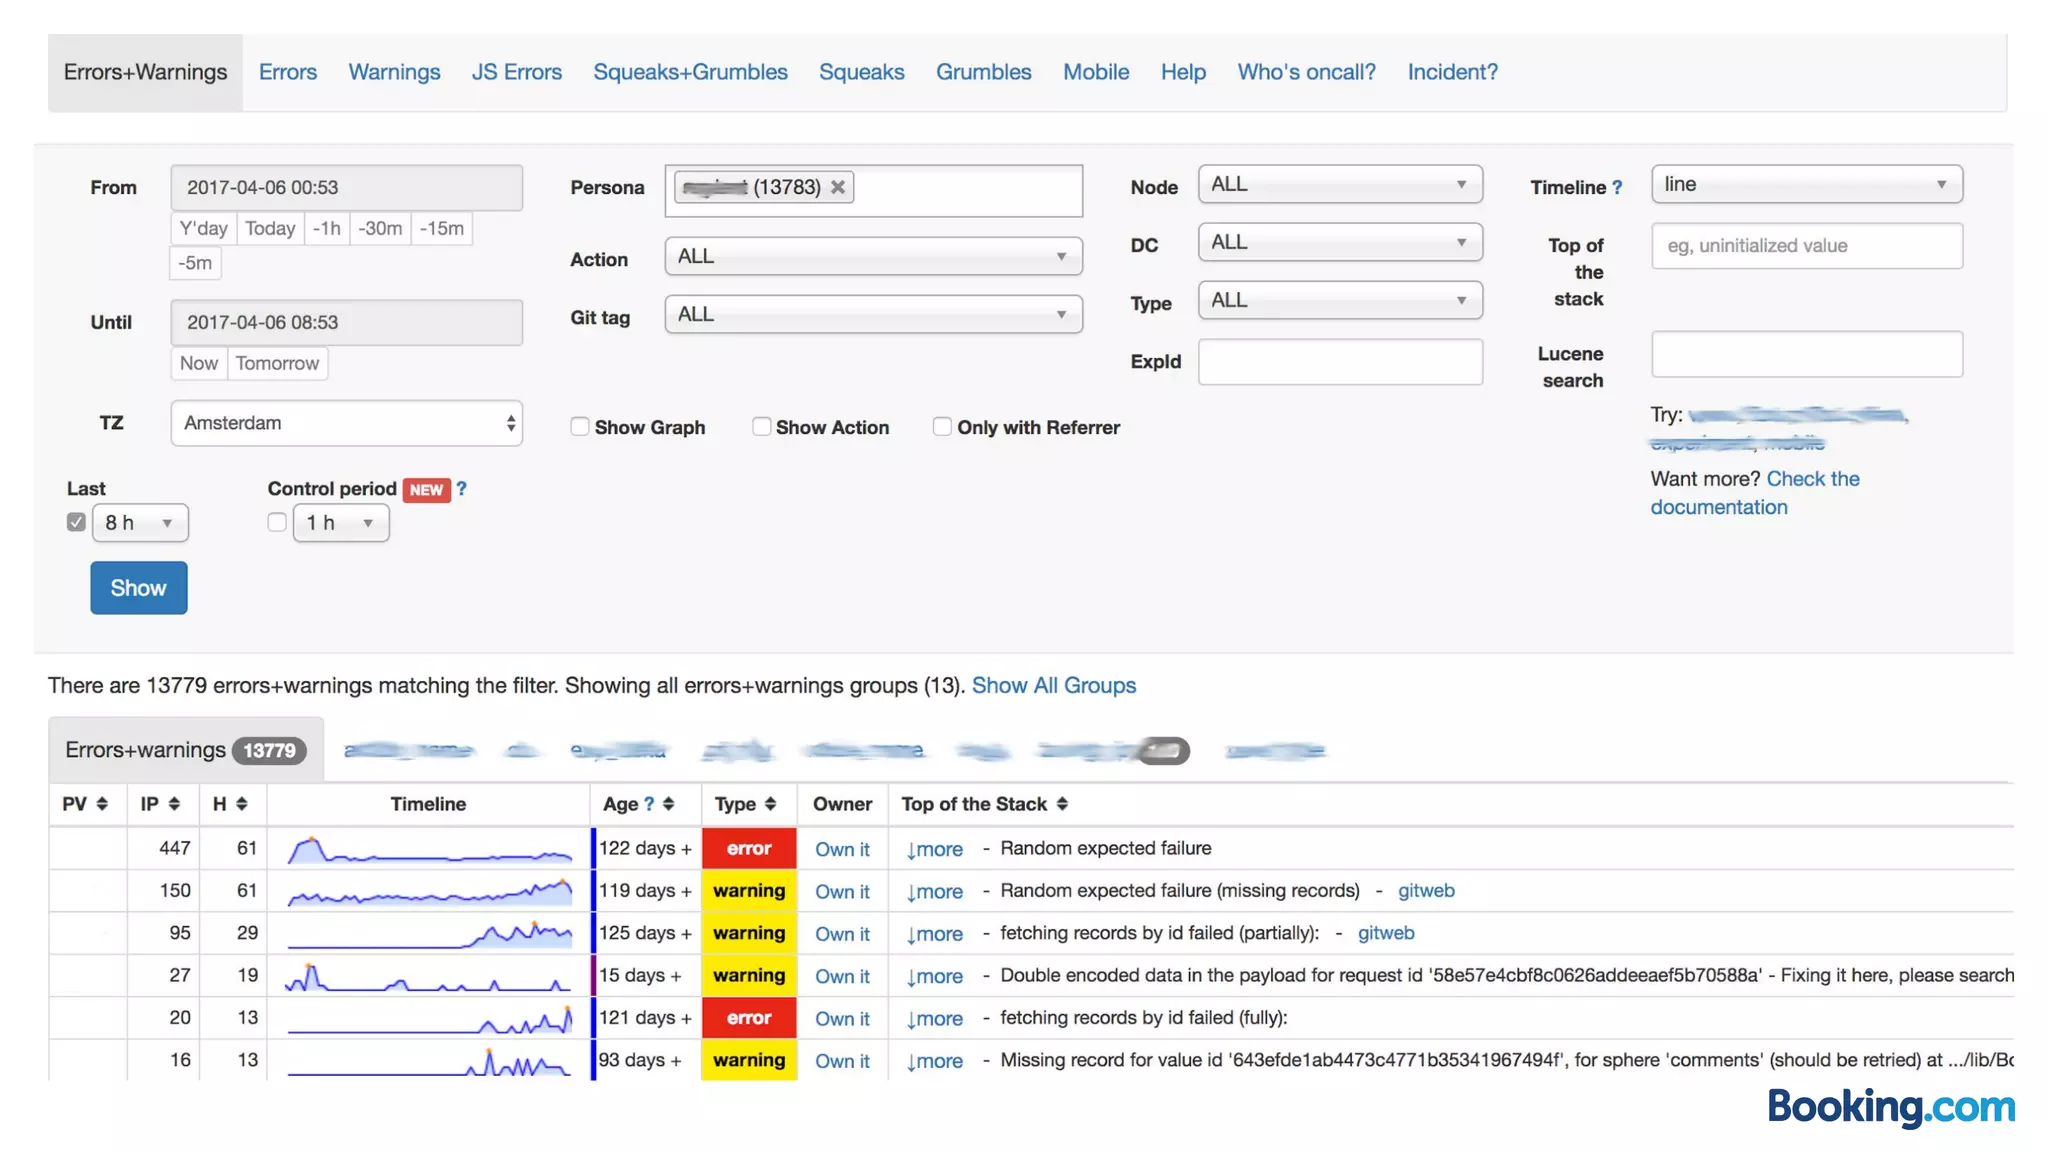
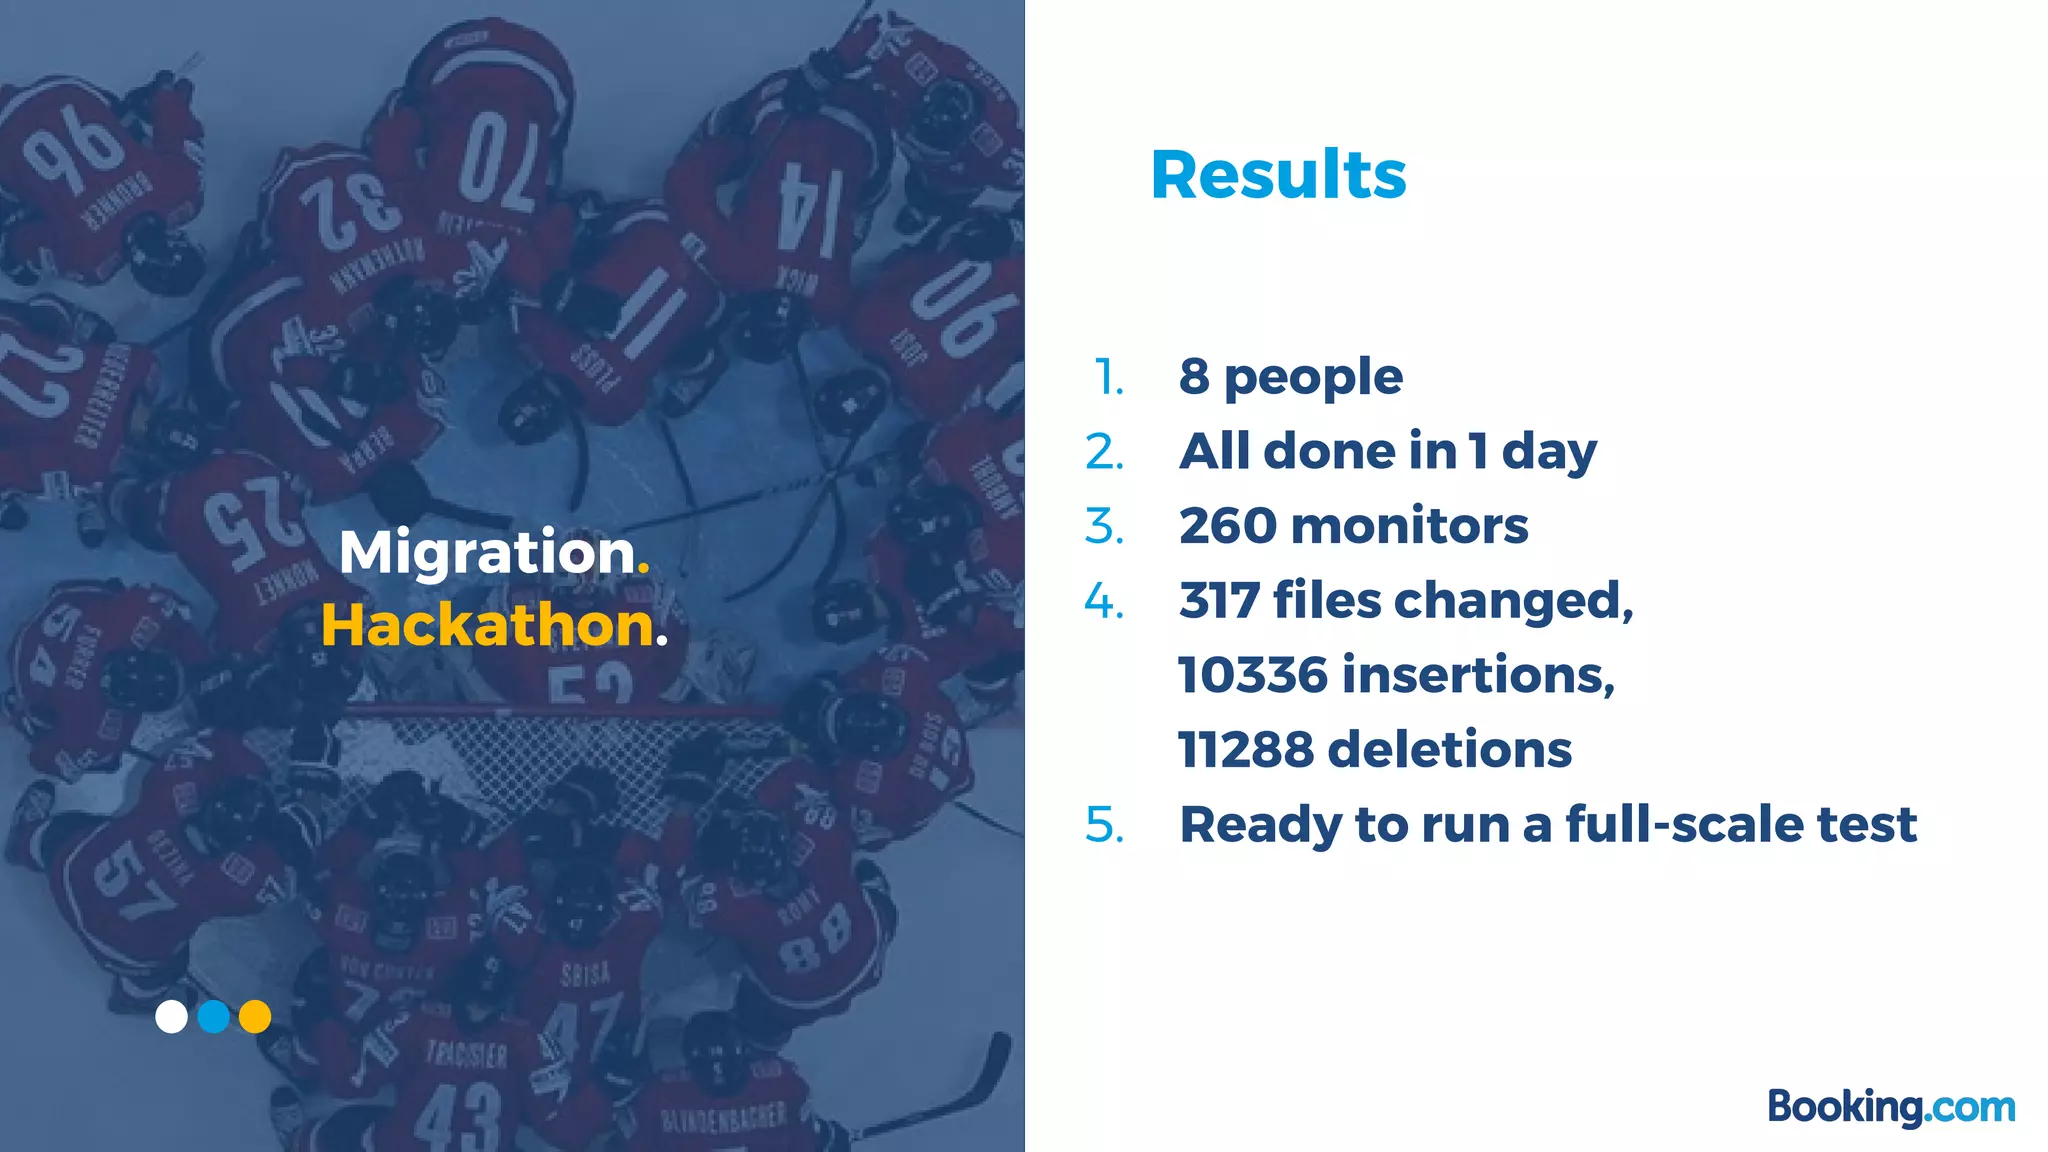
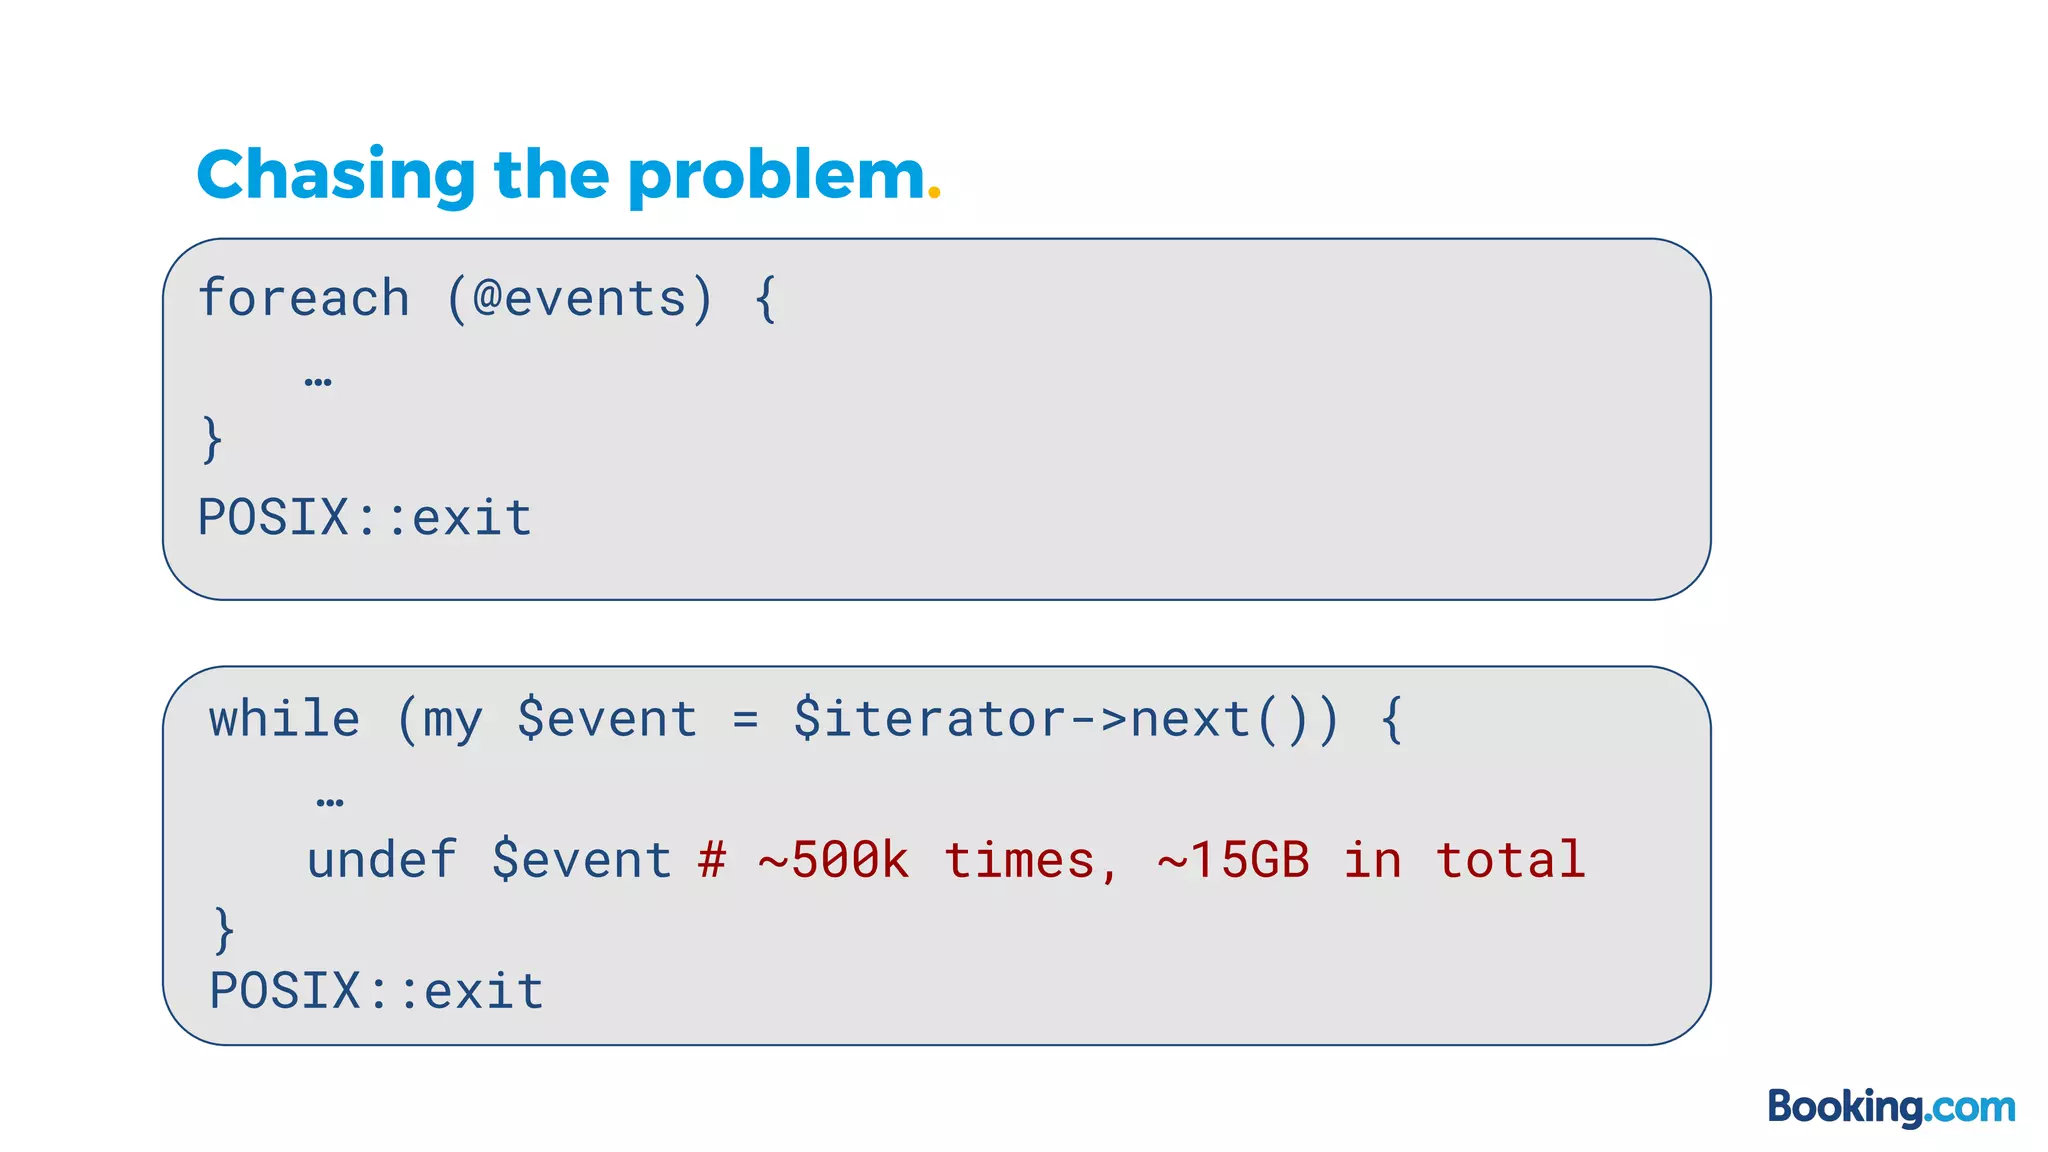
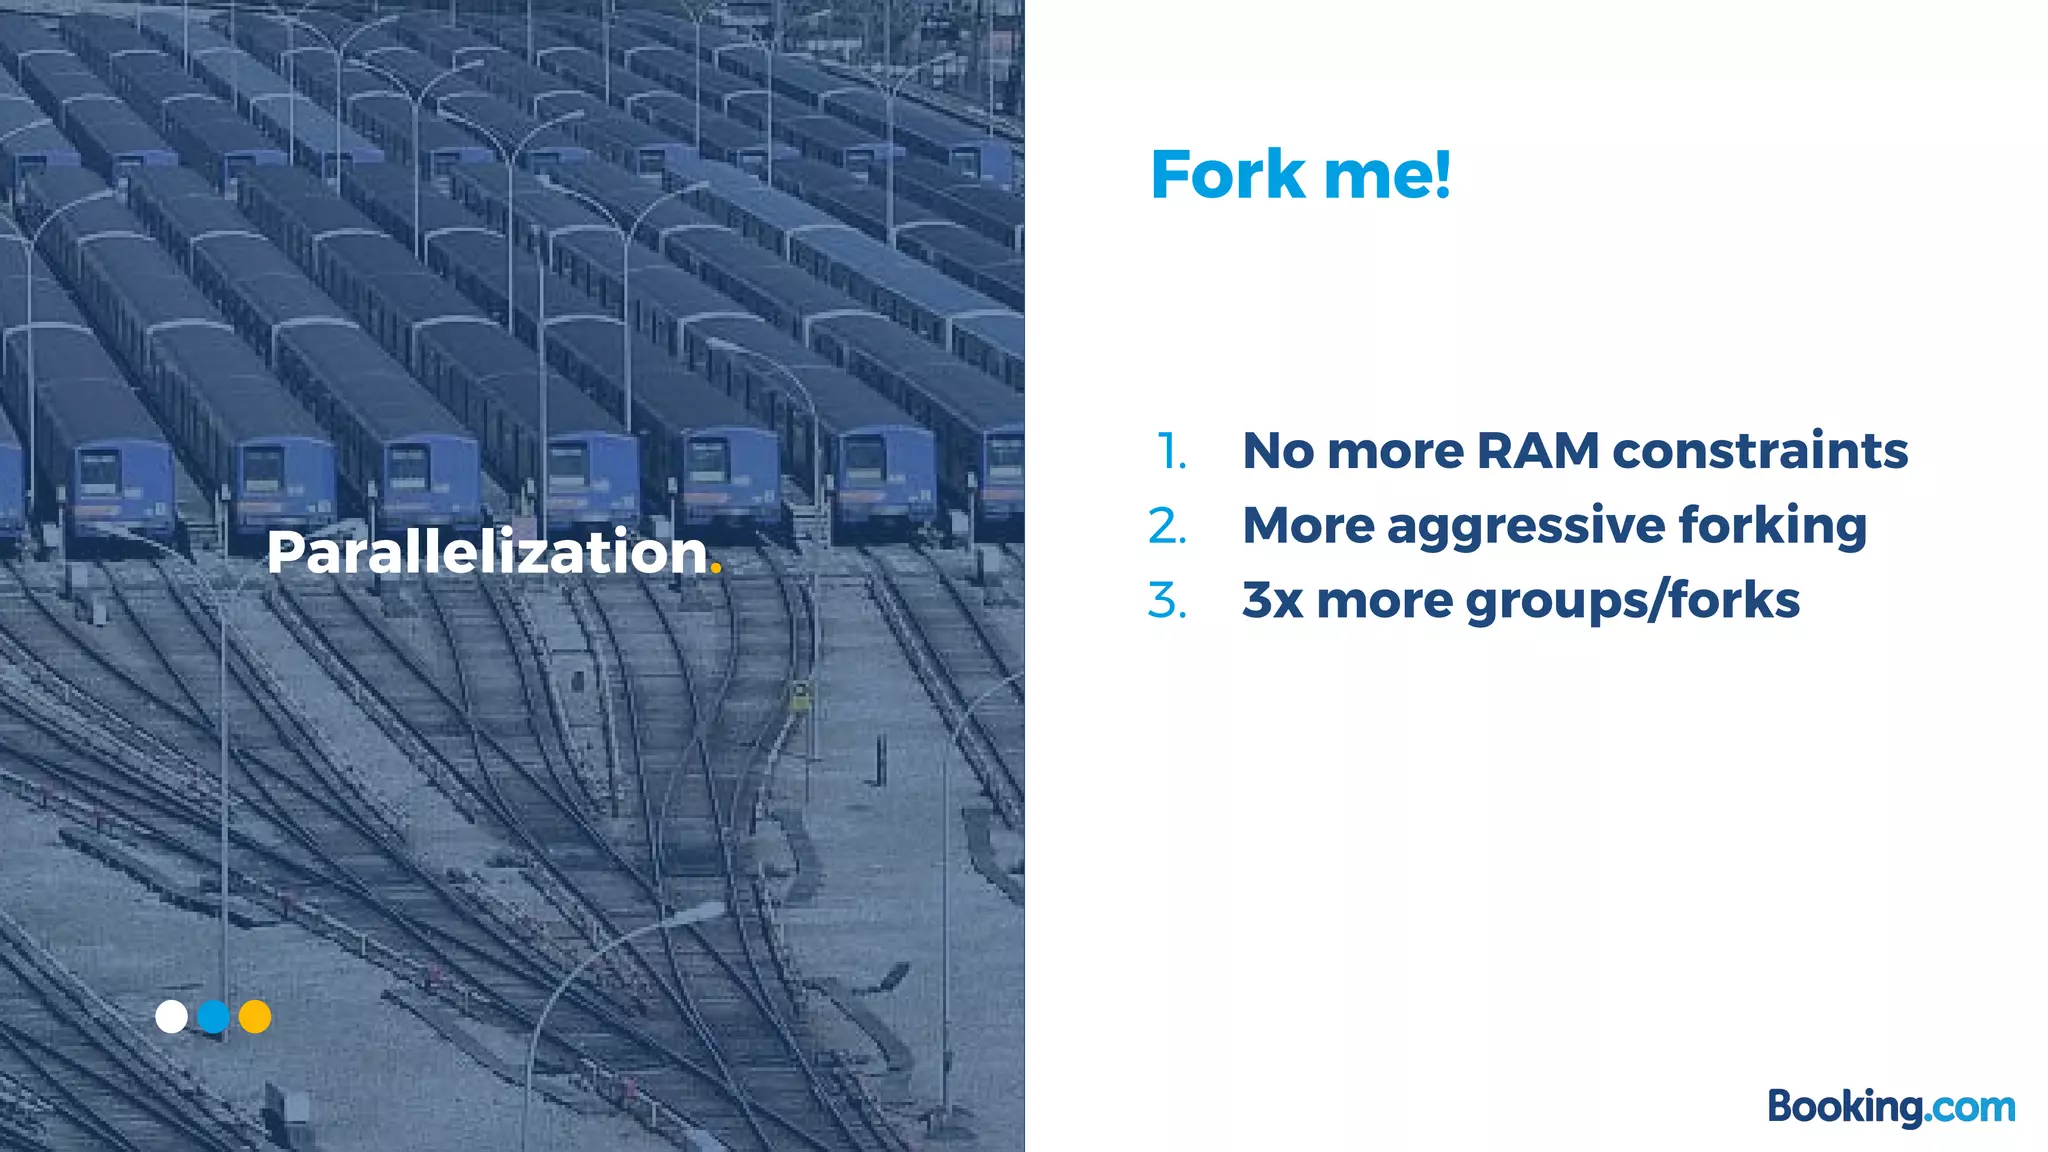
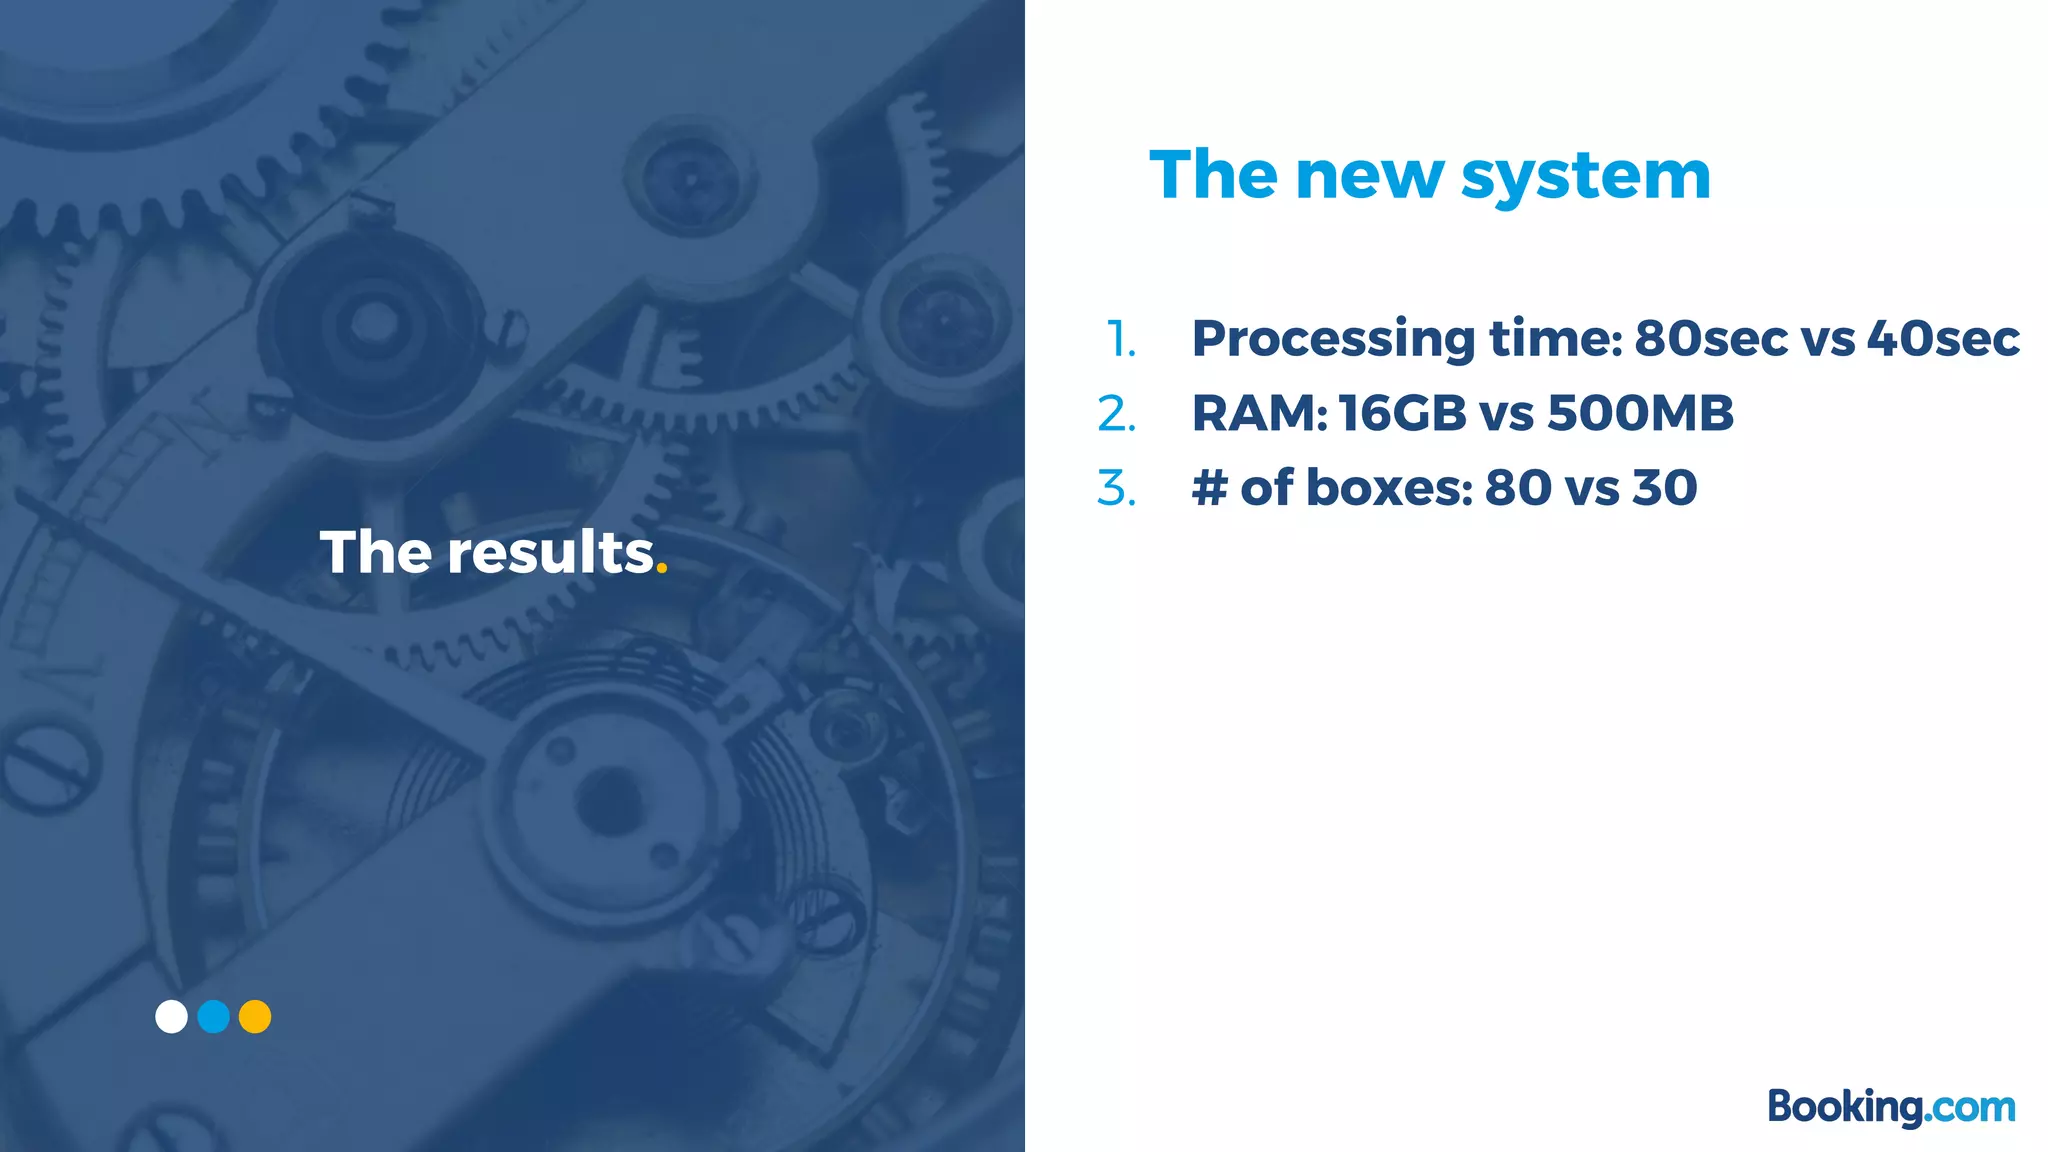
This document summarizes how Booking.com solved scalability issues with their Event Graphite Processor (EGP) system. The EGP processes large volumes of event data to generate metrics but was limited by high RAM usage. A new approach was developed that uses event streaming and parallelization, reducing processing time from over 120 seconds to 80 seconds while using much less RAM. This was achieved through a hackathon that rewrote 260 monitors in one day. The new system uses 56-core servers, processes events in parallel groups, and requires only 500MB of RAM compared to the previous 15GB.

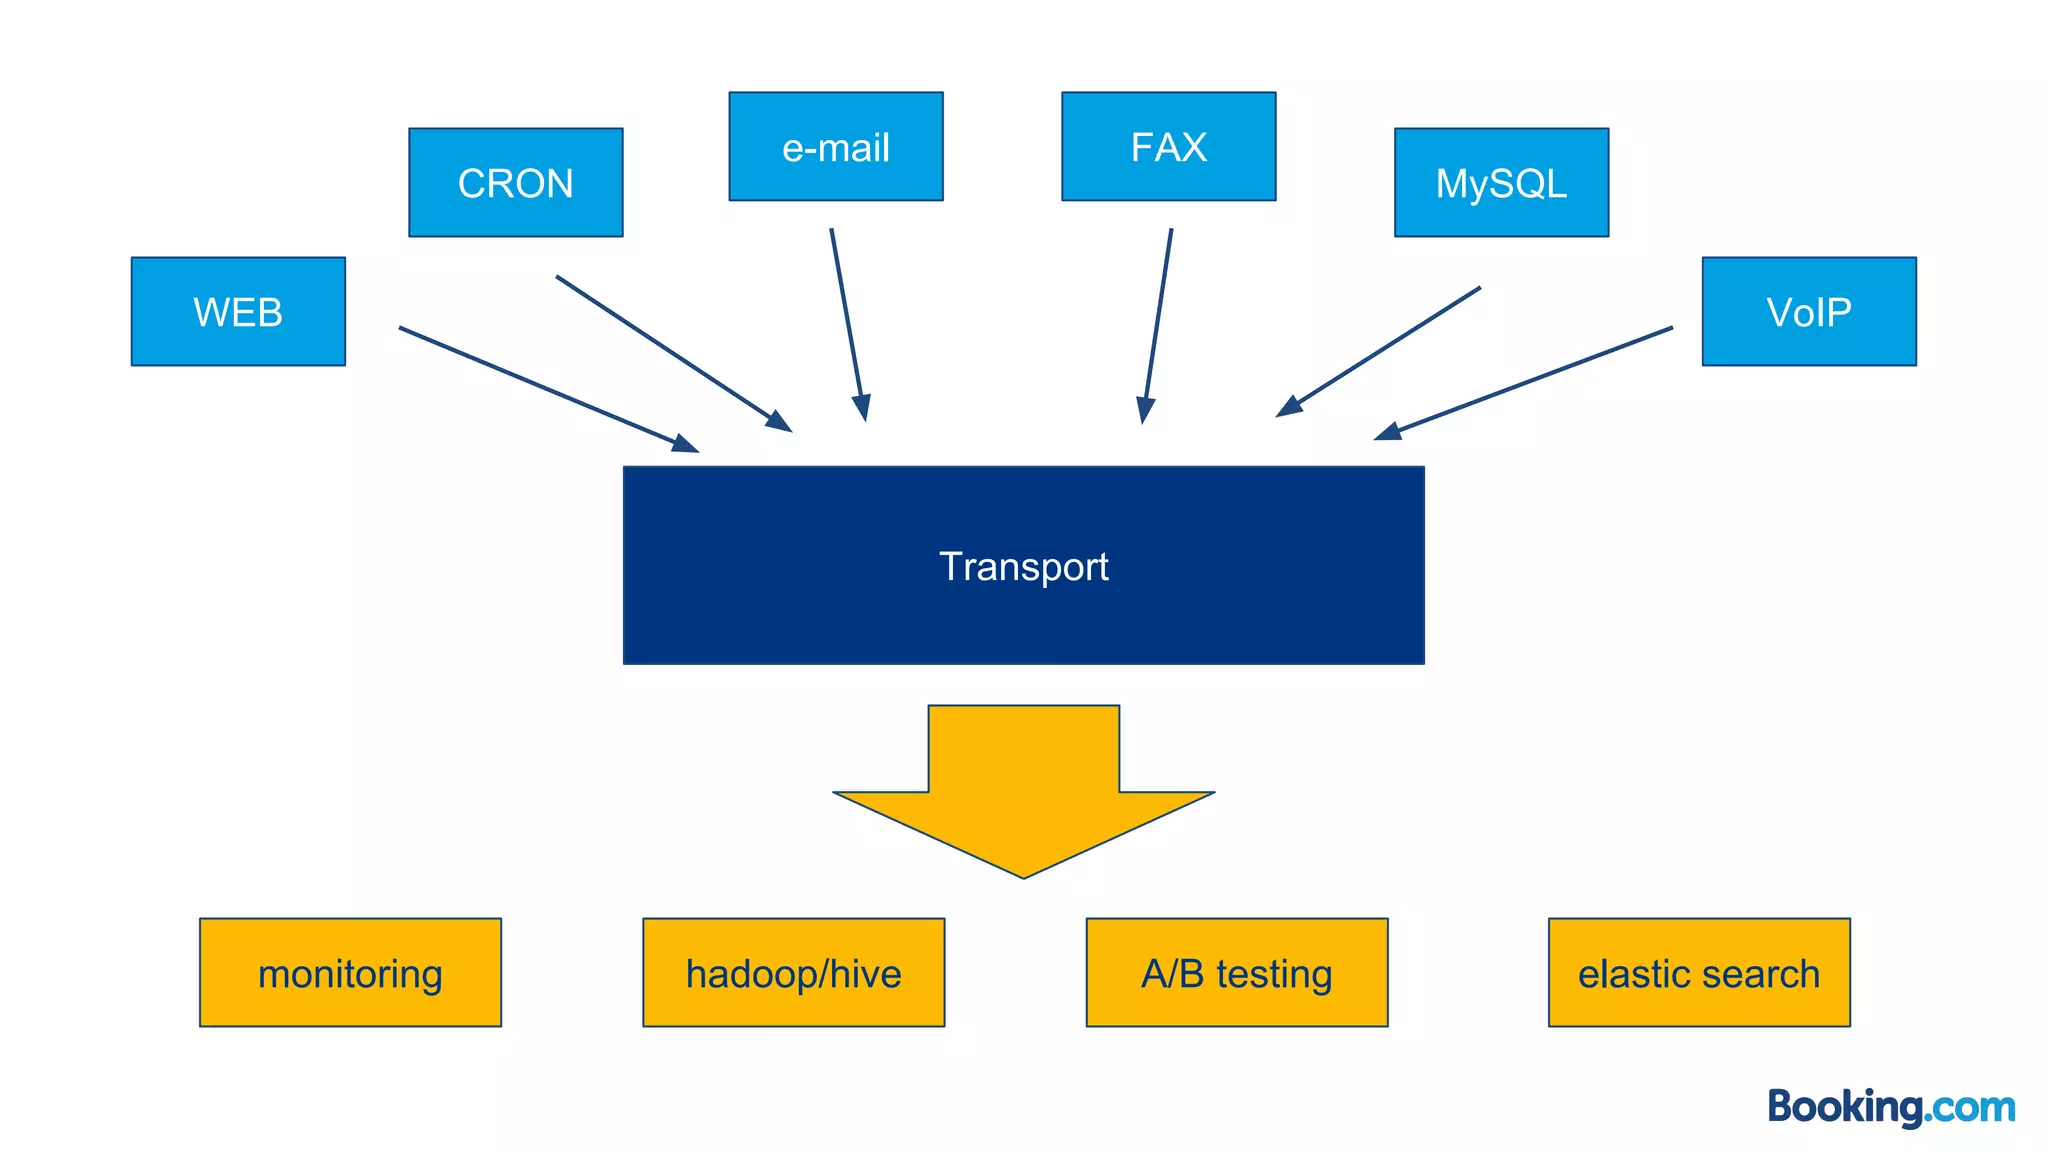
![What is an event?
• message with technical
and business data
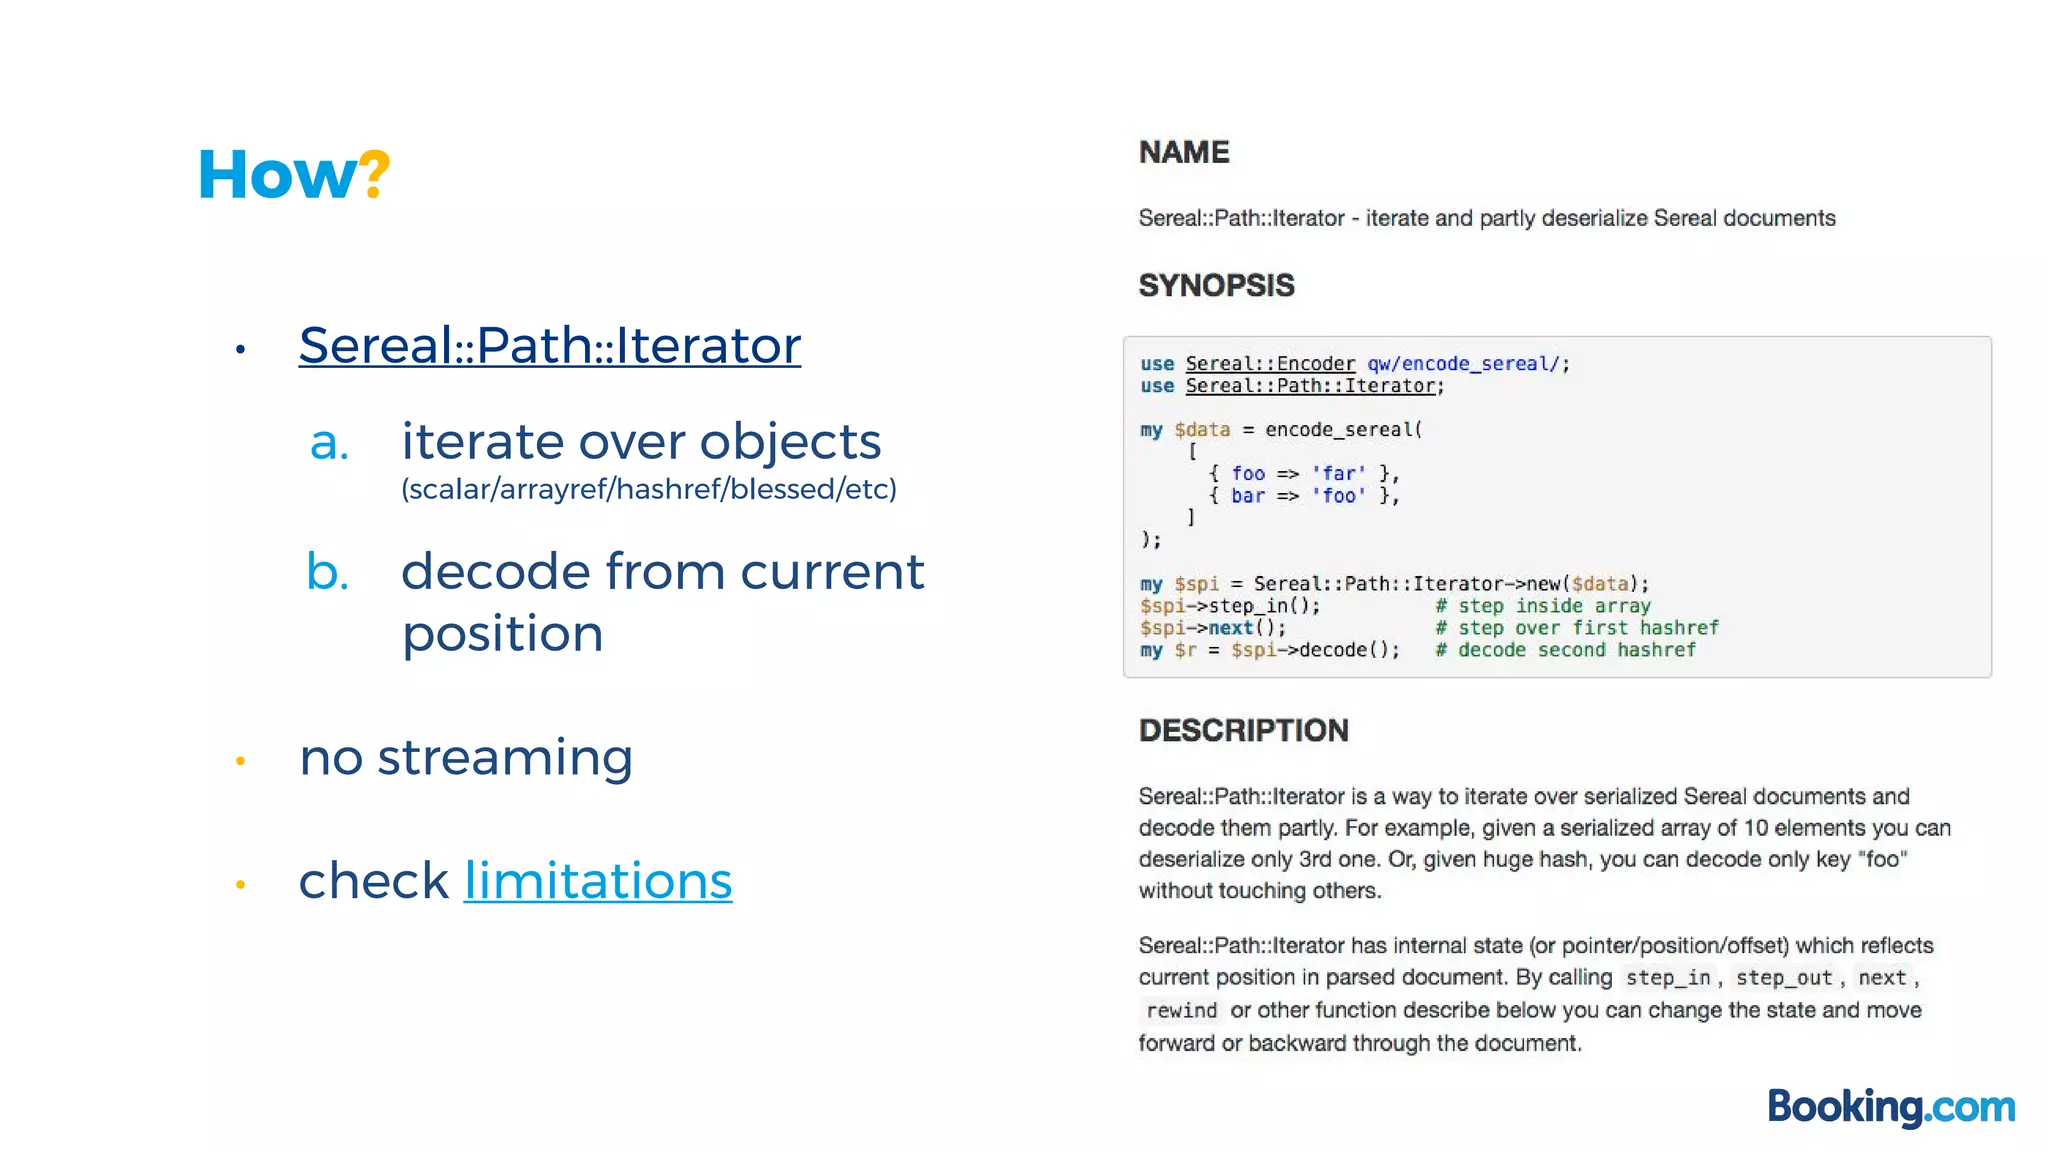
• Sereal encoded
• srl([ $e, $e, $e, … ])](https://image.slidesharecdn.com/solvingsomeofthescalabilityproblemsatbooking-170811155447/75/Solving-some-of-the-scalability-problems-at-booking-com-4-2048.jpg)


![[231] the simplicity of cluster apps with circuit](https://cdn.slidesharecdn.com/ss_thumbnails/213thesimplicityofclusterappswithcircuit-150915022150-lva1-app6892-thumbnail.jpg?width=640&height=640&fit=bounds)