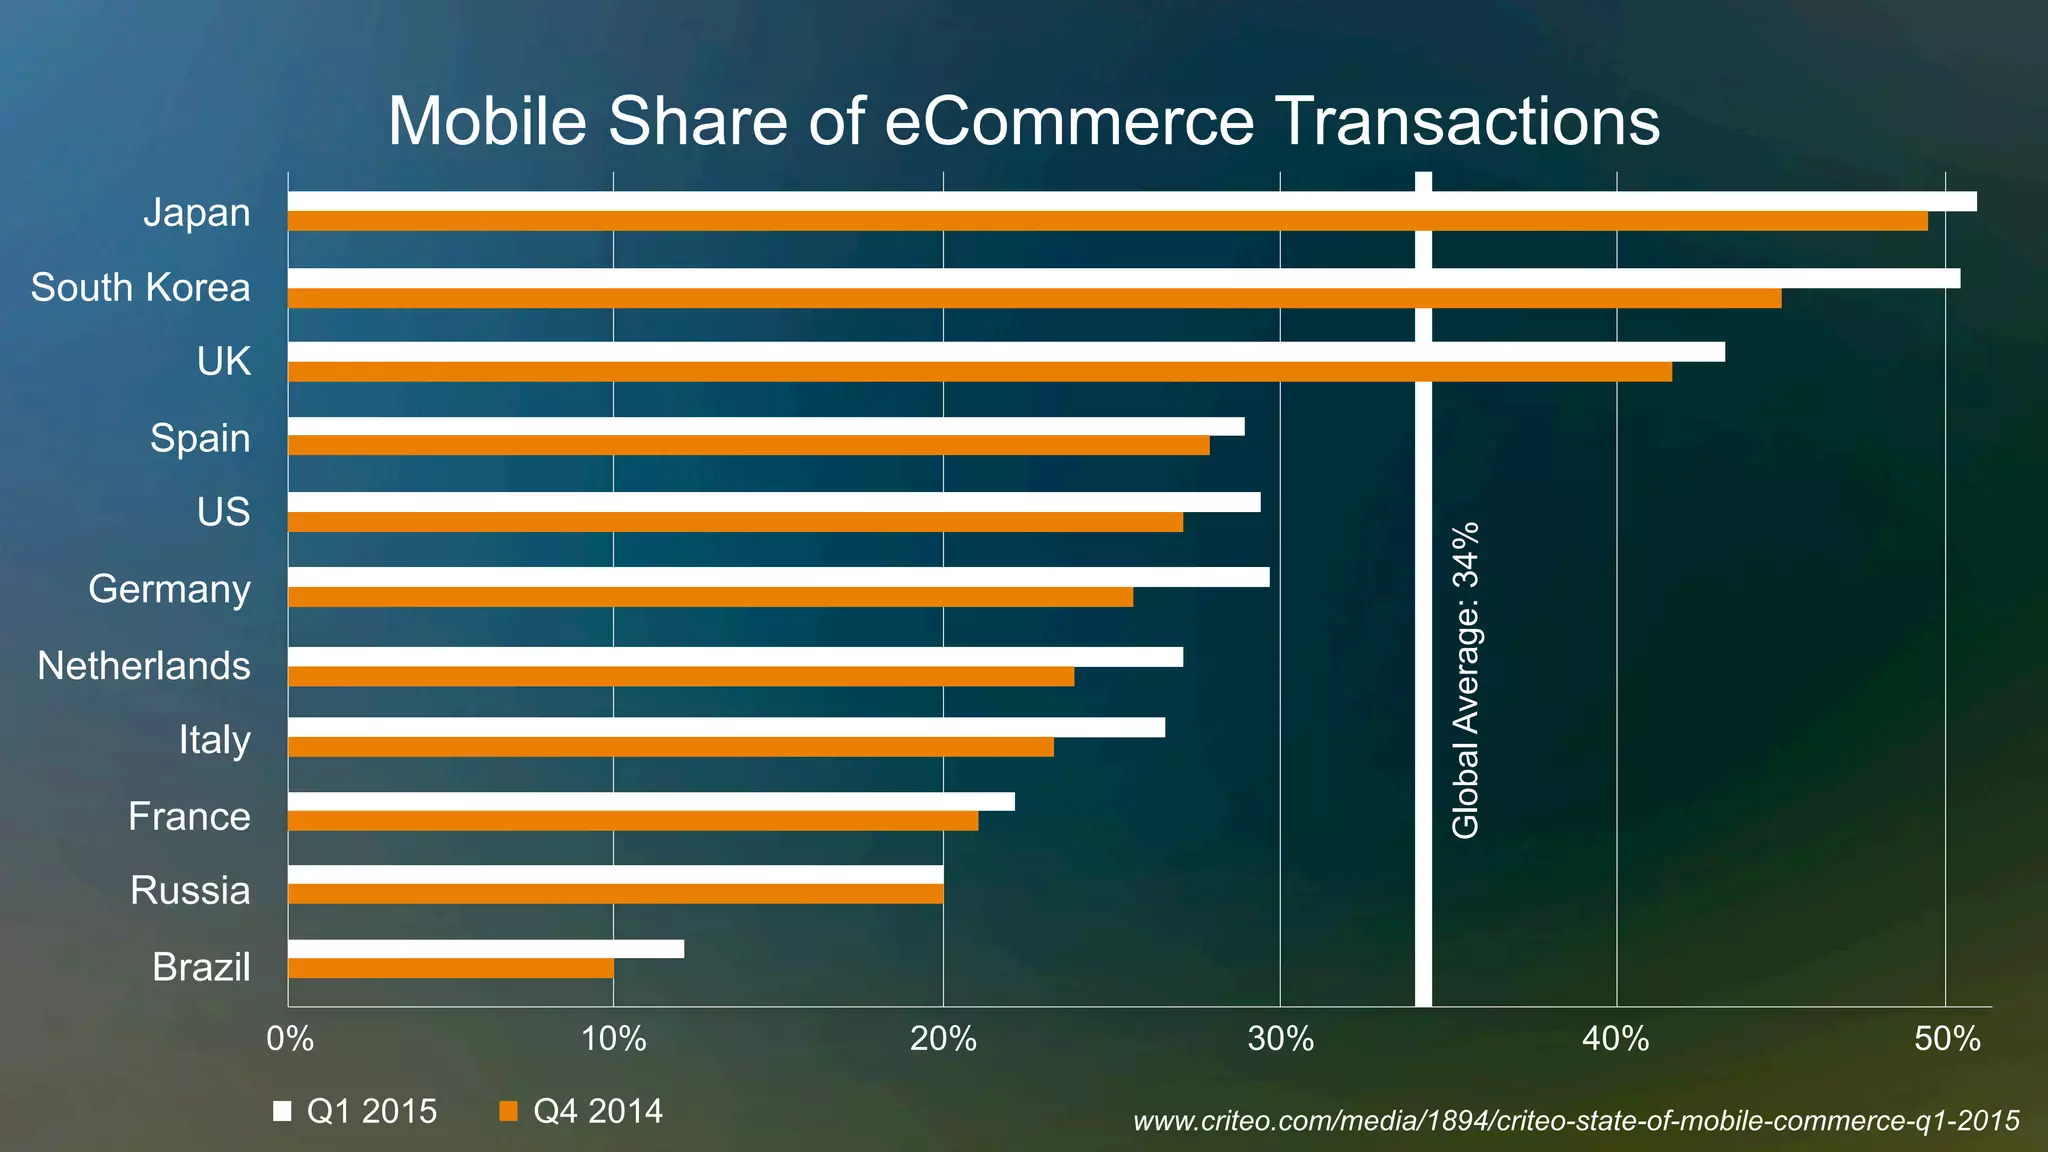
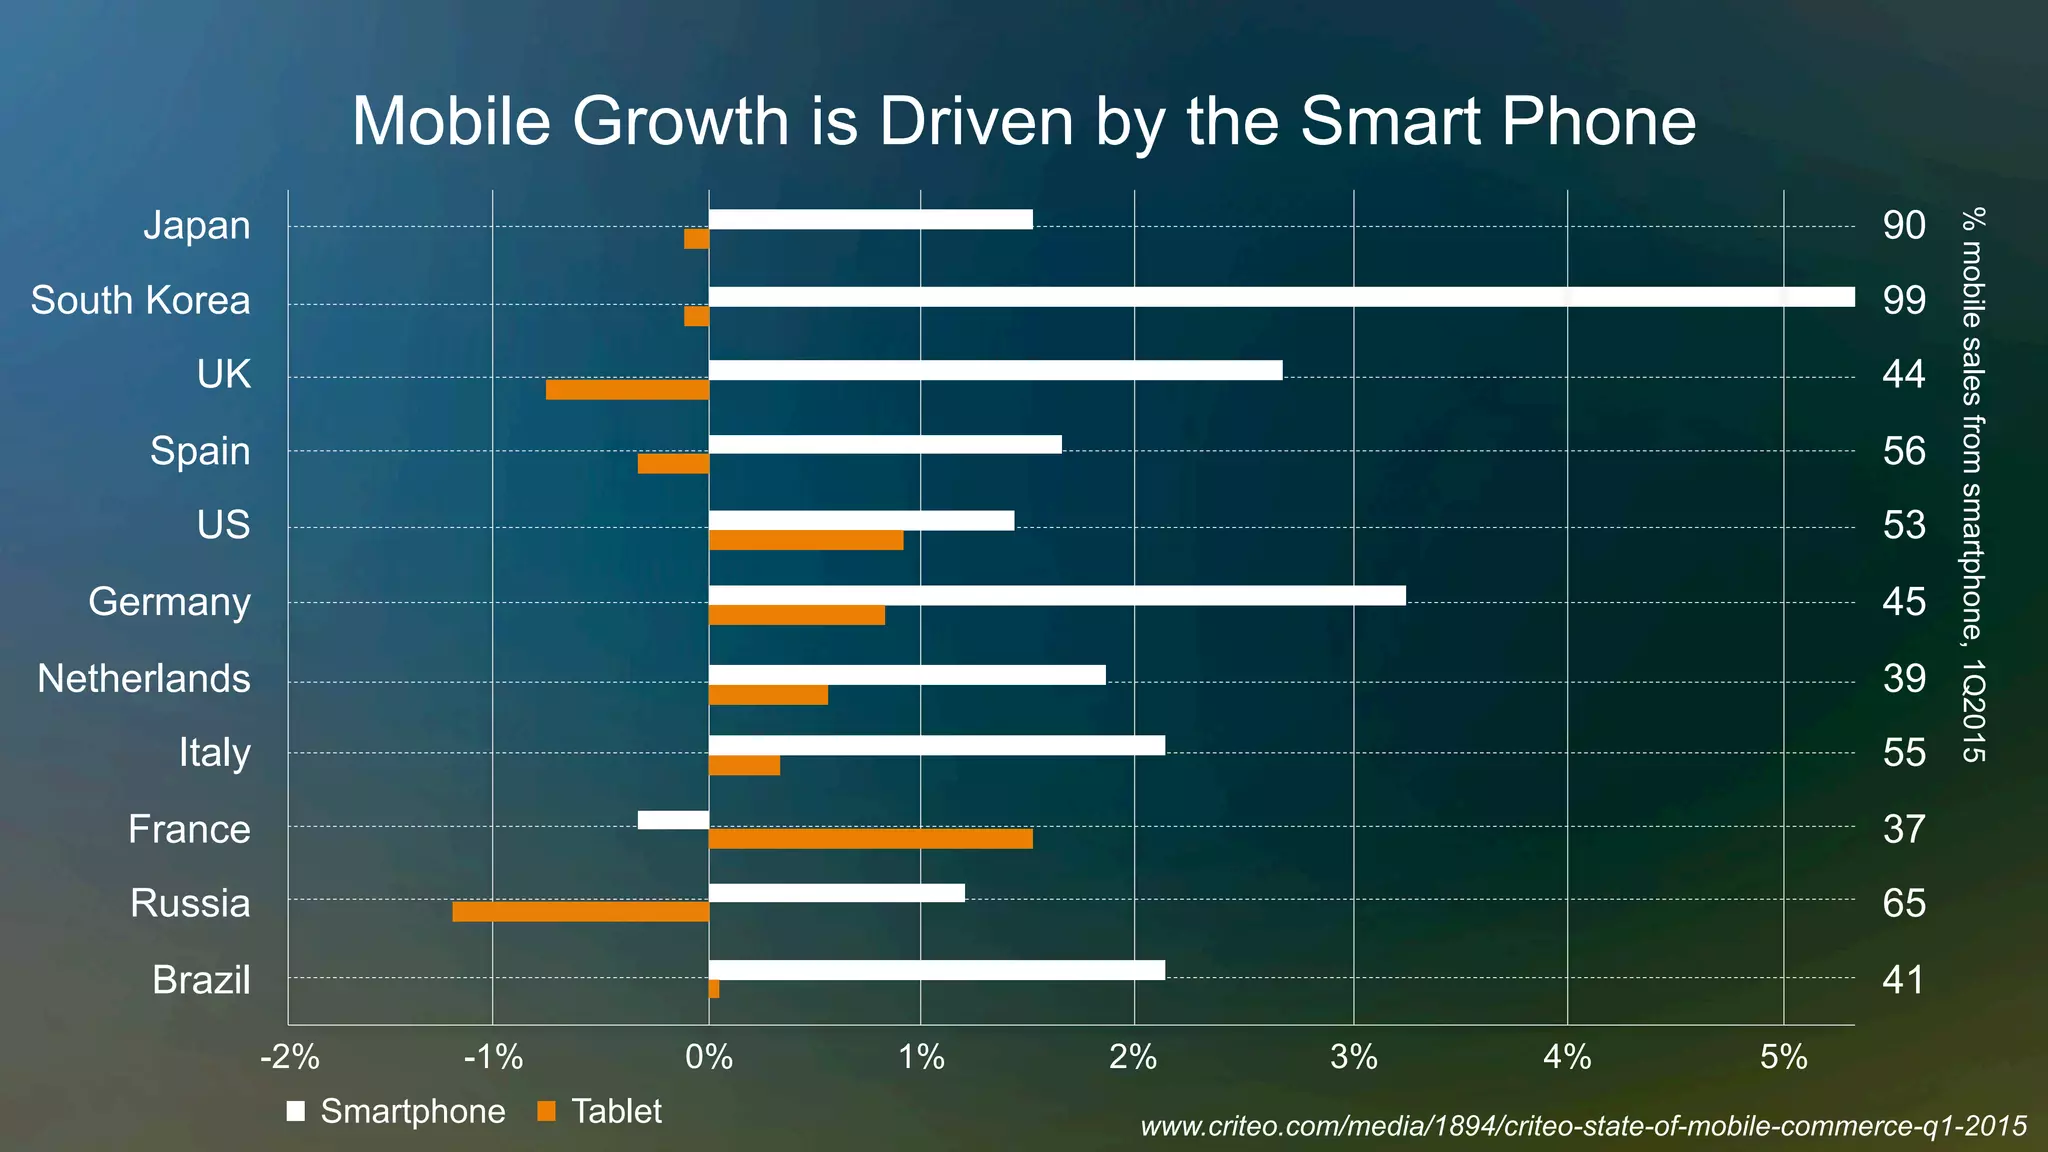
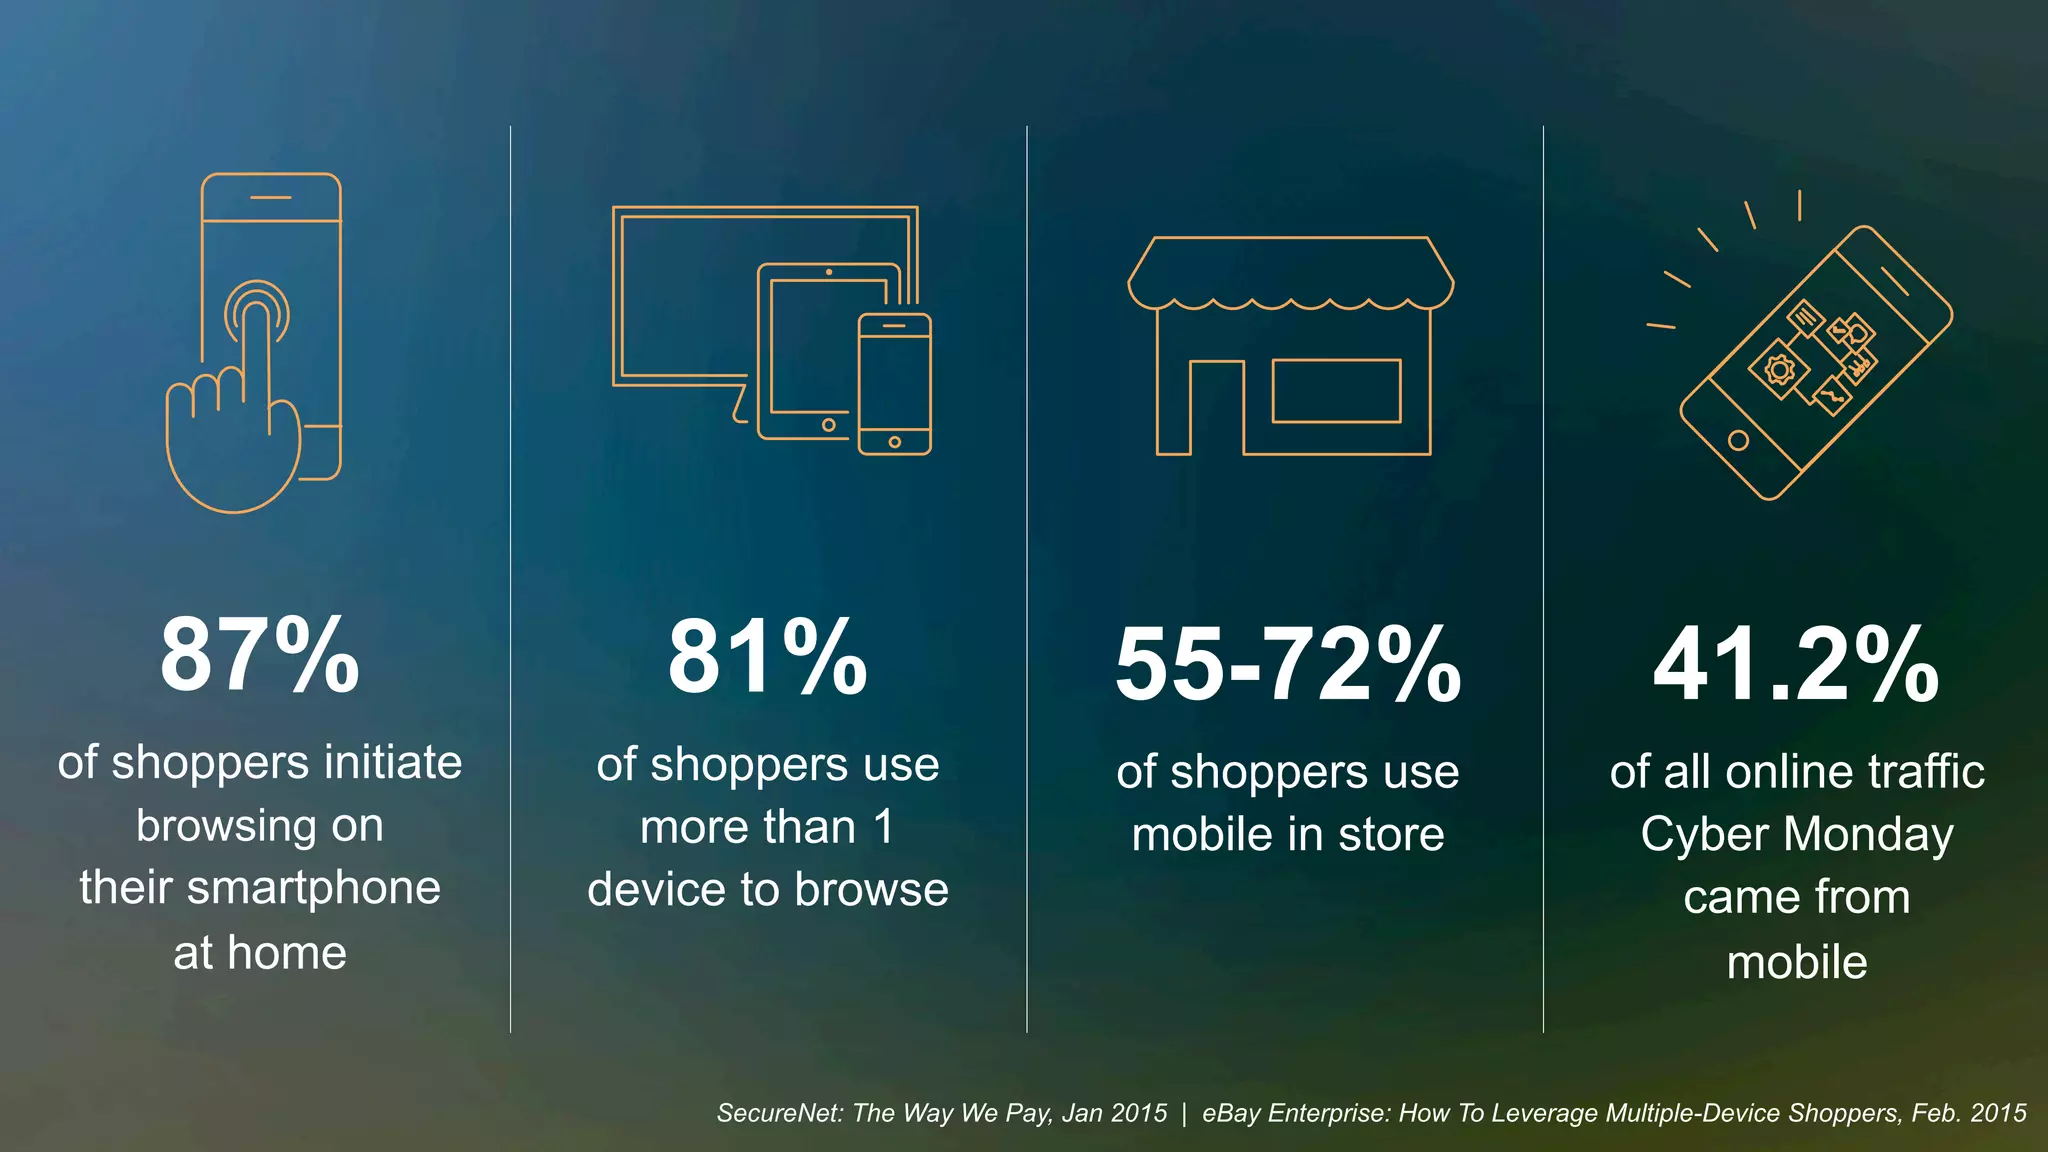
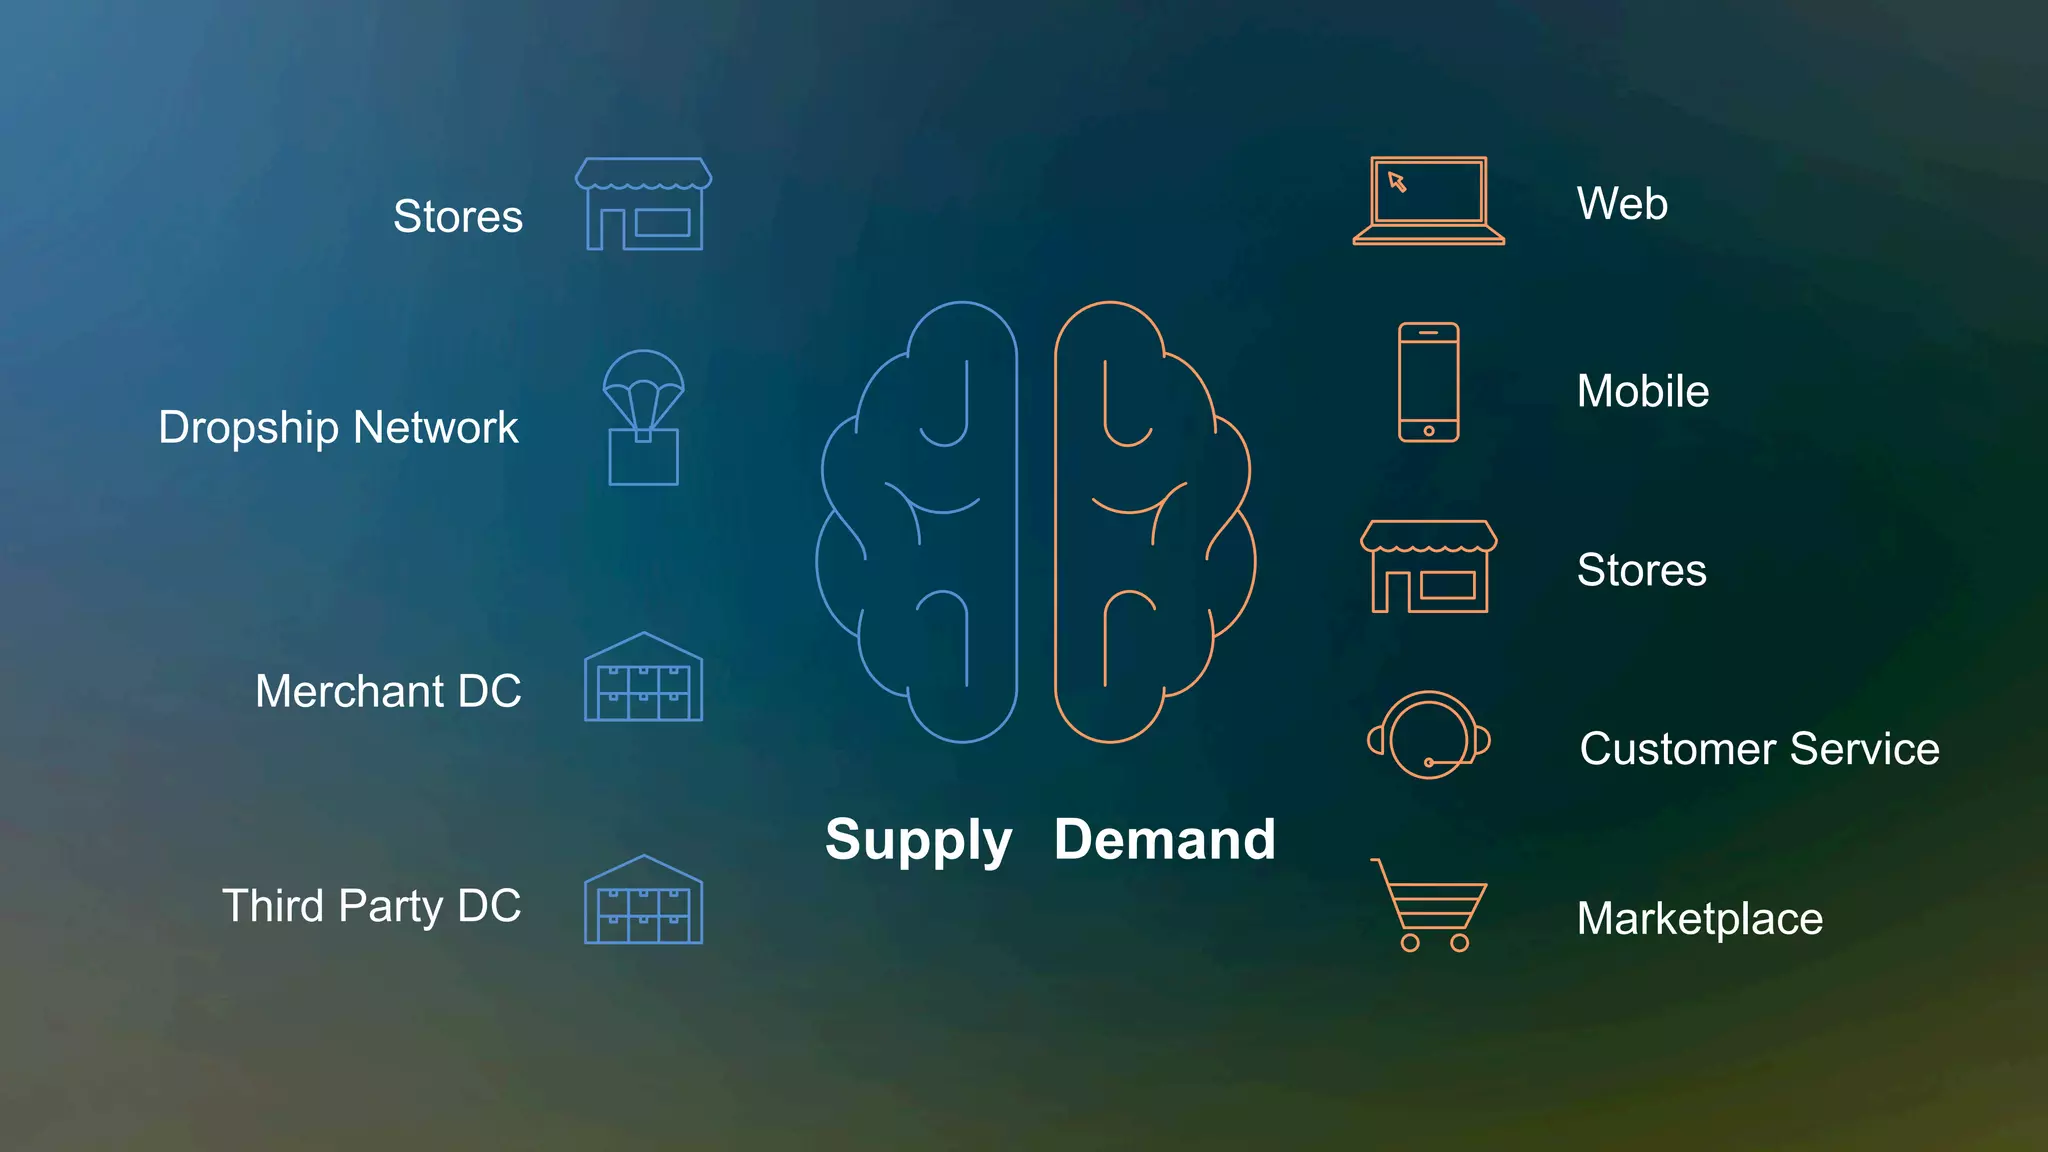
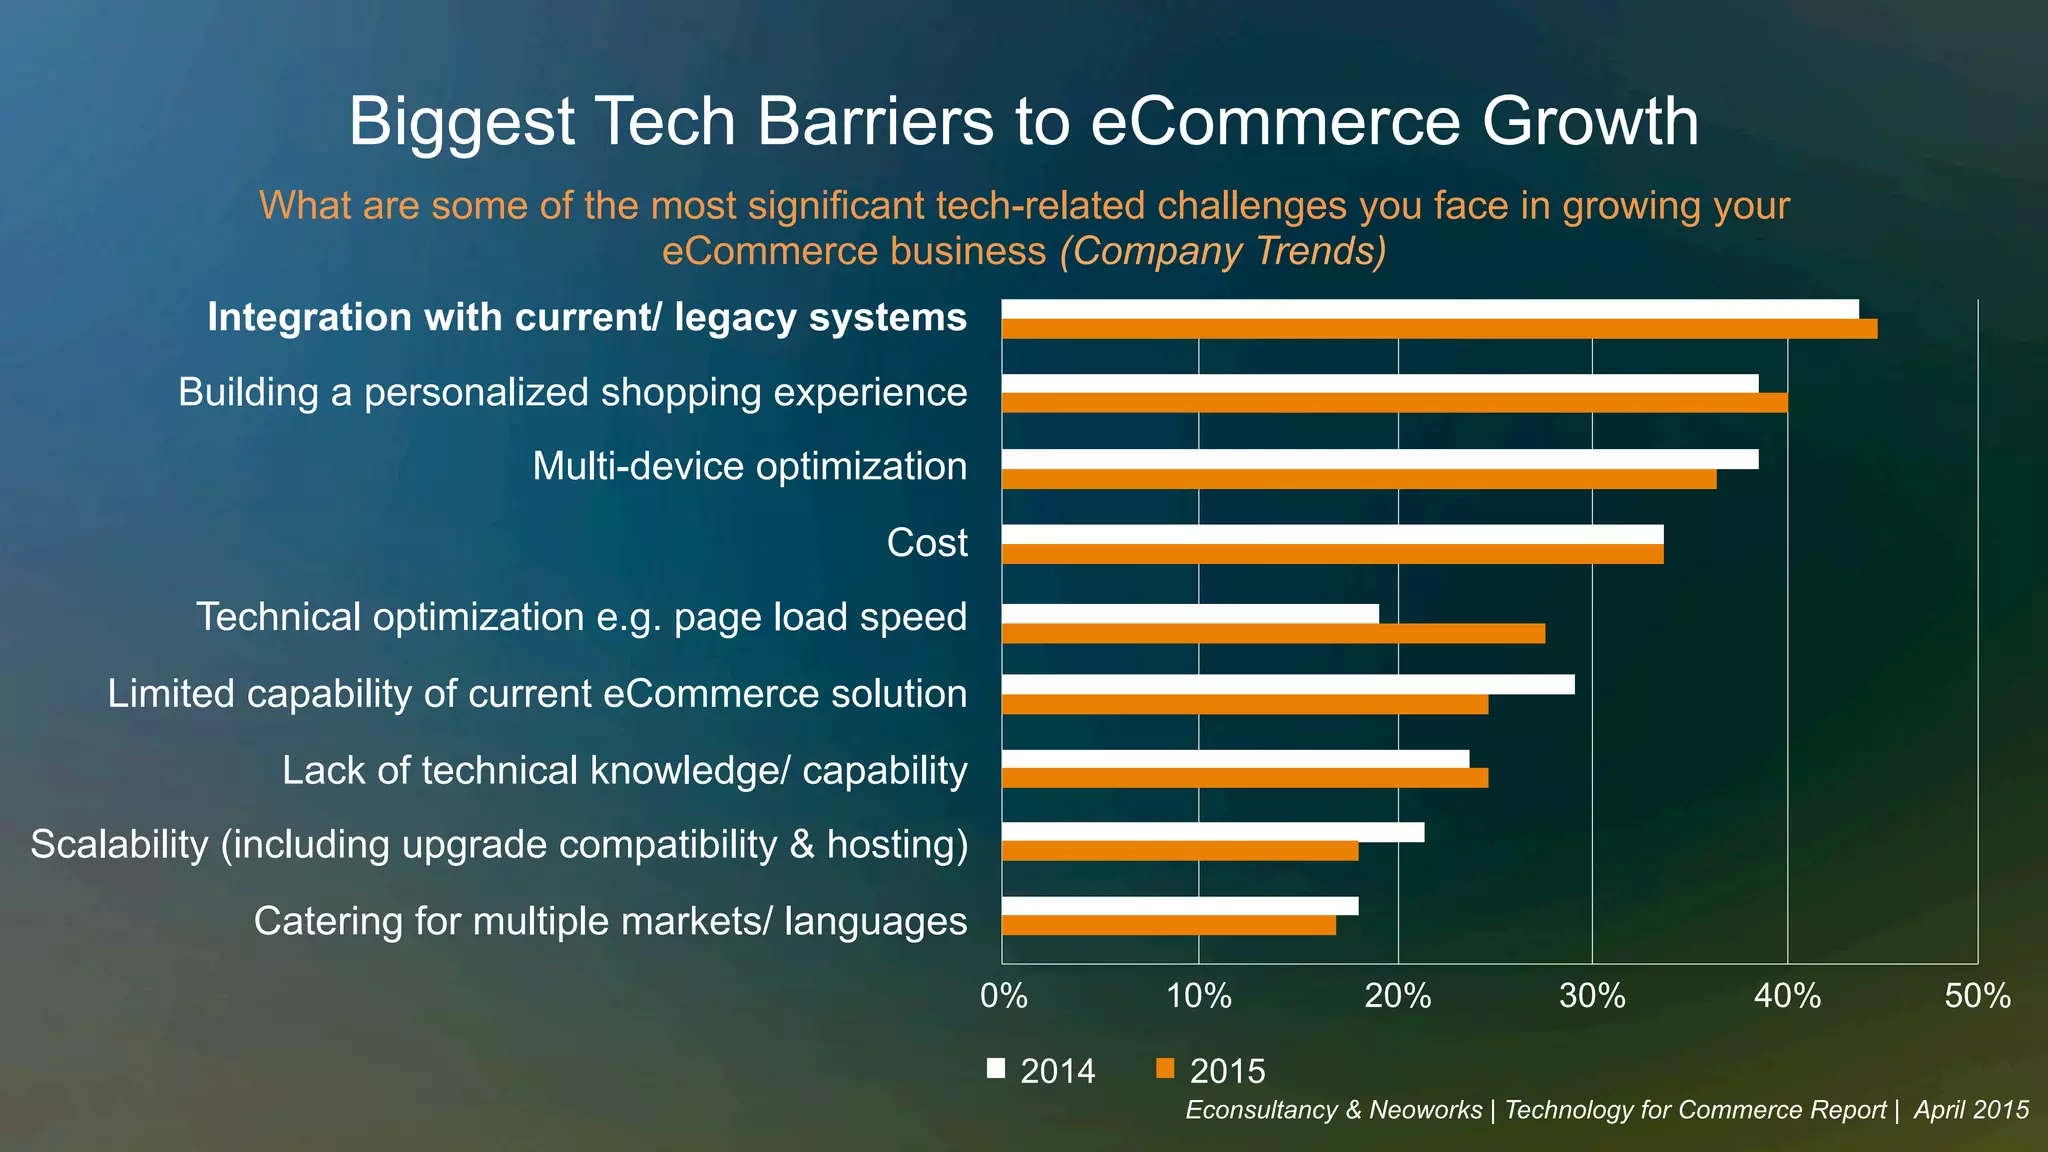
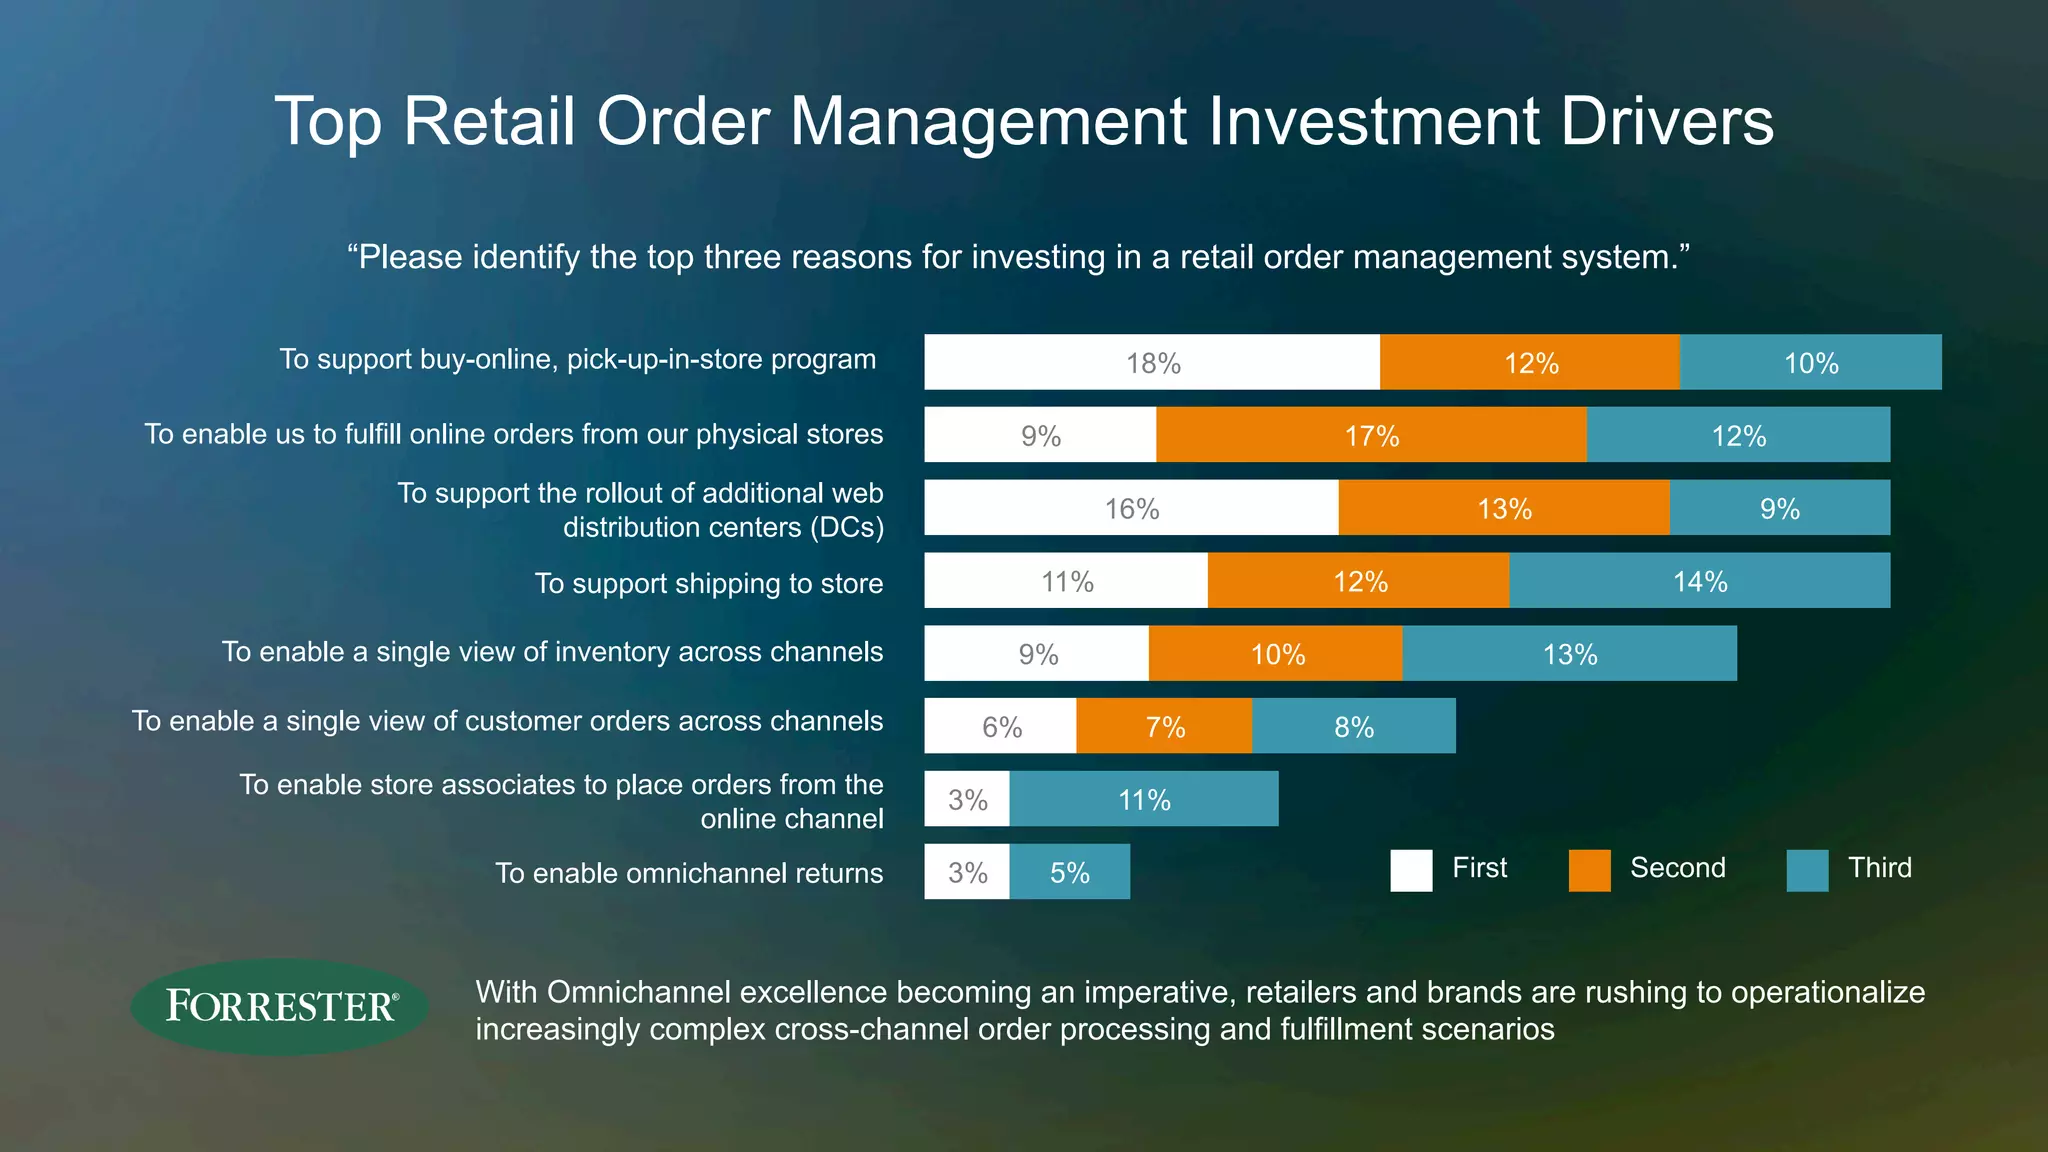
Solving Omni-Channel
Transformation with
Customer Centricity
eCommerce Brazil 2015
Lisa Butler
Vice President, Enterprise Solutions Enablement
eBay Enterprise + Magento
Global Trends
Total Retail Sales
Total retail sales worldwide, 2013-2018, in trillions and % change
Note: excludes travel and event tickets | Source: eMarketer, Dec 2014, 22 countries
2013
Total retail sales
2014 2015 2016 2017 2018
$21.189
$22.492
$23.927
$25.366
$26.827
$28.300
6.4%
6.1%
6.4%
6.0%
5.8%
5.5%
% Change
eCommerce Retail Sales
Retail eCommerce sales worldwide, 2013-2018, in trillions, % change and % of total retail sales
Note: includes products or services ordered using the internet via any device, regardless of the
method of payment or fulfillment; excludes travel and event tickets | Source: eMarketer, Dec 2014
2013
Total retail sales % Change
2014 2015 2016 2017 2018
$21.189
$22.492
$23.927
$25.366
$26.827
$28.300
25.9%
22.2% 20.9%
18.6%
16.4%
13.3%
% of total ecommerce retail sales
5.1% 5.9% 6.7% 7.4% 8.2%
8.8%
Retail Sales Worldwide
Top 10 countries, ranked by retail eCommerce sales worldwide, 2016-2018, in billions and % change
China*
2016
US** UK** Japan Germany
2017 2018
Note: includes products or services ordered using the internet via any device, regardless of the method of payment or
fulfillment; excludes travel and event tickets; *excludes Hong Kong; **forecast from Sep 2014 | Source: eMarketer, Dec 2014
% Change
$714.5827.0%
$871.7922.0%
$1,011.2816.0%
$394.4313.0%
$442.5512.2%
$493.8911.6%
$104.2211.0%
$114.6410.0%
$124.969.0%
$88.0611.0%
$96.8710.0%
$106.079.5%
$82.9312.9%
$91.9710.9%
$99.338.0%
Retail Sales Worldwide
Top 10 countries, ranked by retail eCommerce sales worldwide, 2016-2018, in billions and % change
2016
France
2017 2018
South Korea Canada Russia Brazil
% Change
$46.138.2%
$49.717.8%
$53.267.1%
$40.4310.0%
$44.079.0%
$47.828.5%
$33.0514.9%
$37.6113.8%
$42.6713.5%
$23.4023.4%
$26.8814.9%
$30.9115.0%
Source: eMarketer, Dec 2014
$21.3413.5%
$23.7911.5%
$26.1710.0%
Mobile Share of eCommerce Transactions
Japan
South Korea
UK
Spain
US
Germany
Netherlands
Italy
France
Russia
Brazil
0% 10% 20% 30% 40% 50%
Q1 2015 Q4 2014
GlobalAverage:34%
www.criteo.com/media/1894/criteo-state-of-mobile-commerce-q1-2015
Mobile Growth is Driven by the Smart Phone
Japan
South Korea
UK
Spain
US
Germany
Netherlands
Italy
France
Russia
Brazil
-2% -1% 0% 1% 2% 3% 4% 5%
www.criteo.com/media/1894/criteo-state-of-mobile-commerce-q1-2015
%mobilesalesfromsmartphone,1Q2015
Smartphone Tablet
90
99
44
56
53
45
39
55
37
65
41
Consumer Expectations
87%
of shoppers initiate
browsing on
their smartphone
at home
81%
of shoppers use
more than 1
device to browse
41.2%
of all online traffic
Cyber Monday
came from
mobile
55-72%
of shoppers use
mobile in store
SecureNet: The Way We Pay, Jan 2015 | eBay Enterprise: How To Leverage Multiple-Device Shoppers, Feb. 2015
With Over
720
Commerce
variations
Merchant Opportunities
Supply Demand
Web
Mobile
Stores
Customer Service
Marketplace
Stores
Dropship Network
Merchant DC
Third Party DC
Omni-channel
shoppers are 3-4x
more valuable
than single channel
shoppers–both in terms
of revenue an loyalty
eBay Enterprise: How To Leverage Multiple-Device Shoppers, Feb. 2015
Biggest Tech Barriers to eCommerce Growth
What are some of the most significant tech-related challenges you face in growing your
eCommerce business (Company Trends)
Integration with current/ legacy systems
Building a personalized shopping experience
Multi-device optimization
Cost
Technical optimization e.g. page load speed
Limited capability of current eCommerce solution
Lack of technical knowledge/ capability
Scalability (including upgrade compatibility & hosting)
Catering for multiple markets/ languages
0% 20% 40% 50%
2014 2015
10% 30%
Econsultancy & Neoworks | Technology for Commerce Report | April 2015
Top Retail Order Management Investment Drivers
“Please identify the top three reasons for investing in a retail order management system.”
First Second Third
To support buy-online, pick-up-in-store program
To enable us to fulfill online orders from our physical stores
To support the rollout of additional web
distribution centers (DCs)
To support shipping to store
To enable a single view of inventory across channels
To enable a single view of customer orders across channels
To enable store associates to place orders from the
online channel
To enable omnichannel returns
18% 12% 10%
9% 17% 12%
16% 13% 9%
11% 12% 14%
9% 10% 13%
6% 7% 8%
3% 11%
3% 5%
With Omnichannel excellence becoming an imperative, retailers and brands are rushing to operationalize
increasingly complex cross-channel order processing and fulfillment scenarios
•  Complete overhaul of
operational infrastructure
•  70,000 units available
online to 1 million units
•  Triple digit growth
Relevant Content for Omni-Channel
Fractional Marketing: Providing Relevant, Constant Content, June 27, 2014 - By Michael Penney - Email Marketing Strategy
Browse and/or click,
but didn’t buy
Confirmation, and post
purchase communication
Dynamic
Recommendation
Abandoned cartSocial Media Intro
Have you ever intentionally
browsed products in a store
but decided to buy on line?
Have you ever intentionally
browsed products online but
decided to buy in store?
0% 40% 80% 100%
PwC’s Annual Global Total Retail Consumer Survey February 2015, 19,068 Respondents
20% 60%
Yes No
Convenience
Showrooming vs web-rooming
•  2008 Click & Collect
•  Online orders grow 19%
•  56% of online orders
are C&C
•  Store growth from 42-65
“The role of the shop is
absolutely critical in
providing the online sales”
- A. Street, Managing Director
Convenience
Click and collect
http://www.deloitte.co.uk/tmtpredictions/click-and-collect-booms-in-europe/
Excellent Customer Service
Over the next five years, what is the primary way your organization
will seek to differentiate itself from competitors?
Customer service/ customer experience – making it easy, fun,
valuable and/or pleasurable to shop from us
Product service/ quality
Product service/ choice
Mobile – becoming a ‘mobile first’ company that absolutely
caters to the mobile shopper/ buyer
Convenience – fast delivery, in-store pickup, multiple payment
mechanism, buy online return-to-store etc.
Price
0% 20% 40% 50%
Econsultancy/ Adobe Quarterly Digital Intelligence Briefing | 2,146 Respondents
10% 30%
Aspiration vs. Reality
Forrester Research, Relevant Customer Experience, January 2015
80%
11%
Aspire to be customer experience leaders Deliver Excellent Experience
Service Expectation
Zendesk, Omni channel Customer Service Gap, 2013
Shifting from Acquisition to Retention
54%
Of businesses prioritize
meeting revenue targets
63%
Of businesses prioritize
acquiring new customers
•  A customer’s typical 2,500
choices are increased to
15,000 choices
•  Transformed 450 stores into
a network of many distribution
centers
•  Improved store
conversion
•  Increased loyalty
•  Increased endless
aisle transactions
Customer Service
Store Associate Application
Social
•  Product
•  Sales
•  Marketing
•  Public Relations
•  Community
•  Crisis
•  Support
wikipedia.org/wiki/Social_media
Social
purchases through social
recommendations
26%
induced
2/3
impact
on point of purchase
10%
more
purchases based on
recommendations from 2013
McKinsey, Getting a sharper picture of social media’s influence, Jacques Bughin, July 2015, 20,000 EU Respondents
Brazil Social Media
Facebook
Google+
LinkedIn
Twitter
Tumblr
0% 20% 40% 50%10% 30%
Number of visitors in millions
60%
Percolate, Global Marketers Guide to Brazil, 2015
Social and Internet Growth
2011
Social media users (millions) % of internet users
56.1
66.2
78.3
88.3
97.8
104.2
11071%
74%
79%
82%
86%
87%
89.2%
2012 2013 2014 2015 2016 2017
Percolate, Global Marketers Guide to Brazil, 2015
Social Linked to Television
Percolate, Global marketer’s Guide to Brazil., 2015
12pm
Comments about TV more than double during the hours when novelas and soccer matches are aired
1pm 2pm 3pm 4pm 5pm 6pm 7pm 8pm 9pm 10pm 11pm
Personalized Experiences
Staying Top of Mind with Customers
A rich opportunity to create experiences that are informed not only by
what they do but also by what they directly tell you that they want
•  Deals and promotions
•  Communications and website features
that personalized the experience for
the user based on past behavior
•  More effective were the tools
that allowed the customer to
set the controls
Shrink Distance
1
Shrink Time
2
Own The Journey
3
Achieving & Scaling Excellence
•  Integration with physical stores
to pick up and return online orders
in store
•  Integration to loyalty
•  200k orders on BF through CM
•  24% increase in conversion
•  130% increase in mobile traffic
The Number One Focus
Consumers’ Shopping
Journey Is …
… Self Directed
… Self Serviced
… Self Actualizing
Customer experience is
the currency of commerce
The consumer controls the
exchange rate
The “Omni-Channel” Challenge
$
Customer Experience Profitability Metrics
I leave you with these questions
•  What does your customer need next?
•  How does it effect your brands relationship when delivered?
•  Does your company have the right business practices
in place to drive innovation?
•  Are you surrounded by the best support systems both from a technology
and creativity perspective?
Thank You

Solving Omni-Channel Transformation with Customer Centricity

  • 1.
    Solving Omni-Channel Transformation with CustomerCentricity eCommerce Brazil 2015
  • 2.
    Lisa Butler Vice President,Enterprise Solutions Enablement eBay Enterprise + Magento
  • 3.
  • 4.
    Total Retail Sales Totalretail sales worldwide, 2013-2018, in trillions and % change Note: excludes travel and event tickets | Source: eMarketer, Dec 2014, 22 countries 2013 Total retail sales 2014 2015 2016 2017 2018 $21.189 $22.492 $23.927 $25.366 $26.827 $28.300 6.4% 6.1% 6.4% 6.0% 5.8% 5.5% % Change
  • 5.
    eCommerce Retail Sales RetaileCommerce sales worldwide, 2013-2018, in trillions, % change and % of total retail sales Note: includes products or services ordered using the internet via any device, regardless of the method of payment or fulfillment; excludes travel and event tickets | Source: eMarketer, Dec 2014 2013 Total retail sales % Change 2014 2015 2016 2017 2018 $21.189 $22.492 $23.927 $25.366 $26.827 $28.300 25.9% 22.2% 20.9% 18.6% 16.4% 13.3% % of total ecommerce retail sales 5.1% 5.9% 6.7% 7.4% 8.2% 8.8%
  • 6.
    Retail Sales Worldwide Top10 countries, ranked by retail eCommerce sales worldwide, 2016-2018, in billions and % change China* 2016 US** UK** Japan Germany 2017 2018 Note: includes products or services ordered using the internet via any device, regardless of the method of payment or fulfillment; excludes travel and event tickets; *excludes Hong Kong; **forecast from Sep 2014 | Source: eMarketer, Dec 2014 % Change $714.5827.0% $871.7922.0% $1,011.2816.0% $394.4313.0% $442.5512.2% $493.8911.6% $104.2211.0% $114.6410.0% $124.969.0% $88.0611.0% $96.8710.0% $106.079.5% $82.9312.9% $91.9710.9% $99.338.0%
  • 7.
    Retail Sales Worldwide Top10 countries, ranked by retail eCommerce sales worldwide, 2016-2018, in billions and % change 2016 France 2017 2018 South Korea Canada Russia Brazil % Change $46.138.2% $49.717.8% $53.267.1% $40.4310.0% $44.079.0% $47.828.5% $33.0514.9% $37.6113.8% $42.6713.5% $23.4023.4% $26.8814.9% $30.9115.0% Source: eMarketer, Dec 2014 $21.3413.5% $23.7911.5% $26.1710.0%
  • 8.
    Mobile Share ofeCommerce Transactions Japan South Korea UK Spain US Germany Netherlands Italy France Russia Brazil 0% 10% 20% 30% 40% 50% Q1 2015 Q4 2014 GlobalAverage:34% www.criteo.com/media/1894/criteo-state-of-mobile-commerce-q1-2015
  • 9.
    Mobile Growth isDriven by the Smart Phone Japan South Korea UK Spain US Germany Netherlands Italy France Russia Brazil -2% -1% 0% 1% 2% 3% 4% 5% www.criteo.com/media/1894/criteo-state-of-mobile-commerce-q1-2015 %mobilesalesfromsmartphone,1Q2015 Smartphone Tablet 90 99 44 56 53 45 39 55 37 65 41
  • 10.
  • 16.
    87% of shoppers initiate browsingon their smartphone at home 81% of shoppers use more than 1 device to browse 41.2% of all online traffic Cyber Monday came from mobile 55-72% of shoppers use mobile in store SecureNet: The Way We Pay, Jan 2015 | eBay Enterprise: How To Leverage Multiple-Device Shoppers, Feb. 2015
  • 17.
  • 18.
  • 19.
  • 20.
    Omni-channel shoppers are 3-4x morevaluable than single channel shoppers–both in terms of revenue an loyalty eBay Enterprise: How To Leverage Multiple-Device Shoppers, Feb. 2015
  • 21.
    Biggest Tech Barriersto eCommerce Growth What are some of the most significant tech-related challenges you face in growing your eCommerce business (Company Trends) Integration with current/ legacy systems Building a personalized shopping experience Multi-device optimization Cost Technical optimization e.g. page load speed Limited capability of current eCommerce solution Lack of technical knowledge/ capability Scalability (including upgrade compatibility & hosting) Catering for multiple markets/ languages 0% 20% 40% 50% 2014 2015 10% 30% Econsultancy & Neoworks | Technology for Commerce Report | April 2015
  • 22.
    Top Retail OrderManagement Investment Drivers “Please identify the top three reasons for investing in a retail order management system.” First Second Third To support buy-online, pick-up-in-store program To enable us to fulfill online orders from our physical stores To support the rollout of additional web distribution centers (DCs) To support shipping to store To enable a single view of inventory across channels To enable a single view of customer orders across channels To enable store associates to place orders from the online channel To enable omnichannel returns 18% 12% 10% 9% 17% 12% 16% 13% 9% 11% 12% 14% 9% 10% 13% 6% 7% 8% 3% 11% 3% 5% With Omnichannel excellence becoming an imperative, retailers and brands are rushing to operationalize increasingly complex cross-channel order processing and fulfillment scenarios
  • 23.
    •  Complete overhaulof operational infrastructure •  70,000 units available online to 1 million units •  Triple digit growth
  • 25.
    Relevant Content forOmni-Channel Fractional Marketing: Providing Relevant, Constant Content, June 27, 2014 - By Michael Penney - Email Marketing Strategy Browse and/or click, but didn’t buy Confirmation, and post purchase communication Dynamic Recommendation Abandoned cartSocial Media Intro
  • 27.
    Have you everintentionally browsed products in a store but decided to buy on line? Have you ever intentionally browsed products online but decided to buy in store? 0% 40% 80% 100% PwC’s Annual Global Total Retail Consumer Survey February 2015, 19,068 Respondents 20% 60% Yes No Convenience Showrooming vs web-rooming
  • 28.
    •  2008 Click& Collect •  Online orders grow 19% •  56% of online orders are C&C •  Store growth from 42-65 “The role of the shop is absolutely critical in providing the online sales” - A. Street, Managing Director Convenience Click and collect http://www.deloitte.co.uk/tmtpredictions/click-and-collect-booms-in-europe/
  • 29.
    Excellent Customer Service Overthe next five years, what is the primary way your organization will seek to differentiate itself from competitors? Customer service/ customer experience – making it easy, fun, valuable and/or pleasurable to shop from us Product service/ quality Product service/ choice Mobile – becoming a ‘mobile first’ company that absolutely caters to the mobile shopper/ buyer Convenience – fast delivery, in-store pickup, multiple payment mechanism, buy online return-to-store etc. Price 0% 20% 40% 50% Econsultancy/ Adobe Quarterly Digital Intelligence Briefing | 2,146 Respondents 10% 30%
  • 30.
    Aspiration vs. Reality ForresterResearch, Relevant Customer Experience, January 2015 80% 11% Aspire to be customer experience leaders Deliver Excellent Experience
  • 31.
    Service Expectation Zendesk, Omnichannel Customer Service Gap, 2013
  • 32.
    Shifting from Acquisitionto Retention 54% Of businesses prioritize meeting revenue targets 63% Of businesses prioritize acquiring new customers
  • 33.
    •  A customer’stypical 2,500 choices are increased to 15,000 choices •  Transformed 450 stores into a network of many distribution centers •  Improved store conversion •  Increased loyalty •  Increased endless aisle transactions Customer Service Store Associate Application
  • 34.
    Social •  Product •  Sales • Marketing •  Public Relations •  Community •  Crisis •  Support wikipedia.org/wiki/Social_media
  • 35.
    Social purchases through social recommendations 26% induced 2/3 impact onpoint of purchase 10% more purchases based on recommendations from 2013 McKinsey, Getting a sharper picture of social media’s influence, Jacques Bughin, July 2015, 20,000 EU Respondents
  • 36.
    Brazil Social Media Facebook Google+ LinkedIn Twitter Tumblr 0%20% 40% 50%10% 30% Number of visitors in millions 60% Percolate, Global Marketers Guide to Brazil, 2015
  • 37.
    Social and InternetGrowth 2011 Social media users (millions) % of internet users 56.1 66.2 78.3 88.3 97.8 104.2 11071% 74% 79% 82% 86% 87% 89.2% 2012 2013 2014 2015 2016 2017 Percolate, Global Marketers Guide to Brazil, 2015
  • 38.
    Social Linked toTelevision Percolate, Global marketer’s Guide to Brazil., 2015 12pm Comments about TV more than double during the hours when novelas and soccer matches are aired 1pm 2pm 3pm 4pm 5pm 6pm 7pm 8pm 9pm 10pm 11pm
  • 39.
    Personalized Experiences Staying Topof Mind with Customers A rich opportunity to create experiences that are informed not only by what they do but also by what they directly tell you that they want •  Deals and promotions •  Communications and website features that personalized the experience for the user based on past behavior •  More effective were the tools that allowed the customer to set the controls
  • 40.
    Shrink Distance 1 Shrink Time 2 OwnThe Journey 3 Achieving & Scaling Excellence
  • 41.
    •  Integration withphysical stores to pick up and return online orders in store •  Integration to loyalty •  200k orders on BF through CM •  24% increase in conversion •  130% increase in mobile traffic
  • 43.
  • 44.
    Consumers’ Shopping Journey Is… … Self Directed … Self Serviced … Self Actualizing
  • 45.
    Customer experience is thecurrency of commerce The consumer controls the exchange rate
  • 46.
    The “Omni-Channel” Challenge $ CustomerExperience Profitability Metrics
  • 47.
    I leave youwith these questions •  What does your customer need next? •  How does it effect your brands relationship when delivered? •  Does your company have the right business practices in place to drive innovation? •  Are you surrounded by the best support systems both from a technology and creativity perspective?
  • 48.