Requirements Modeling
Whatis it? – uses a combination of text and diagrammatic forms to
depict requirements in a way that is relatively easy to understand and
to review for correctness, completeness and consistency.
Why is it important? – to validate software requirements from
different points of view. [scenario based, data, class oriented, flow
oriented, behavioral model]
3.
Requirements Analysis
Requirementsanalysis
specifies software’s operational characteristics
indicates software's interface with other system elements
establishes constraints that software must meet
Requirements analysis allows the software engineer (called an analyst
or modeler in this role) to:
elaborate on basic requirements established during earlier requirement
engineering tasks
build models that depict user scenarios, functional activities, problem classes
and their relationships, system and class behavior, and the flow of data as it
is transformed.
4.
Requirements Modeling
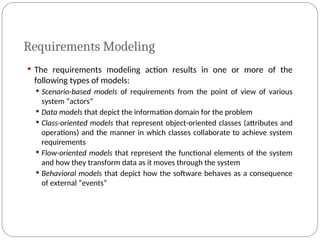
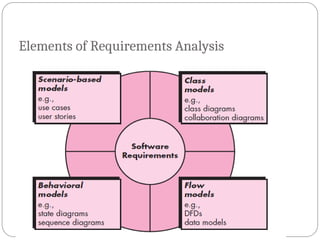
Therequirements modeling action results in one or more of the
following types of models:
Scenario-based models of requirements from the point of view of various
system “actors”
Data models that depict the information domain for the problem
Class-oriented models that represent object-oriented classes (attributes and
operations) and the manner in which classes collaborate to achieve system
requirements
Flow-oriented models that represent the functional elements of the system
and how they transform data as it moves through the system
Behavioral models that depict how the software behaves as a consequence
of external “events”
5.
Requirements Modeling
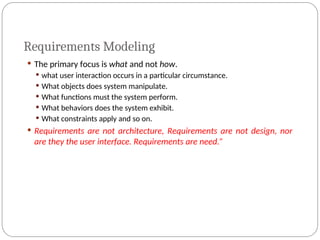
Theprimary focus is what and not how.
what user interaction occurs in a particular circumstance.
What objects does system manipulate.
What functions must the system perform.
What behaviors does the system exhibit.
What constraints apply and so on.
Requirements are not architecture, Requirements are not design, nor
are they the user interface. Requirements are need.”
6.
Requirements Modeling
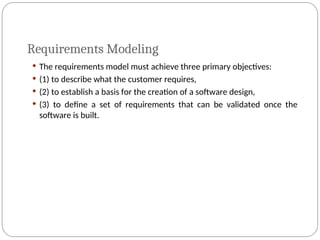
Therequirements model must achieve three primary objectives:
(1) to describe what the customer requires,
(2) to establish a basis for the creation of a software design,
(3) to define a set of requirements that can be validated once the
software is built.
Scenario-Based Modeling
“[Use-cases] aresimply an aid to defining what exists outside the
system (actors) and what should be performed by the system (use-
cases).”
(1) What should we write about?
(2) How much should we write about it?
(3) How detailed should we make our description?
(4) How should we organize the description?
10.
What to WriteAbout?
Inception and elicitation - provide you with the information you’ll need to
begin writing use cases.
Requirements gathering meetings and other requirements engineering
mechanisms are used to
identify stakeholders
define the scope of the problem
specify overall operational goals
establish priorities
outline all known functional requirements, and
describe the things (objects) that will be manipulated by the system.
To begin developing a set of use cases, list the functions or activities
performed by a specific actor.
11.
How Much toWrite About?
As further conversations with the stakeholders progress, the
requirements gathering team develops use cases for each of the
functions noted.
In general, use cases are written first in an informal narrative fashion.
If more formality is required, the same use case is rewritten using a
structured format similar to the one proposed.
12.
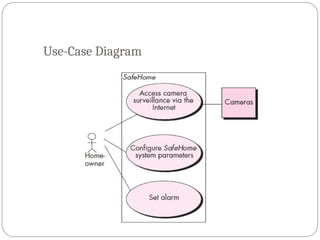
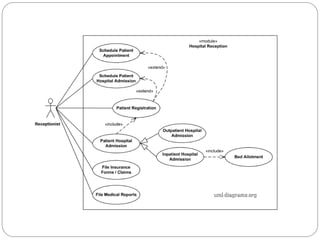
Use-Cases
a scenariothat describes a “thread of usage” for a system
actors represent roles people or devices play as the system
functions
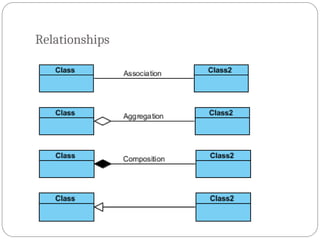
Relationships
System boundary
13.
Developing a Use-Case
What are the main tasks or functions that are performed by the actor?
What system information will the actor acquire, produce or change?
Will the actor have to inform the system about changes in the external
environment?
What information does the actor desire from the system?
Does the actor wish to be informed about unexpected changes?
14.
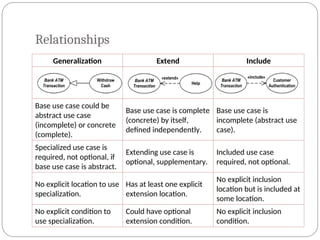
Relationships
Generalization Extend Include
Baseuse case could be
abstract use case
(incomplete) or concrete
(complete).
Base use case is complete
(concrete) by itself,
defined independently.
Base use case is
incomplete (abstract use
case).
Specialized use case is
required, not optional, if
base use case is abstract.
Extending use case is
optional, supplementary.
Included use case
required, not optional.
No explicit location to use
specialization.
Has at least one explicit
extension location.
No explicit inclusion
location but is included at
some location.
No explicit condition to
use specialization.
Could have optional
extension condition.
No explicit inclusion
condition.
15.
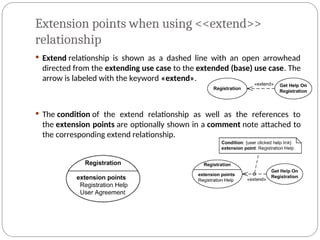
Extension points whenusing <<extend>>
relationship
Extend relationship is shown as a dashed line with an open arrowhead
directed from the extending use case to the extended (base) use case. The
arrow is labeled with the keyword «extend».
The condition of the extend relationship as well as the references to
the extension points are optionally shown in a comment note attached to
the corresponding extend relationship.
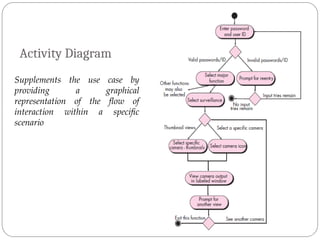
Activity Diagram
Supplements theuse case by
providing a graphical
representation of the flow of
interaction within a specific
scenario
19.
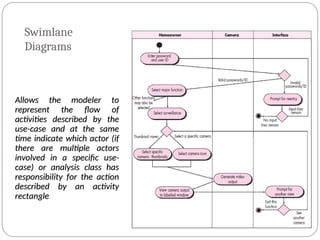
Swimlane
Diagrams
Allows the modelerto
Allows the modeler to
represent the flow of
represent the flow of
activities described by the
activities described by the
use-case and at the same
use-case and at the same
time indicate which actor (if
time indicate which actor (if
there are multiple actors
there are multiple actors
involved in a specific use-
involved in a specific use-
case) or analysis class has
case) or analysis class has
responsibility for the action
responsibility for the action
described by an activity
described by an activity
rectangle
rectangle
20.
Data Modeling
Examinesdata objects independently of processing
Focuses attention on the data domain
Creates a model at the customer’s level of abstraction
Indicates how data objects relate to one another
21.
What is aData Object?
a representation of almost any composite information that must be
understood by software.
composite information—something that has a number of different properties
or attributes
can be an external entity (e.g., anything that produces or consumes
information), a thing (e.g., a report or a display), an occurrence (e.g., a
telephone call) or event (e.g., an alarm), a role (e.g., salesperson), an
organizational unit (e.g., accounting department), a place (e.g., a
warehouse), or a structure (e.g., a file).
The description of the data object incorporates the data object and all of
its attributes.
A data object encapsulates data only—there is no reference within a data
object to operations that act on the data.
22.
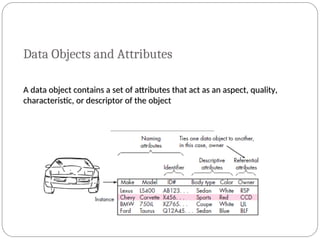
Data Objects andAttributes
A data object contains a set of attributes that act as an aspect, quality,
A data object contains a set of attributes that act as an aspect, quality,
characteristic, or descriptor of the object
characteristic, or descriptor of the object
23.
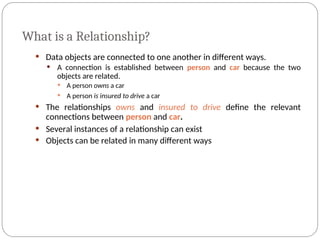
What is aRelationship?
Data objects are connected to one another in different ways.
A connection is established between person and car because the two
objects are related.
A person owns a car
A person is insured to drive a car
The relationships owns and insured to drive define the relevant
connections between person and car.
Several instances of a relationship can exist
Objects can be related in many different ways
24.
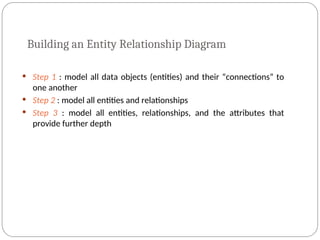
Building an EntityRelationship Diagram
Step 1 : model all data objects (entities) and their “connections” to
one another
Step 2 : model all entities and relationships
Step 3 : model all entities, relationships, and the attributes that
provide further depth
26.
Class-Based Modeling
Class-basedmodeling represents:
objects that the system will manipulate
operations (also called methods or services) that will be applied to the
objects to effect the manipulation
relationships between the objects
collaborations that occur between the classes that are defined.
The elements of a class-based model include classes and objects,
attributes, operations, CRC (class responsibility collaborator) models,
collaboration diagrams and packages.
27.
Manifestation of AnalysisClasses
Analysis classes manifest themselves in one of the following ways:
External entities (e.g., other systems, devices, people) that produce or consume
information
Things (e.g, reports, displays, letters, signals) that are part of the information
domain for the problem
Occurrences or events (e.g., a property transfer or the completion of a series of
robot movements) that occur within the context of system operation
Roles (e.g., manager, engineer, salesperson) played by people who interact with
the system
Organizational units (e.g., division, group, team) that are relevant to an
application
Places (e.g., manufacturing floor or loading dock) that establish the context of the
problem and the overall function
Structures (e.g., sensors, four-wheeled vehicles, or computers) that define a class
of objects or related classes of objects
28.
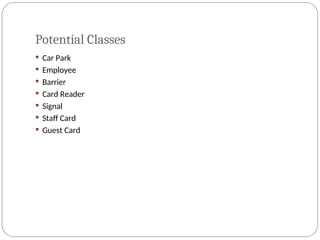
Potential Classes
Retainedinformation: Information about it must be remembered so that the
system can function.
Needed services. Operations that an change the value of its attributes in
some way.
Multiple attributes: That define the characteristics of the potential class.
Common attributes: These attributes apply to all instances of the class.
Common operations: These operations apply to all instances of the class.
Essential requirements: Finally, defines the requirements of the potential
class.
29.
Defining Attributes
Attributesdescribe a class that has been selected for
inclusion in the analysis model.
build two different classes for professional baseball players
For Playing Statistics software: name, position, batting average, fielding
percentage, years played, and games played might be relevant
For Pension Fund software: average salary, credit toward full vesting,
pension plan options chosen, mailing address, and the like.
30.
Defining Operations
Operationscan be divided into four broad categories:
(1) operations that manipulate data in some way (e.g., adding,
deleting, reformatting, selecting)
(2) operations that perform a computation
(3) operations that inquire about the state of an object, and
(4) operations that monitor an object for the occurrence of a
controlling event.
31.
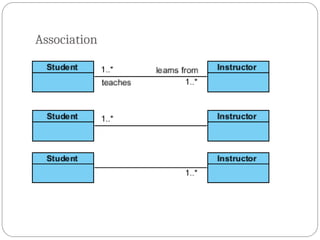
Associations and Dependencies
Two analysis classes are often related to one another in some fashion
In UML these relationships are called associations
Associations can be refined by indicating multiplicity (the term cardinality is
used in data modeling
In many instances, a client-server relationship exists between two
analysis classes.
In such cases, a client-class depends on the server-class in some way and a
dependency relationship is established
32.
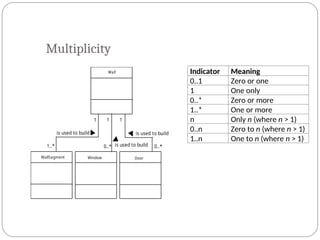
Multiplicity
WallSegment Window Door
Wall
isused to build
is used to build
is used to build
1..*
1 1 1
0..* 0..*
Indicator Meaning
0..1 Zero or one
1 One only
0..* Zero or more
1..* One or more
n Only n (where n > 1)
0..n Zero to n (where n > 1)
1..n One to n (where n > 1)
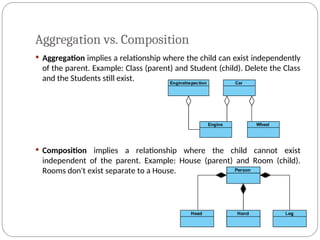
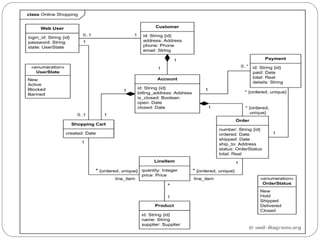
Aggregation vs. Composition
Aggregation implies a relationship where the child can exist independently
of the parent. Example: Class (parent) and Student (child). Delete the Class
and the Students still exist.
Composition implies a relationship where the child cannot exist
independent of the parent. Example: House (parent) and Room (child).
Rooms don't exist separate to a House.
37.
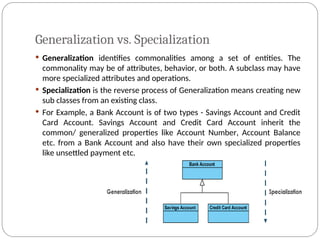
Generalization vs. Specialization
Generalization identifies commonalities among a set of entities. The
commonality may be of attributes, behavior, or both. A subclass may have
more specialized attributes and operations.
Specialization is the reverse process of Generalization means creating new
sub classes from an existing class.
For Example, a Bank Account is of two types - Savings Account and Credit
Card Account. Savings Account and Credit Card Account inherit the
common/ generalized properties like Account Number, Account Balance
etc. from a Bank Account and also have their own specialized properties
like unsettled payment etc.
38.
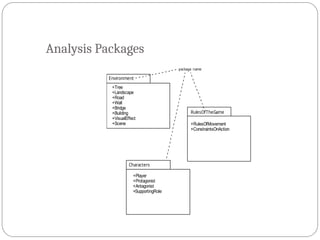
Analysis Packages
Variouselements of the analysis model (e.g., use-cases, analysis classes)
are categorized in a manner that packages them as a grouping
The plus sign preceding the analysis class name in each package indicates
that the classes have public visibility and are therefore accessible from
other packages.
Other symbols can precede an element within a package. A minus sign
indicates that an element is hidden from all other packages and a # symbol
indicates that an element is accessible only to packages contained within a
given package.
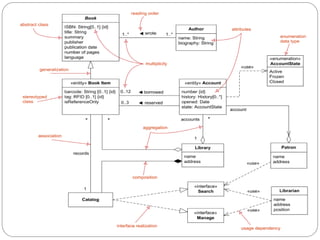
Class Types
Entityclasses, also called model or business classes, are extracted directly
from the statement of the problem (e.g., FloorPlan and Sensor).
Boundary classes are used to create the interface (e.g., interactive screen or
printed reports) that the user sees and interacts with as the software is
used.
Controller classes represent coordination, sequencing, transactions, and
control of other objects and are often used to encapsulate control related to
a specific use case.
Control classes are also used to represent complex derivations and calculations,
such as business logic, that cannot be related to any specific, long-lived information
stored by the system (ie. a specific entity class).
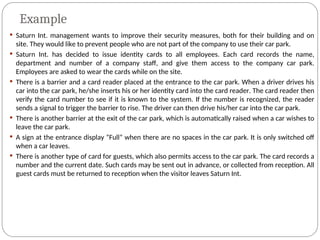
Example
Saturn Int.management wants to improve their security measures, both for their building and on
site. They would like to prevent people who are not part of the company to use their car park.
Saturn Int. has decided to issue identity cards to all employees. Each card records the name,
department and number of a company staff, and give them access to the company car park.
Employees are asked to wear the cards while on the site.
There is a barrier and a card reader placed at the entrance to the car park. When a driver drives his
car into the car park, he/she inserts his or her identity card into the card reader. The card reader then
verify the card number to see if it is known to the system. If the number is recognized, the reader
sends a signal to trigger the barrier to rise. The driver can then drive his/her car into the car park.
There is another barrier at the exit of the car park, which is automatically raised when a car wishes to
leave the car park.
A sign at the entrance display “Full” when there are no spaces in the car park. It is only switched off
when a car leaves.
There is another type of card for guests, which also permits access to the car park. The card records a
number and the current date. Such cards may be sent out in advance, or collected from reception. All
guest cards must be returned to reception when the visitor leaves Saturn Int.
46.
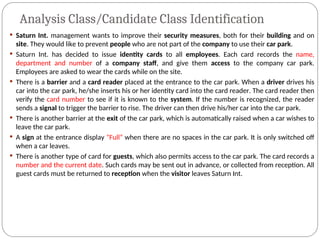
Analysis Class/Candidate ClassIdentification
Saturn Int. management wants to improve their security measures, both for their building and on
site. They would like to prevent people who are not part of the company to use their car park.
Saturn Int. has decided to issue identity cards to all employees. Each card records the name,
department and number of a company staff, and give them access to the company car park.
Employees are asked to wear the cards while on the site.
There is a barrier and a card reader placed at the entrance to the car park. When a driver drives his
car into the car park, he/she inserts his or her identity card into the card reader. The card reader then
verify the card number to see if it is known to the system. If the number is recognized, the reader
sends a signal to trigger the barrier to rise. The driver can then drive his/her car into the car park.
There is another barrier at the exit of the car park, which is automatically raised when a car wishes to
leave the car park.
A sign at the entrance display “Full” when there are no spaces in the car park. It is only switched off
when a car leaves.
There is another type of card for guests, which also permits access to the car park. The card records a
number and the current date. Such cards may be sent out in advance, or collected from reception. All
guest cards must be returned to reception when the visitor leaves Saturn Int.
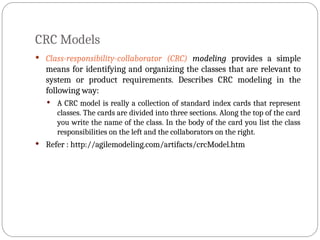
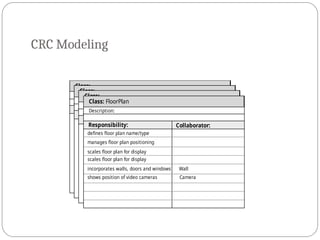
CRC Models
Class-responsibility-collaborator(CRC) modeling provides a simple
means for identifying and organizing the classes that are relevant to
system or product requirements. Describes CRC modeling in the
following way:
A CRC model is really a collection of standard index cards that represent
classes. The cards are divided into three sections. Along the top of the card
you write the name of the class. In the body of the card you list the class
responsibilities on the left and the collaborators on the right.
Refer : http://agilemodeling.com/artifacts/crcModel.htm
CRC Modeling
Class:
Description:
Responsibility: Collaborator:
Class:
Description:
Responsibility:Collaborator:
Class:
Description:
Responsibility: Collaborator:
Class: FloorPlan
Description:
Responsibility: Collaborator:
incorporates walls, doors and windows
shows position of video cameras
defines floor plan name/type
manages floor plan positioning
scales floor plan for display
scales floor plan for display
Wall
Camera
51.
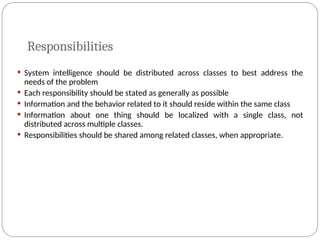
Responsibilities
System intelligenceshould be distributed across classes to best address the
needs of the problem
Each responsibility should be stated as generally as possible
Information and the behavior related to it should reside within the same class
Information about one thing should be localized with a single class, not
distributed across multiple classes.
Responsibilities should be shared among related classes, when appropriate.
52.
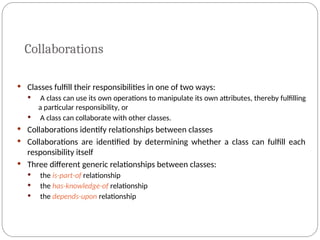
Collaborations
Classes fulfilltheir responsibilities in one of two ways:
A class can use its own operations to manipulate its own attributes, thereby fulfilling
a particular responsibility, or
A class can collaborate with other classes.
Collaborations identify relationships between classes
Collaborations are identified by determining whether a class can fulfill each
responsibility itself
Three different generic relationships between classes:
the is-part-of relationship
the has-knowledge-of relationship
the depends-upon relationship
53.
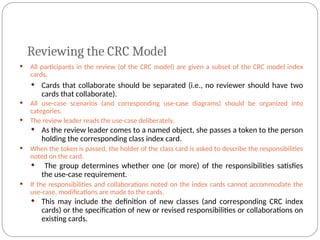
Reviewing the CRCModel
All participants in the review (of the CRC model) are given a subset of the CRC model index
cards.
Cards that collaborate should be separated (i.e., no reviewer should have two
cards that collaborate).
All use-case scenarios (and corresponding use-case diagrams) should be organized into
categories.
The review leader reads the use-case deliberately.
As the review leader comes to a named object, she passes a token to the person
holding the corresponding class index card.
When the token is passed, the holder of the class card is asked to describe the responsibilities
noted on the card.
The group determines whether one (or more) of the responsibilities satisfies
the use-case requirement.
If the responsibilities and collaborations noted on the index cards cannot accommodate the
use-case, modifications are made to the cards.
This may include the definition of new classes (and corresponding CRC index
cards) or the specification of new or revised responsibilities or collaborations on
existing cards.
54.
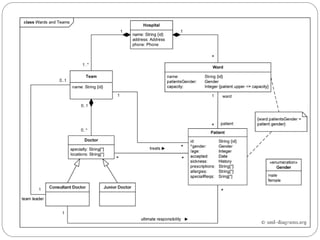
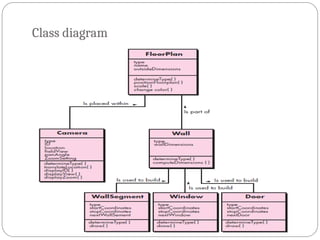
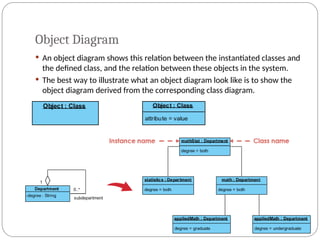
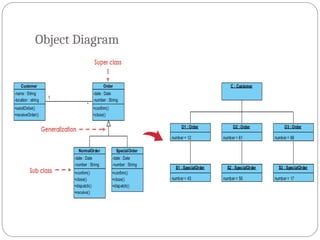
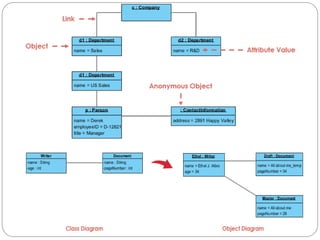
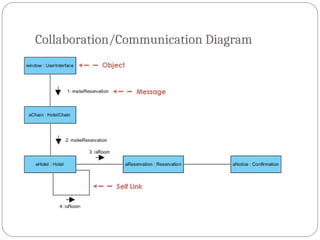
Object Diagram
Anobject diagram shows this relation between the instantiated classes and
the defined class, and the relation between these objects in the system.
The best way to illustrate what an object diagram look like is to show the
object diagram derived from the corresponding class diagram.
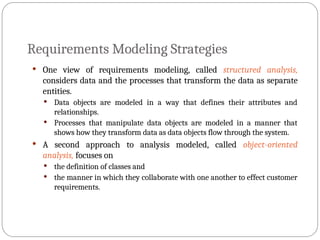
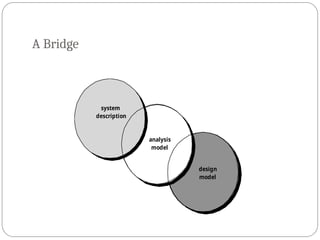
Requirements Modeling Strategies
One view of requirements modeling, called structured analysis,
considers data and the processes that transform the data as separate
entities.
Data objects are modeled in a way that defines their attributes and
relationships.
Processes that manipulate data objects are modeled in a manner that
shows how they transform data as data objects flow through the system.
A second approach to analysis modeled, called object-oriented
analysis, focuses on
the definition of classes and
the manner in which they collaborate with one another to effect customer
requirements.
58.
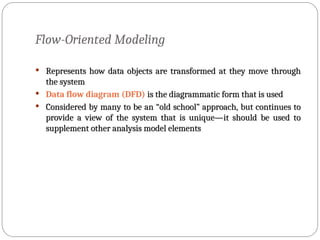
Flow-Oriented Modeling
Representshow data objects are transformed at they move through
Represents how data objects are transformed at they move through
the system
the system
Data flow diagram (DFD) is the diagrammatic form that is used
is the diagrammatic form that is used
Considered by many to be an “old school” approach, but continues to
Considered by many to be an “old school” approach, but continues to
provide a view of the system that is unique—it should be used to
provide a view of the system that is unique—it should be used to
supplement other analysis model elements
supplement other analysis model elements
59.
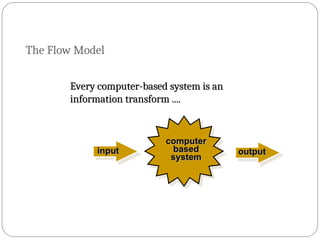
The Flow Model
Everycomputer-based system is an
Every computer-based system is an
information transform ....
information transform ....
computer
computer
based
based
system
system
input
input output
output
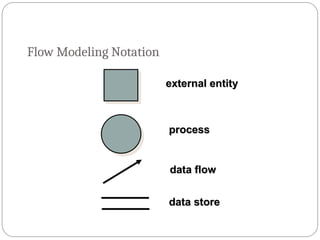
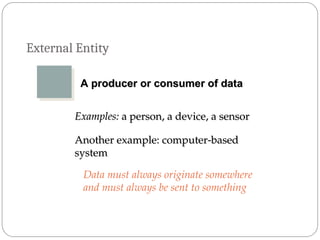
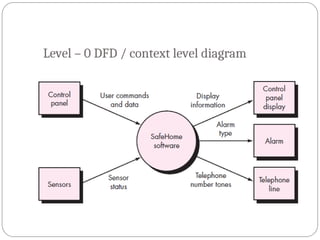
External Entity
A produceror consumer of data
A producer or consumer of data
Examples:
Examples: a person, a device, a sensor
a person, a device, a sensor
Another example: computer-based
Another example: computer-based
system
system
Data must always originate somewhere
and must always be sent to something
62.
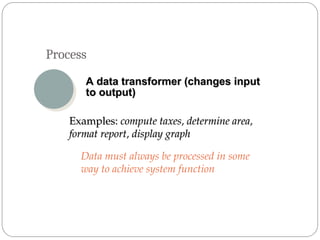
Process
A data transformer(changes input
A data transformer (changes input
to output)
to output)
Examples:
Examples: compute taxes, determine area,
compute taxes, determine area,
format report, display graph
format report, display graph
Data must always be processed in some
way to achieve system function
63.
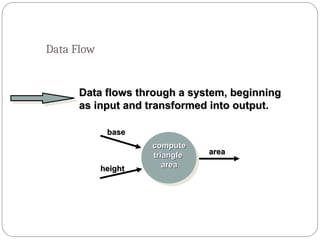
Data Flow
Data flowsthrough a system, beginning
Data flows through a system, beginning
as input and transformed into output.
as input and transformed into output.
compute
compute
triangle
triangle
area
area
base
base
height
height
area
area
64.
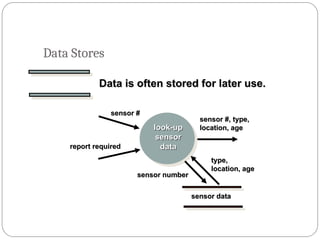
Data Stores
Data
Data isoften stored for later use.
is often stored for later use.
look-up
look-up
sensor
sensor
data
data
sensor #
sensor #
report required
report required
sensor #, type,
sensor #, type,
location, age
location, age
sensor data
sensor data
sensor number
sensor number
type,
type,
location, age
location, age
65.
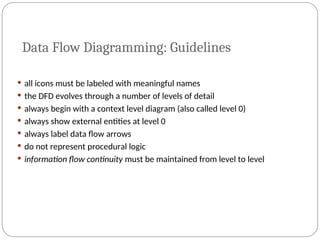
Data Flow Diagramming:Guidelines
all icons must be labeled with meaningful names
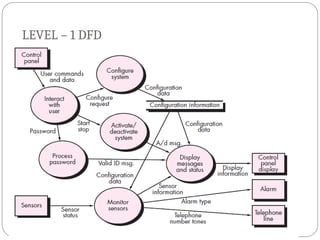
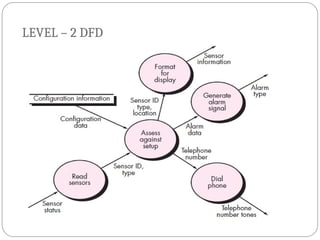
the DFD evolves through a number of levels of detail
always begin with a context level diagram (also called level 0)
always show external entities at level 0
always label data flow arrows
do not represent procedural logic
information flow continuity must be maintained from level to level
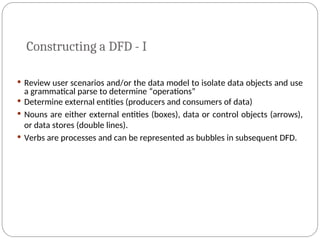
Constructing a DFD- I
Review user scenarios and/or the data model to isolate data objects and use
a grammatical parse to determine “operations”
Determine external entities (producers and consumers of data)
Nouns are either external entities (boxes), data or control objects (arrows),
or data stores (double lines).
Verbs are processes and can be represented as bubbles in subsequent DFD.
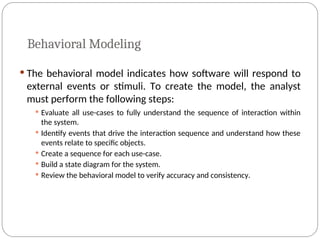
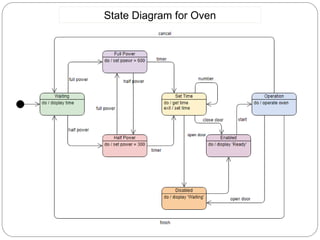
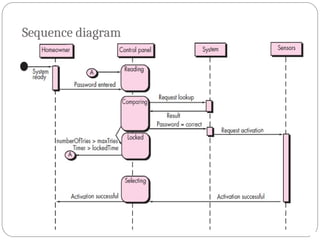
Behavioral Modeling
Thebehavioral model indicates how software will respond to
external events or stimuli. To create the model, the analyst
must perform the following steps:
Evaluate all use-cases to fully understand the sequence of interaction within
the system.
Identify events that drive the interaction sequence and understand how these
events relate to specific objects.
Create a sequence for each use-case.
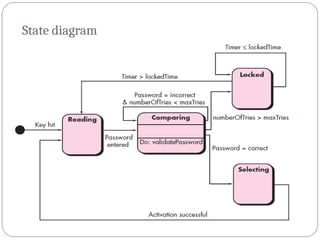
Build a state diagram for the system.
Review the behavioral model to verify accuracy and consistency.
71.
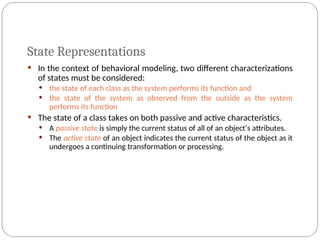
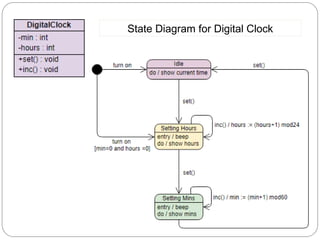
State Representations
Inthe context of behavioral modeling, two different characterizations
of states must be considered:
the state of each class as the system performs its function and
the state of the system as observed from the outside as the system
performs its function
The state of a class takes on both passive and active characteristics.
A passive state is simply the current status of all of an object’s attributes.
The active state of an object indicates the current status of the object as it
undergoes a continuing transformation or processing.
72.
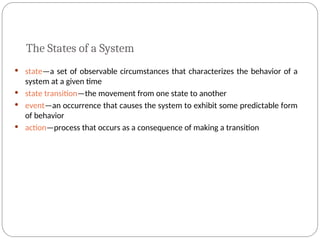
The States ofa System
state—a set of observable circumstances that characterizes the behavior of a
system at a given time
state transition—the movement from one state to another
event—an occurrence that causes the system to exhibit some predictable form
of behavior
action—process that occurs as a consequence of making a transition
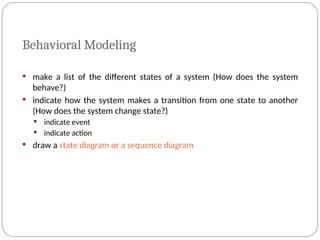
Behavioral Modeling
makea list of the different states of a system (How does the system
behave?)
indicate how the system makes a transition from one state to another
(How does the system change state?)
indicate event
indicate action
draw a state diagram or a sequence diagram
![Requirements Modeling
What is it? – uses a combination of text and diagrammatic forms to
depict requirements in a way that is relatively easy to understand and
to review for correctness, completeness and consistency.
Why is it important? – to validate software requirements from
different points of view. [scenario based, data, class oriented, flow
oriented, behavioral model]](https://image.slidesharecdn.com/6-250702175353-45eeb4a7/85/6-Requirement-Modelinbbdhdhbdhhdbbdg-ppt-2-320.jpg)
![Scenario-Based Modeling
“[Use-cases] are simply an aid to defining what exists outside the
system (actors) and what should be performed by the system (use-
cases).”
(1) What should we write about?
(2) How much should we write about it?
(3) How detailed should we make our description?
(4) How should we organize the description?](https://image.slidesharecdn.com/6-250702175353-45eeb4a7/85/6-Requirement-Modelinbbdhdhbdhhdbbdg-ppt-9-320.jpg)