Download to read offline

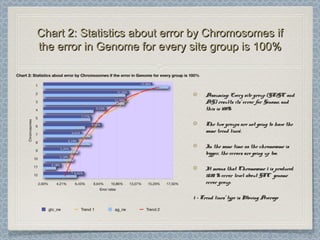
![Materials and methodsMaterials and methods
The NCBI Genome entries for the Oryza sativa chromosomes were used to estimateThe NCBI Genome entries for the Oryza sativa chromosomes were used to estimate
the sequencing error in the splicing donor/acceptor sites. The classical form of thethe sequencing error in the splicing donor/acceptor sites. The classical form of the
splicing sites (GT/GC - AG) was used for the analysis. Only variations in thissplicing sites (GT/GC - AG) was used for the analysis. Only variations in this
conservativeconservative Error rate by chromosome sequence were considered and any rareError rate by chromosome sequence were considered and any rare
splicing sites (AT/AC) [2] found were not taken into account.splicing sites (AT/AC) [2] found were not taken into account.
An alternative sequence of the rice genome was obtained from the Plant GenomeAn alternative sequence of the rice genome was obtained from the Plant Genome
Database [1]. It was used to verify the splicing errors in the NCBI sequence. TheDatabase [1]. It was used to verify the splicing errors in the NCBI sequence. The
positions of the Intron - Exon boundaries were taken from the annotation of thepositions of the Intron - Exon boundaries were taken from the annotation of the
NCBI Nucleotide entries ofNCBI Nucleotide entries of the chromosomes.The respective boundaries in thethe chromosomes.The respective boundaries in the
PGDB genome were selected by local pairwise alignment (BLAST) of thePGDB genome were selected by local pairwise alignment (BLAST) of the
chromosomes of the two retrieved genomes. The fragments that did not enter the bestchromosomes of the two retrieved genomes. The fragments that did not enter the best
BLAST result were ignored. We estimate the sequencing errors by calculating theBLAST result were ignored. We estimate the sequencing errors by calculating the
frequency of appearance of sites that do not match the canonical form.frequency of appearance of sites that do not match the canonical form.](https://image.slidesharecdn.com/sofia-2019-130715095519-phpapp01/85/Sofia-19-06-2011-bio-math-4-320.jpg)
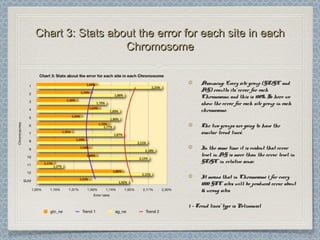
![Results and DiscussionResults and Discussion
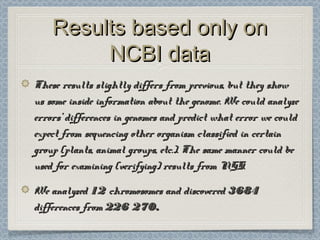
12 Chromosomes,12 Chromosomes, 225 981225 981 donor-donor-
acceptor sites checked,acceptor sites checked, 33853385 differencesdifferences
were found from the classical formwere found from the classical form
This leads to an error rate ofThis leads to an error rate of 1.501.50 xx 10-10-
22. This is three orders of magnitude higher. This is three orders of magnitude higher
than the estimated error rate by Wesche etthan the estimated error rate by Wesche et
al. [3] for the referent mouse genome (wholeal. [3] for the referent mouse genome (whole
genome shotgun sequence of the C57BL/6Jgenome shotgun sequence of the C57BL/6J
line), and one order of magnitude higherline), and one order of magnitude higher
than the estimated error for codingthan the estimated error for coding
sequences in the Genbank records of mousesequences in the Genbank records of mouse
genes.genes.
Chart 1Chart 1](https://image.slidesharecdn.com/sofia-2019-130715095519-phpapp01/85/Sofia-19-06-2011-bio-math-5-320.jpg)


This document analyzes sequencing error rates in genome databases by examining donor and acceptor splicing sites in rice genomes from NCBI and PlantGDB. The authors checked over 225,000 sites across 12 rice chromosomes and found 3,385 differences from the classical GT/AG forms, yielding an error rate of 1.5x10⁻². This is higher than estimated mouse genome error rates. Various statistics and charts are presented examining error rates by chromosome, site type, and comparing NCBI to PlantGDB data. The analysis provides insight into sequencing errors and their variation across genomes.


