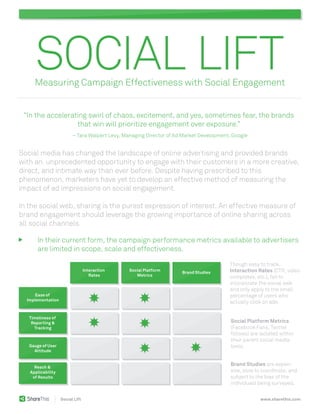
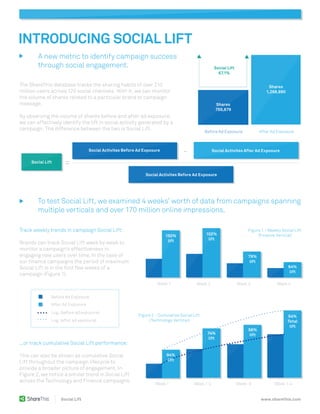
1) The document introduces Social Lift, a new metric for measuring the impact of ad campaigns on social engagement by comparing the volume of shares before and after ad exposure.
2) An analysis of over 170 million impressions across multiple industries found that Social Lift, which measures the percentage increase in shares, averaged 67.1% across campaigns.
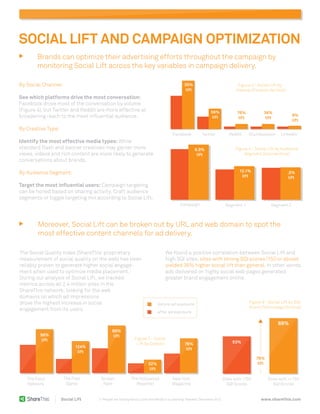
3) Social Lift can be used to optimize campaigns by tracking performance over time, comparing different content types, channels and audience segments to see which drive the highest engagement.

![Paid Owned Earned - the book [sample editorial] by Nick Burcher](https://cdn.slidesharecdn.com/ss_thumbnails/paidownedearnedbynickburcher-120217112411-phpapp02-thumbnail.jpg?width=640&height=640&fit=bounds)


![[Research];[Understanding the Value of Social Media]](https://cdn.slidesharecdn.com/ss_thumbnails/socmediaimpressionsusrpt4-19-10-100528091827-phpapp02-thumbnail.jpg?width=640&height=640&fit=bounds)


