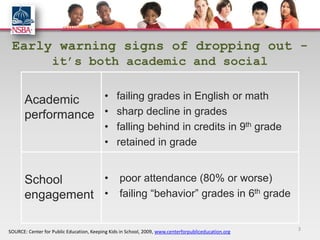
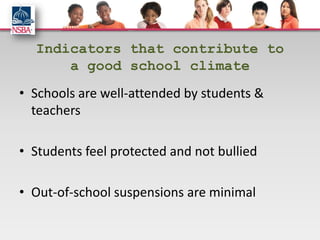
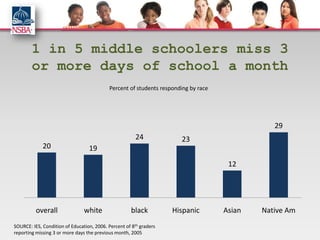
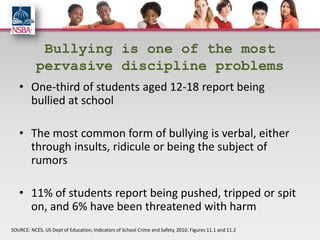
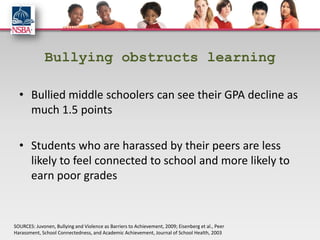
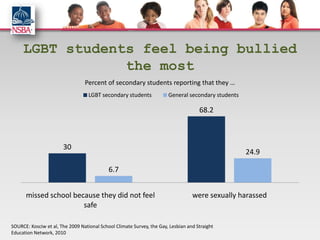
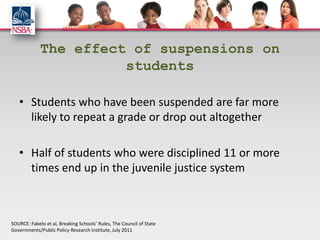
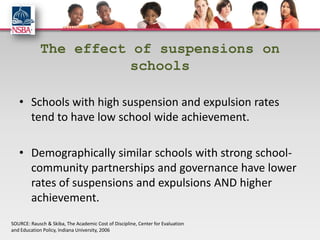
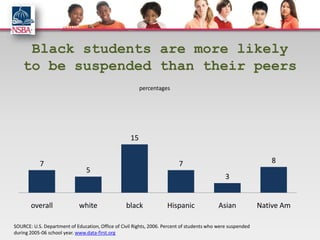
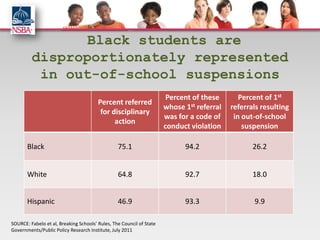
Why school climate is
      important
        Setting the stage for
  Students on Board conversations
                                     Prepared by
                     Center for Public Education
              National School Boards Association
                                     August 2011
A safe and welcoming learning climate is a
prerequisite to high student achievement. School
districts need to understand climate issues, conduct
assessments, pass policies, and take steps to make
improvement where necessary.

                -- Brian K. Perkins
                   The CUBE Survey of Urban School Climate
Early warning signs of dropping out -
                   it’s both academic and social


       Academic    • failing grades in English or math
       performance • sharp decline in grades
                                          • falling behind in credits in 9th grade
                                          • retained in grade


       School     • poor attendance (80% or worse)
       engagement • failing “behavior” grades in 6th grade

SOURCE: Center for Public Education, Keeping Kids in School, 2009, www.centerforpubliceducation.org   3
Indicators that contribute to
      a good school climate
• Schools are well-attended by students &
  teachers

• Students feel protected and not bullied

• Out-of-school suspensions are minimal
Attendance and learning

       • Students who miss a lot of school are more likely to
         earn low grades and test scores

       • Schools with high student absenteeism are more
         likely to have low student achievement

       • High teacher absenteeism also relates to lower
         student achievement
SOURCES: Roby, Research on School Attendance & Student Achievement, Education Research Quarterly, 2003; Gottfried, Evaluating the
Relationship Between Student Attendance and Achievement, AERA, 2010; Miller et al., Do Teacher Absences Impact Student
Achievement? NBER, 2007
1 in 5 middle schoolers miss 3
        or more days of school a month
                                           Percent of students responding by race


                                                                                               29
                                                       24             23
             20                   19
                                                                                     12


          overall               white                black          Hispanic        Asian   Native Am
SOURCE: IES, Condition of Education, 2006. Percent of 8th graders
reporting missing 3 or more days the previous month, 2005
1 in 20 teens miss school
because they do not feel safe there
                                           Percent of students responding by race


                                                                                                       8.1
                  5                                                             6.3
                                                3.5


              overall                         white                           black                  Hispanic

SOURCE: IES, Indicators of School Crime and Safety, 2010. Percent of students aged 12-17 reporting
missing school in previous month because they did feel safe there. www.data-first.org
How safe do students think their
              schools are?
 • Half of all students say there’s a lot of fighting in
   their school
 • Half of all students witness children being bullied at
   least once a month
 • Only one third of students believe teachers are able
   to stop bullying


SOURCE: percent who agree/strongly agree with statement. Brian K. Perkins, Where We
Learn, NSBA, Council of Urban Boards of Education, 2006
Fewer students today report
     feeling afraid than a decade ago
                             Percent of students who feel afraid in or on the way to school
                                                             1995      2007


                                            20                              21
                                                                                              14
             8                                          9                              7
                         4                                                                             2

                 white                         black                          Hispanic         other

SOURCE: NCES, US Dept of Education, Indicators of School Crime and Safety, 2009, Table 17.1
Bullying is one of the most
           pervasive discipline problems
   • One-third of students aged 12-18 report being
     bullied at school

   • The most common form of bullying is verbal, either
     through insults, ridicule or being the subject of
     rumors

   • 11% of students report being pushed, tripped or spit
     on, and 6% have been threatened with harm
SOURCE: NCES, US Dept of Education, Indicators of School Crime and Safety, 2010, Figures 11.1 and 11.2
Bullying obstructs learning

  • Bullied middle schoolers can see their GPA decline as
    much 1.5 points

  • Students who are harassed by their peers are less
    likely to feel connected to school and more likely to
    earn poor grades


SOURCES: Juvonen, Bullying and Violence as Barriers to Achievement, 2009; Eisenberg et al., Peer
Harassment, School Connectedness, and Academic Achievement, Journal of School Health, 2003
LGBT students feel being bullied
                 the most
                                 Percent of secondary students reporting that they …
                                   LGBT secondary students             General secondary students

                                                                                     68.2


                       30
                                                                                                    24.9

                                            6.7


      missed school because they did not feel                                     were sexually harassed
                       safe

SOURCE: Kosciw et al, The 2009 National School Climate Survey, the Gay, Lesbian and Straight
Education Network, 2010
If we are going to stem the tide in student bullying, it
will not be because of mandates from above, but
rather because local school board members have
drawn out students’ voices, creating conditions for
them to analyze root causes and generate solutions
that work.
                        -- Mary Broderick
                           NSBA president, 2011-12
The effect of suspensions on
                       students

   • Students who have been suspended are far more
     likely to repeat a grade or drop out altogether

   • Half of students who were disciplined 11 or more
     times end up in the juvenile justice system


SOURCE: Fabelo et al, Breaking Schools’ Rules, The Council of State
Governments/Public Policy Research Institute, July 2011
The effect of suspensions on
                        schools

   • Schools with high suspension and expulsion rates
     tend to have low school wide achievement.

   • Demographically similar schools with strong school-
     community partnerships and governance have lower
     rates of suspensions and expulsions AND higher
     achievement.
SOURCE: Rausch & Skiba, The Academic Cost of Discipline, Center for Evaluation
and Education Policy, Indiana University, 2006
Black students are more likely
    to be suspended than their peers
                                                         percentages


                                                    15


           7                                                              7                                     8
                                5
                                                                                               3


       overall               white                black             Hispanic               Asian             Native Am

SOURCE: U.S. Department of Education, Office of Civil Rights, 2006. Percent of students who were suspended
during 2005-06 school year. www.data-first.org
Black students are
         disproportionately represented
          in out-of-school suspensions
                                                                       Percent of these       Percent of 1st
                                        Percent referred
                                                                      whose 1st referral   referrals resulting
                                         for disciplinary
                                                                      was for a code of     in out-of-school
                                              action
                                                                      conduct violation        suspension

       Black                                     75.1                       94.2                  26.2


       White                                     64.8                       92.7                  18.0


       Hispanic                                  46.9                       93.3                  9.9

SOURCE: Fabelo et al, Breaking Schools’ Rules, The Council of State
Governments/Public Policy Research Institute, July 2011
Why the discrepancy?


   • To date, researchers have found no evidence that
     black students commit more serious offenses than
     other groups

   • Some researchers suggest black students are referred
     for more “subjective” reasons


SOURCE: Rausch & Skiba, The Academic Cost of Discipline, Center for Evaluation and Education Policy, Indiana University, 2006; Fabelo
et al, Breaking Schools’ Rules, The Council of State Governments/Public Policy Research Institute, July 2011
How is your school climate?
                    Ask the students
   The large majority of students say they enjoy learning, trust their
   teachers, and like coming to school. But enough students don’t
   feel this way to cause concern:

   • One third of all students say they don’t believe teachers are
     fair to everyone; black students were more likely to feel this
     way
   • One third aren’t sure if their teachers care about their success


SOURCE: Brian K. Perkins, Where We Learn, NSBA, Council of Urban Boards
of Education, 2006
Students cannot learn in chaos, fear, or
embarrassment …. If you really want to know what
people feel about their schools, ask them.

                     -- The Key Work of School Boards
Get the conversation going

• What is school like for you?
• Do you feel safe at school?
• Have you seen someone bullied? Is this common or
  rare? Did another student or teacher try to stop it?
• Do you feel respected by teachers and staff? Do they
  care if you’re successful?
If you were the school board, what would be
one thing you would do to improve the
school?
Moving forward
    • Use your data. Include a school climate assessment
      as part of your annual district evaluation
    • Establish an early warning data system to identify
      students who may be in danger of dropping out
    • Encourage stakeholder involvement in ongoing
      discussions. Don’t forget students!
    • Establish clear policies to create a positive school
      climate

Adapted from Perkins, Where We Learn, 2006, and Keeping Kids in School, Center for Public Education, 2009.
Learn more about school climate
policies and practices that work

 http://www.nsba.org/Students-on-Board
 http://www.nsba.org/Bullying

Students on Board (Slides only)

  • 1.
    Why school climateis important Setting the stage for Students on Board conversations Prepared by Center for Public Education National School Boards Association August 2011
  • 2.
    A safe andwelcoming learning climate is a prerequisite to high student achievement. School districts need to understand climate issues, conduct assessments, pass policies, and take steps to make improvement where necessary. -- Brian K. Perkins The CUBE Survey of Urban School Climate
  • 3.
    Early warning signsof dropping out - it’s both academic and social Academic • failing grades in English or math performance • sharp decline in grades • falling behind in credits in 9th grade • retained in grade School • poor attendance (80% or worse) engagement • failing “behavior” grades in 6th grade SOURCE: Center for Public Education, Keeping Kids in School, 2009, www.centerforpubliceducation.org 3
  • 4.
    Indicators that contributeto a good school climate • Schools are well-attended by students & teachers • Students feel protected and not bullied • Out-of-school suspensions are minimal
  • 5.
    Attendance and learning • Students who miss a lot of school are more likely to earn low grades and test scores • Schools with high student absenteeism are more likely to have low student achievement • High teacher absenteeism also relates to lower student achievement SOURCES: Roby, Research on School Attendance & Student Achievement, Education Research Quarterly, 2003; Gottfried, Evaluating the Relationship Between Student Attendance and Achievement, AERA, 2010; Miller et al., Do Teacher Absences Impact Student Achievement? NBER, 2007
  • 6.
    1 in 5middle schoolers miss 3 or more days of school a month Percent of students responding by race 29 24 23 20 19 12 overall white black Hispanic Asian Native Am SOURCE: IES, Condition of Education, 2006. Percent of 8th graders reporting missing 3 or more days the previous month, 2005
  • 7.
    1 in 20teens miss school because they do not feel safe there Percent of students responding by race 8.1 5 6.3 3.5 overall white black Hispanic SOURCE: IES, Indicators of School Crime and Safety, 2010. Percent of students aged 12-17 reporting missing school in previous month because they did feel safe there. www.data-first.org
  • 8.
    How safe dostudents think their schools are? • Half of all students say there’s a lot of fighting in their school • Half of all students witness children being bullied at least once a month • Only one third of students believe teachers are able to stop bullying SOURCE: percent who agree/strongly agree with statement. Brian K. Perkins, Where We Learn, NSBA, Council of Urban Boards of Education, 2006
  • 9.
    Fewer students todayreport feeling afraid than a decade ago Percent of students who feel afraid in or on the way to school 1995 2007 20 21 14 8 9 7 4 2 white black Hispanic other SOURCE: NCES, US Dept of Education, Indicators of School Crime and Safety, 2009, Table 17.1
  • 10.
    Bullying is oneof the most pervasive discipline problems • One-third of students aged 12-18 report being bullied at school • The most common form of bullying is verbal, either through insults, ridicule or being the subject of rumors • 11% of students report being pushed, tripped or spit on, and 6% have been threatened with harm SOURCE: NCES, US Dept of Education, Indicators of School Crime and Safety, 2010, Figures 11.1 and 11.2
  • 11.
    Bullying obstructs learning • Bullied middle schoolers can see their GPA decline as much 1.5 points • Students who are harassed by their peers are less likely to feel connected to school and more likely to earn poor grades SOURCES: Juvonen, Bullying and Violence as Barriers to Achievement, 2009; Eisenberg et al., Peer Harassment, School Connectedness, and Academic Achievement, Journal of School Health, 2003
  • 12.
    LGBT students feelbeing bullied the most Percent of secondary students reporting that they … LGBT secondary students General secondary students 68.2 30 24.9 6.7 missed school because they did not feel were sexually harassed safe SOURCE: Kosciw et al, The 2009 National School Climate Survey, the Gay, Lesbian and Straight Education Network, 2010
  • 13.
    If we aregoing to stem the tide in student bullying, it will not be because of mandates from above, but rather because local school board members have drawn out students’ voices, creating conditions for them to analyze root causes and generate solutions that work. -- Mary Broderick NSBA president, 2011-12
  • 14.
    The effect ofsuspensions on students • Students who have been suspended are far more likely to repeat a grade or drop out altogether • Half of students who were disciplined 11 or more times end up in the juvenile justice system SOURCE: Fabelo et al, Breaking Schools’ Rules, The Council of State Governments/Public Policy Research Institute, July 2011
  • 15.
    The effect ofsuspensions on schools • Schools with high suspension and expulsion rates tend to have low school wide achievement. • Demographically similar schools with strong school- community partnerships and governance have lower rates of suspensions and expulsions AND higher achievement. SOURCE: Rausch & Skiba, The Academic Cost of Discipline, Center for Evaluation and Education Policy, Indiana University, 2006
  • 16.
    Black students aremore likely to be suspended than their peers percentages 15 7 7 8 5 3 overall white black Hispanic Asian Native Am SOURCE: U.S. Department of Education, Office of Civil Rights, 2006. Percent of students who were suspended during 2005-06 school year. www.data-first.org
  • 17.
    Black students are disproportionately represented in out-of-school suspensions Percent of these Percent of 1st Percent referred whose 1st referral referrals resulting for disciplinary was for a code of in out-of-school action conduct violation suspension Black 75.1 94.2 26.2 White 64.8 92.7 18.0 Hispanic 46.9 93.3 9.9 SOURCE: Fabelo et al, Breaking Schools’ Rules, The Council of State Governments/Public Policy Research Institute, July 2011
  • 18.
    Why the discrepancy? • To date, researchers have found no evidence that black students commit more serious offenses than other groups • Some researchers suggest black students are referred for more “subjective” reasons SOURCE: Rausch & Skiba, The Academic Cost of Discipline, Center for Evaluation and Education Policy, Indiana University, 2006; Fabelo et al, Breaking Schools’ Rules, The Council of State Governments/Public Policy Research Institute, July 2011
  • 19.
    How is yourschool climate? Ask the students The large majority of students say they enjoy learning, trust their teachers, and like coming to school. But enough students don’t feel this way to cause concern: • One third of all students say they don’t believe teachers are fair to everyone; black students were more likely to feel this way • One third aren’t sure if their teachers care about their success SOURCE: Brian K. Perkins, Where We Learn, NSBA, Council of Urban Boards of Education, 2006
  • 20.
    Students cannot learnin chaos, fear, or embarrassment …. If you really want to know what people feel about their schools, ask them. -- The Key Work of School Boards
  • 21.
    Get the conversationgoing • What is school like for you? • Do you feel safe at school? • Have you seen someone bullied? Is this common or rare? Did another student or teacher try to stop it? • Do you feel respected by teachers and staff? Do they care if you’re successful?
  • 22.
    If you werethe school board, what would be one thing you would do to improve the school?
  • 23.
    Moving forward • Use your data. Include a school climate assessment as part of your annual district evaluation • Establish an early warning data system to identify students who may be in danger of dropping out • Encourage stakeholder involvement in ongoing discussions. Don’t forget students! • Establish clear policies to create a positive school climate Adapted from Perkins, Where We Learn, 2006, and Keeping Kids in School, Center for Public Education, 2009.
  • 24.
    Learn more aboutschool climate policies and practices that work http://www.nsba.org/Students-on-Board http://www.nsba.org/Bullying

Editor's Notes

  • #2 Successful schools make students feel welcome, academically engaged and supported by the adults in the building. Considering the school climate of your schools is as important as examining student scores and graduation rates because a healthy environment can have a tremendous impact on student achievement. This presentation reviews the research on the relationship between school climate and student learning, and gives an overview of what students nationally think and say about the climate of their schools.
  • #4 Failing students often feel left out of the school culture, and students who are disengaged don’t often produce academically. It’s a chicken or egg situation, and varies from one student to the next. What we know is that students who exhibit these early warning signs are in danger of eventually dropping out. Successful interventions attend to both their academic and social needs to put them back on track.
  • #5 While this list is not inclusive, these indicators represent a good jumping off point for considering school climate. The slides that follow show data for each of these indicators and how it relates to a safe and productive learning environment and high student achievement.
  • #6 Attendance is key to student achievement and it’s not just student attendance. High absenteeism among teachers can also have a negative impact on school climate and performance.
  • #7 Missing 3 or more days monthly is a high rate of absenteeism, and can translate into academic failure and social disengagement. Reading this graph: 20% of all middle school students reported missing 3 or more days the previous month.
  • #8 Feeling unsafe or bullied in or on the way to school prompts many students to miss school. Reading this graph: 5% of students aged 12-17 reported missing school the previous month because they did not feel safe.
  • #10 Since the 1990s, US schools have seen a sizable decline in violent crimes committed on their campuses. Nonetheless 5% of all students still do not feel safe in or on the way to school. Students of color are more likely to feel afraid than their white peers.
  • #12 Even verbal bullying can have a negative impact on student performance.
  • #13 Lesbian, gay, bisexual and transgender youth report being bullied more than other students. Reading this graph: 30% of secondary LGBT students said they missed school because they did not feel safe compared to 6.7% of the general population of secondary students.
  • #15 Discipline problems also contribute to a poor school climate. While schools have a responsibility to protect students from disruptive or dangerous peers, it’s important to understand that students who are being disciplined through out-of-school suspensions suffer academically, too, and often end up in the juvenile justice system.
  • #16 Out-of-school suspensions and expulsions can also have a negative impact on school wide performance. Researchers Rausch and Skiba compared demographically similar schools and found that some schools are able to keep suspensions down and produce higher student outcomes as a result. The effective practices included community partnerships and strong school leadership.
  • #17 Black students are more likely than other racial/ethnic groups to receive out-of-school suspensions.
  • #18 Texas researchers found that nine out of ten students who are referred for disciplinary action for the first time are referred for a “code of conduct” violation, which is discretionary and not mandated by state standards. This is true for all races. However, black students are more likely to be given an out-of-school suspension than their white and Hispanic peers for their first offense.
  • #22 NSBA encourages school boards to hold conversations with students to begin to understand the climate in their district schools. Guidelines for holding these conversations can be found in the “Students on Board” brochure. Here is a sample of some key questions to get the conversation going.
  • #23 Get students’ ideas about how school boards could improve school climate.
  • #24 Don’t let the effort stop with the conversation. There are things that school boards can do to improve the climate in their district.