
Recommended
Recommended
More Related Content
Similar to SM Nonprofit Ad Campaign Term Project InstructionsOverview.docx
Similar to SM Nonprofit Ad Campaign Term Project InstructionsOverview.docx (20)
More from jennifer822
More from jennifer822 (20)
Recently uploaded
Recently uploaded (20)
SM Nonprofit Ad Campaign Term Project InstructionsOverview.docx
- 1. SM Nonprofit Ad Campaign Term Project Instructions Overview Marketing can inspire change, generate donations, and inform the public. However, nonprofits often lack the marketing prowess needed to reach consumers. You are tasked to create a marketing ad and social media campaign for a nonprofit you choose. Visit the nonprofit website to understand their purpose and align the ad campaign you create. Choose one of the following charities on the website to build a social media ad campaign. https://charity.lovetoknow.com/Top_100_Charities The below items are to be turned in on Blackboard in a Word document. Each student is responsible for submitting their own unique work. Check SafeAssign at submission for plagiarism; unintentional plagiarism is still plagiarism. Ad Content 1) Ad/image that can standalone (if posted on a social media platform in smartphone or desktop view). Ad should be unambiguously clear, easy to read within moments, and eye- catching. Content needs to be accurate, informative, and convincing to change behavior. Include the name of the charity and method to connect with existing platforms. Written responses describing the ad campaign Written work: 2-3 pages, 1-inch margins 12-point Times New
- 2. Roman/Arial font, double spaced. Be specific with details, use examples, and thoroughly explain your reasoning. The written work should articulate your knowledge about social media strategy, marketing mix, research measures, and other materials covered throughout this course. Demonstrate your understanding of course materials by writing about these topics. 2) Describe what is the content in the ad (e.g. Call to Action (CTA) hashtag, information guide, change behavior, draw clicks to website)? Be specific. Restating these examples is insufficient. 3) What is the name of the ad campaign? What is this social media ad campaign trying to do? Thoroughly explain your reasoning and be specific. 4) What is the method for releasing on social media (e.g. platform, timing, target market, length of campaign)? Elaborating and be specific with details. 5) What are the measures for success (e.g. how many likes/comments/shares)? State specific goals and figures that would indicate if the campaign was successful. Sample Ads Note: These are basic samples. The quality of work and attention to details should be greater. Expectations in the workplace are higher for employees creating marketing materials because businesses depend on generating revenue from these kinds of ads. In fact, these sample ads draw website visits. Notice what works and doesn’t work from the samples. https://www.studentdigz.co.za/sharing-is-caring/
- 3. Graphic CPR ad example with moving pictures: https://carrington.edu/blog/medical/how-to-perform-cpr/ https://www.cprcertified.com/how-to-perform-hands-only-cpr- infographic https://www.dreamstime.com/stock-illustration-benefits- drinking-water-infographic-vector-illustration-image67570223 http://ankhrahhq.blogspot.com/2015/06/vegetable-benefits-you- should-know.html MORE EXPIREMENTAL DESIGNS Within Subjects and Factorial Research Designs https://my.visme.co/render/1454648890/www.erau.edu Slide 1 Transcript Within-subjects design differs from between-subjects design in that the same participants perform at all levels of the
- 4. independent variable. These sometimes are called repeated measures designs. In a good within-subjects design, the various interventions are introduced very close together in time, in some cases simultaneously. For the within-subjects design to work, the interventions must be introduced so the effects are fairly localized and unlikely to spread beyond specifically targeted behaviors. The interventions should be introduced in a balanced but somewhat random order. Research covered in the between-subjects and within subject’s designs has focused on studies with just one independent variable. When two or more independent variables need to be examined, the approach is known as a factorial design. There are several types, and they can be combined with other research designs. For purposes of this course, only a few forms will be covered, since there are many more complicated versions possible. Controls Between-subjects designs Have different participants in each measure Within-subjects design used to Manage sample size (smaller N needed) Observe over time Within-subjects designs Have the same participants in all measures
- 5. Randomization compensated for by Time-related factors (risk of intervening variables) Order effects (sequence of exposure to levels of IV) Usually limited to one independent variable Slide 3 Transcript In the between-subjects designs that we covered earlier, a different set of participants was observed in each of the groups. So that we might measure the same participants within the groups, the within-subjects design is used. So, the same participants now can be measured for each of the levels created for the independent variable. Yes, this design also is usually limited to just one experimental factor. The within-subjects design would be chosen to manage the sample size and to observe changes in something over time. As for the sample size, since we are measuring the same participants in each of the levels, only one group is needed, which reduces the number from what would be required if we had to find different participants for each of the levels. The second issue, measures of the same participant over time, becomes possible in the within-subjects design. However, it challenges the requirement for randomization needed to qualify as an experiment. To compensate for this, researchers control for time-related factors and for order effects to strengthen internal validity.
- 6. Time-related factors are introduced into a study because the same participants are involved with several levels of the variable over a period of time. Consequently, confounding variables like maturation, testing effects, regression toward the mean, attrition, and fatigue, to name a few, threaten the study’s internal validity. These effects must be the same between the groups, or, controlled. So, to control these time-related factors, two strategies are available and will be covered in the next slide. Counterbalancing and Timing Order effects are the sequence in which the IV is presented Timing controlsCounterbalancing Interval of time between IV applications Managing order effects increases internal validity Ideally, extend intervals and minimize overall time Alternating the order of IV presentation for groups Partial counterbalancing Slide 5 Transcript Time-related factors can be controlled by addressing order
- 7. effects which are what they sound like, the order in which variations of the independent variable are presented to participants. Typically, all the participants in one group will receive the interventions at the same time in the same sequence. Another group may receive them in a different, even opposite, order. This is called counterbalancing. For studies with a large number of groups, more than three, for instance, it is not possible to symmetrically counterbalance all the levels, so, the number and general sequence of interventions is designed to be as representative of other groups as is possible. This variation is called partial counterbalancing. A second way to control for threats to internal validity is to control timing of the treatment applications. A couple of approaches work well. First, the interval of time between administrations of the independent variable can be adjusted to minimize undesired effects by shortening the intervals, or to maximize the interval to offset undesired effects like heightened adrenalin. Second, the researcher can manage the overall elapsed time for the experiment by minimizing the total duration. Ideally, to control for threats to internal validity, the researcher would extend the intervals and minimize the total time for the experiment. Sources for Variability Review Between-groups and within-groups are SS and MS deviations Between-subjects variation is from individual differences
- 8. Within-subjects variation is from participant change over time Within-subjects research Multiple measures, same subjects Between groups variability reflected in mean differences Determine effects are from IV, not individual/group differences Error Assumes removal of individual differences Any other difference is attributed to influence of IV Within-group variability remains Slide 7 Transcript Let’s take a deep breathe here and review something. It is important to keep the distinctions clear regarding what between-
- 9. groups and between-subjects is about. This also applies to within-groups and within-subjects designs. The terms between or within-groups refers to the sum of squares and mean squares calculations to define deviations, something we find in an ANOVA, for example. The whole purpose of an ANOVA is to compare the ratio of between group variance to within group variance. However, in the last two modules we have been covering between and within subjects designs. Between-subjects variation is from individual differences among participants. And within-subjects variation is a measure of how much an individual in the sample tends to change over time. In other words, it is the mean of the change for the average individual in your sample. Within-subjects research makes multiple measurements on the same subjects while they serve as their own controls. When making these multiple measures, the researcher wants to be sure any effects are from the intervention and not attributable to individual differences among the participants or differences between groups. How participants differ within each group is within-groups variability. There is another source of variability and that is error. Error is what is left over when the individual differences attributed to between group differences are removed, and the within-groups variability for the within-subjects experiment is all that remains. Sampling for Within-Subjects Designs Two sampling methodologies typically used Select two groups from same population, observe separately Match pairs between groups on common measure
- 10. Multiple samples (3+) use only repeated measures each group One-way Within-Subjects ANOVA as statistic Post-hoc tests of all possible pairings Solomon Four-Group Design 12 separate analyses GGrroouupp PPrreetteestst TTrreeaattmmeenntt PPooststtteestst Group A Group B Group C Group D The experimental group is Group A, and the three control groups are included to account confounds or estraneous factors that could be causing differences pre- to posttreatment. Used with permission by G. Privitera and Sage Publications (copyright 2017). for possiblee Slide 9 Transcript There are two predominant ways to sample for participants in a within-subjects design. With two groups being selected from the same population the participants are observed in each
- 11. group separately. The other way is to match pairs based on a measure common to the dependent variable. This limits the comparison to something under the control of the researcher, and not occurring naturally So, the researcher matches a participant in Group A with a participant from Group B, then all the matched participants within a group can be evaluated using a paired-samples t-test. So far, we have been using two groups from the population. An experiment studying three or more groups from the same population obviously cannot use the matching technique, but the repeated measures design is fine to use. The same controls and provisions for an experiment are applied. The one-way within-subjects analysis of variance statistic is appropriate here and measures the variance of differences between groups divided by the variance of differences due to error or individual differences. With the result, we can tell if there is a difference somewhere among the sample groups. This would be followed by post-hoc tests of all the possible pairings to see which showed notable differences. It is worth mentioning one more design that uses both the between subjects and within-subjects analysis in the same study. It is called the Solomon Four-group design and meets the requirements for an experiment, so cause and effect can be determined. The chart below shows the different combinations to isolate effects from the independent variable. As you can see, there are 12 possible combinations to analyze. Types of Factorial Designs Multiple independent factors (variables) can be measured Investigate effects of one variable on another independently
- 12. Allows cross testing various combinations of factor levels Studies effects of multiple factors upon a dependent variable Types of designs Between subjects – separate group for each condition Within subjects – single group for all conditions Mixed – combines between and within subjects factors May combine experimental factors with quasi-experimental Notation system identifies number of factors and levels Slide 11 Transcript The factorial analysis was introduced earlier as a methodology used in quasi-experimental research designs where the single independent variable was pre-existing and therefore not able to be controlled by the researcher. Factorial designs are elaborations of single-variable experimental designs typically performed for complex issues. At times, multiple independent variables, also called factors, must be tested with the same participants. This allows the researcher to investigate questions about whether the effect of one independent variable depends on a level of another and is referred to as an interaction between or among the independent variables. The factorial analysis allows for each variable to be tested independent of other variables. It also allows a combination of variables to be tested as all levels of one variable are crossed with all levels of the other variables. Now, an advantage of the multiple independent variables approach is that the researcher can intentionally examine influences of
- 13. several variables upon the target, or dependent variable. If just one independent variable is being investigated, an ANOVA would be appropriate. When multiple independent variables are involved, the factorial analysis is best. The purpose of a factorial design is to determine whether the effects of an independent variable are generalizable across all levels or whether the effects are specific to particular levels. There are three types of factorial design. In the between subjects designs there is a separate group of participants for each of the treatment conditions, which requires a large number of participants in each condition. For the within-subjects designs a single group of participants is involved in all of the separate treatment conditions. A factorial study that combines two different research designs is called a mixed design and may include at least one factor between and one within. There are also factorial designs that use an experimental strategy for one factor and a quasi-experimental factor or non-experimental strategy for another factor. Factorial designs use a notation system that identifies both the number of factors and the number of values or levels that exist for each factor. Sampling for Factorial Designs Between subjects factor Large number of participants Within subjects factor Controls for timing and order One factor at a time (OFAT) approach with few factors
- 14. As variables increase design becomes unwieldy Latin hypercube Cluster sampling Sample size Issues of power and effect size Slide 13 Transcript In some respects, sampling is similar to what we have seen with other experimental designs. For instance, if it’s a between- subjects factor then random assignment to groups and observation of different participants is best. This can require a substantial number of participants. If it’s a within-subjects factor then observation of the same participants using controls for timing and order effects is best, and fewer participants are needed. With so many potential combinations of factor levels to deal with in a factorial design, using OFAT, or the one factor at a time approach, is often applied with a limited number of variables. This is also called the randomized control trials methodology, but it has limitations when used with a factorial design. We can see this in the 2 x 2 design where each of the four combinations is a factor and a group being assessed. But, as the number of variables and levels increase, the matrix becomes somewhat unwieldy, plus it becomes impractical to keep increasing the number of sample sets. By combining various grouping, the issue can be managed effectively, although some validity threats may increase. There are very sophisticated approaches for handling large numbers of factors being analyzed which might include the Latin hypercube or cluster sampling of an elementary effect. In determining sample size, we return to the issue of power, so the smallest effect size is maintained at the desired level.
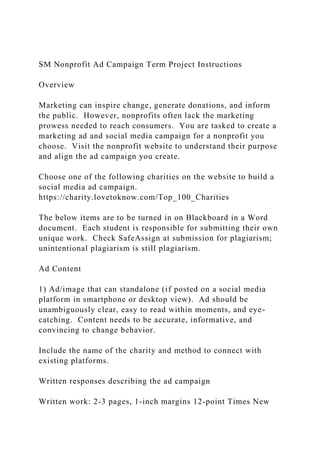
- 15. Sometimes researchers add another factor after the initial design, however, the sample size requirements change very little as long as the expected effect size doesn’t change. Main Effects and Interactions Main effects are main differences among levels of a factor Overall difference among levels of a factor consistent across levels of another factor Interactions are relationships among levels of factors Mean differences between cells differs from prediction Indicated by nonparallel lines Both can be examined by graphing cell means Two-way ANOVA used for analysis Alcohol and Caffeine Interaction 1 2 3 Caffeine 0
- 16. 50 100 150 200 250 300 R ea ct io n Ti m e Alcohol No Alcohol Slide 15 Transcript Since factorial designs involve two or more independent variables, researchers want to be able to assess the effects of each one separately as well as how they interact with each other. When doing factorial designs there are two classes of effects to understand – main effects and interactions. There is the
- 17. possibility of a main effect associated with each factor and there is the possibility of an interaction associated with each relationship among the factors. The main differences among the levels of one factor are called the main effect of that factor. A simple way to examine for main effects and interactions is by graphing the cell means. A main effect would be an overall difference among levels of a particular factor that is consistent across the levels of another factor. After all, that is what the researchers are looking for – some indication that the independent variable was making a difference somewhere. Once a main effect is identified, the next step is to determine if it is significant. To do this, the statistic commonly used is the two- way analysis of variance. Note that calculations for a factorial design are different from just a mathematical approach where the overall difference may exist but is not consistent. An interaction between factors occurs whenever the mean differences between individual treatment conditions, or cells, are different from what is predicted from the overall main effect of the factors. When the effects of one factor depend on the different levels of a second factor, then there is an interaction between the factors. When the results of a two-factor study are graphed, the existence of nonparallel lines (lines that cross or converge) is an indication of an interaction between the two factors and where that interaction occurs. This is shown here using a graph from the textbook. An interaction is identified from cell means at levels of a factor that change across levels of another factor. When the combined levels of the two factors vary significantly an interaction is noted. Examining Multiple Factors
- 18. Initial research may indicate interaction of variables Advantages of multiple factor designs (factorials) 1. Testing several hypotheses simultaneously 2. One experiment to address several complex questions 3. Reveals difference where variables interact simultaneously 4. When variables cannot be controlled 5. Assign variables removes threat to internal validity Slide 17 Transcript Seldom in natural settings would you find just one variable influencing everything. More than likely there are several factors or variables that are influencing each other in many different ways and degrees. Fortunately, there are several advantages of factorial designs over classical experimental designs. As we discovered earlier, initial research results may indicate the need to examine multiple variables interacting. So, some advantages of factorial designs are that they permit testing of several hypotheses simultaneously, rather than having to conduct a series of single variable experiments. Second, they permit the conduct of only one experiment to address several complex questions at once. Third, where interaction between two or more variables simultaneously makes a difference, it reveals this difference. Fourth, it can be performed where control of all
- 19. variables, but one is impractical or impossible. And fifth, by adding more variables many of the threats to internal validity can be neutralized. Higher Order Factorial Designs Applies to designs with 3 or more factors (variables) Fractional factorial design Subsets of full factorial Observe over time Each added factor increases number of participants required Reducing sample size decreases representativeness Interactions become difficult to interpret More complex factorials e.g., cubic As number of factors increase, so do main effects Slide 19 Transcript The basic concepts of a two- factor research design can be
- 20. extended to more complex designs involving three or more factors; such designs are referred to as higher- order factorial designs. Theoretically, a researcher could simultaneously investigate 10 or more factors at the same time, but it is rare to go beyond 3 or even 4 because each additional factor increases the number of participants needed to complete the study. Reducing the number of participants in each cell doesn’t help because as sample size decreases, so does representativeness. Also, interactions involving many factors are difficult to interpret. As the number of factors increases in the design, so too do the number of main effects. Particularly when the factors reach four or more, it becomes difficult to understand just what is influencing results and the relationships among all the factors. So far, what has been covered are full factorials that measure all combinations of the factor levels. As the number of factors increases with higher order designs, an approach known as fractional factorial design can be applied. A fractional design is one where experimenters conduct only a selected subset or fraction of the runs in the full factorial design. Basically, the researcher will identify which interactions to isolate, and construct a block design for studying the confounding main effects of the selected factors. And then, there are the cubic factorials. The designs for such higher order factorial studies can become exceptionally complex and we need not go into further details about them now. With this module we conclude the overview of experimental designs. Next, we will figure out how to analyze the data from our various research methodologies. Until then, have a productive and healthy week. Blank PageBlank PageBlank PageBlank PageBlank PageBlank PageBlank PageBlank PageBlank PageBlank Page
- 21. · 7.2 Lecture: More Experimental Designs: Within-subjects and Factorials View the presentation and listen to the explanations offered. When completed, reflect on the presentation and write a brief statement that describes what you found to be an important aspect of the information and how that might help you with your research process. · Must demonstrate understanding of the task. · Must be able to illustrate critical thinking and the ability to express an opinion on the covered material constructively. · Grading will reflect whether the assignment has been completed satisfactorily.