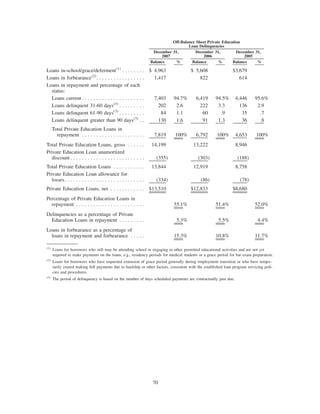
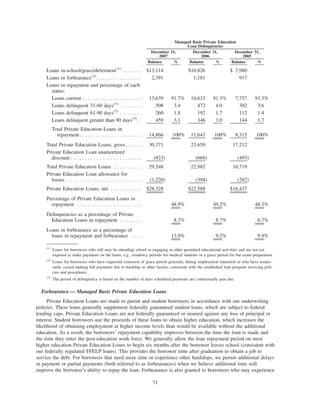
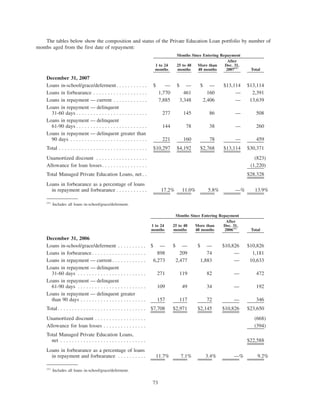
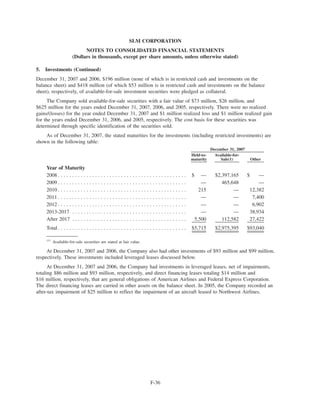
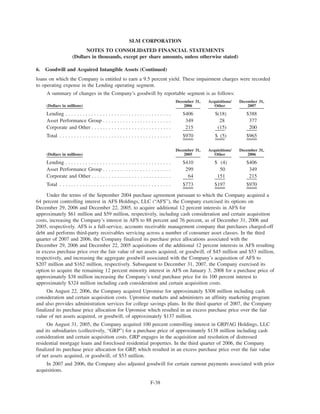
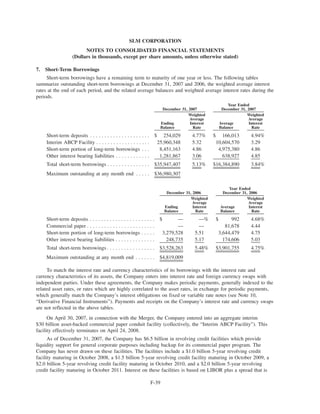
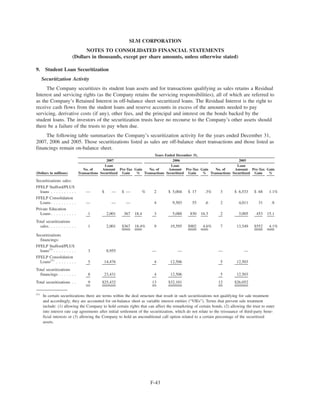
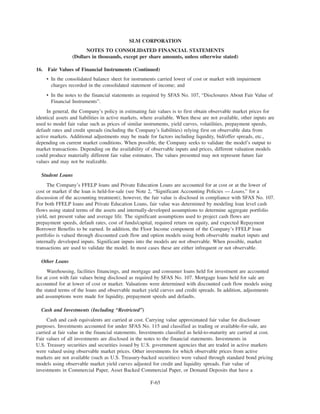
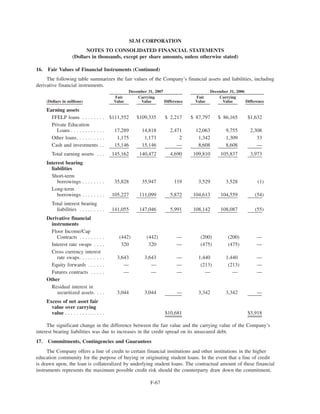
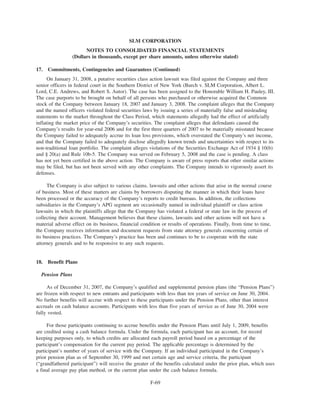
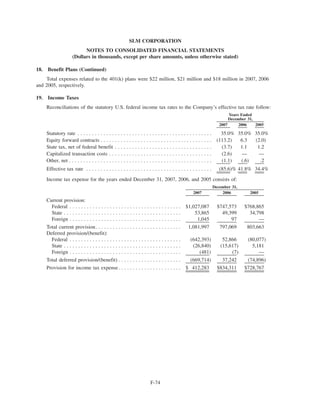
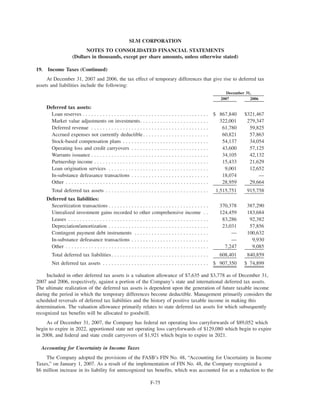
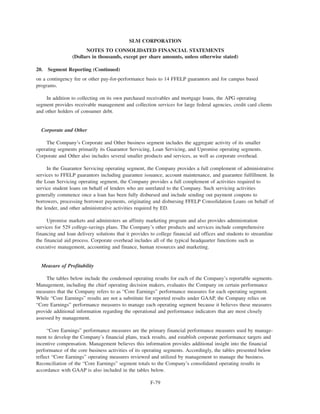
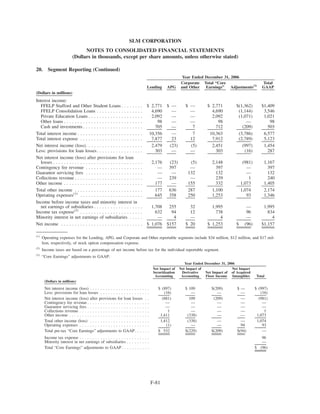
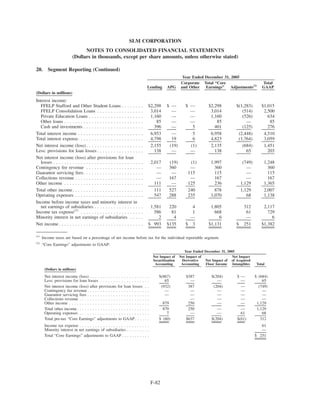
This document is SLM Corporation's annual report on Form 10-K filed with the United States Securities and Exchange Commission for the fiscal year ended December 31, 2007. It provides information on SLM Corporation's business, operations, financial results, subsidiaries, legal proceedings, risks and other disclosures required by the SEC. Specifically, the document includes SLM Corporation's audited financial statements, discusses its student loan portfolio and business segments, discloses legal and regulatory risks, and incorporates portions of its proxy statement by reference.
This document is SLM Corporation's (Sallie Mae) annual report filed with the SEC on Form 10-K. It summarizes Sallie Mae's business operations, including that it originates, services, and collects federal and private student loans. It also discusses recent legislative and market developments that have impacted Sallie Mae's business, including reduced funding access and higher costs due to capital market disruptions, as well as new government programs to support student lending.
This document is SLM Corporation's (Sallie Mae) annual report (Form 10-K) filed with the SEC for the fiscal year ending December 31, 2006. It includes information such as a list of securities registered with exchanges and disclosure of Sallie Mae's status as a large accelerated filer. In addition, it provides definitions for terms used throughout the report related to Sallie Mae's operations involving federal student loans.
This document is SLM Corporation's annual report on Form 10-K filed with the SEC for the fiscal year ended December 31, 2005. It provides an overview of SLM Corporation's business, including that it operates the Sallie Mae student loan business and services federal student loans. It also lists risks to SLM's business from changes to the student loan industry and market conditions. In addition, the document defines various terms used throughout the report related to federal student loans and SLM's business.
This document is SLM Corporation's annual report (Form 10-K) filed with the SEC for the fiscal year ended December 31, 2002. It provides information on SLM's business operations, including that it is the largest holder and servicer of Federal Family Education Loan Program (FFELP) student loans, managing $79 billion in student loans. It discusses the student lending marketplace and trends driving growth, including rising tuition costs and the growing number of students relying on education loans. The report also outlines key terms and programs related to SLM's student lending business.
First American sent its shareholders its 2007 Form 10-K and amendment instead of the annual report and proxy materials. The company's board will set a date for the annual shareholder meeting where proxy materials and a summary annual report will be provided. First American is separating its Financial Services and Information Solutions businesses into two independent publicly traded companies and will provide updates on its website and SEC filings.
This document is SLM Corporation's annual report (Form 10-K) filed with the SEC for the fiscal year ending December 31, 2004. It provides an overview of SLM Corporation's business operations, financial results, risks, and other disclosures required by the SEC. Key details include that SLM Corporation operates in the student loan industry, primarily originating and servicing Federal Family Education Loan Program loans. It also discusses various loan types, income sources such as floor income, and risk factors that could impact financial performance.
This document is Dollar General Corporation's annual report (Form 10-K) filed with the SEC for the fiscal year ended February 2, 2007. It summarizes Dollar General's business operations, including that it operates discount retail stores offering consumable merchandise. It also announces that Dollar General entered into an agreement to be acquired by affiliates of Kohlberg Kravis Roberts & Co. in a deal valued at $22 per share. The report provides an overview of Dollar General's strategic initiatives, growth strategies, and risks to its business.
This document is SLM Corporation's (Sallie Mae) annual report (Form 10-K) filed with the SEC for the fiscal year ending December 31, 2003. It provides an overview of Sallie Mae's business operations, including that it is a leading provider of education financing through federal and private student loans. It also defines various key terms related to student loans and financing. The report notes Sallie Mae is nearing completion of its privatization process from its original role as a government-sponsored enterprise, and now offers a range of credit and related services to support access to higher education.
This document is Dover Corporation's annual report on Form 10-K for the fiscal year ending December 31, 2002 filed with the United States Securities and Exchange Commission. It provides an overview of Dover's business strategy, management philosophy, acquisition and divestiture activities, and descriptions of its four business segments and their operating companies. Dover is a diversified industrial manufacturing company comprised of about 50 operating companies that manufacture specialized industrial products and equipment.
This Form 10-K was filed by Southwestern Public Service Co. (SPS) as a wholly owned subsidiary of Xcel Energy Inc. It provides an overview of SPS's electric utility operations, including its focus on growing its rate base to meet customer demand. SPS serves parts of Texas and New Mexico. Key regulatory developments discussed include the repeal of PUHCA, mandatory reliability standards established by the Energy Policy Act of 2005, and FERC rulemakings implementing various aspects of the Act.
- Dollar General Corp is the largest discount retailer in the US with nearly 10,000 stores primarily in the southern and midwestern US.
- It offers consumable goods, seasonal items, home products, and apparel at everyday low prices of typically $10 or less through its small-box stores.
- The company sees opportunities to continue growing same-store sales, expanding operating profit margins, and growing its store base to potentially more than double its current size.
This document is a Form 10-K annual report filed by Southwestern Public Service Company (SPS) with the Securities and Exchange Commission for the fiscal year ending December 31, 2005. SPS is an electric utility engaged in generation, transmission, distribution and sale of electricity primarily in Texas and New Mexico. It serves approximately 395,000 customers. In 2005, SPS reached an agreement to sell portions of its operations in Oklahoma, Kansas and Texas. SPS is a wholly owned subsidiary of Xcel Energy, a public utility holding company. The report provides an overview of SPS's operations and discusses recent regulatory developments affecting the electric utility industry.
2008 annual Report for PROS Holdings Inc. (NYSE:PRO)
PROS is a leading provider of prescriptive pricing and revenue management software for companies in the manufacturing, distribution, services and travel industries. PROS gives customers far greater confidence and agility in their pricing strategies by providing data-driven insights into transaction profitability, forecasting demand, recommending optimal prices for each product and deal, and streamlining pricing processes with enhanced controls and compliance. With $468 billion in revenues under management, PROS has implemented more than 500 solutions in more than 50 countries. The PROS team comprises more than 500 professionals, including 100 with advanced degrees and 25 with Ph.D.s.
StockTwits - http://stocktwits.com/PROSHoldings
Twitter - http://twitter.com/#!/mattbal4
IR Website - http://phx.corporate-ir.net/phoenix.zhtml?c=211158&p=irol-irhome
Corporate Blog - http://www.pricingleadership.com/
The document is a Form 8-K filed by Realogy Corporation with the SEC providing information on its plan to issue $500 million in second lien secured term loans ("Second Lien Incremental Term Loans") to refinance some of its existing notes. It summarizes key terms of the Second Lien Incremental Term Loans including interest rates ranging from 13-15% and 14-19.5% depending on the type of loan. It also provides pro forma financial information showing the estimated impact on its cash, debt and interest expense if it issues $385 million of the Second Lien Incremental Term Loans.
This document is the annual report (Form 10-K) filed by Crown Crafts, Inc. for the fiscal year ending March 29, 2009. Crown Crafts operates in the infant and toddler products industry through its subsidiaries. It designs, markets, and distributes crib and toddler bedding, bibs, soft goods, and accessories. The company relies on foreign manufacturers, primarily in China, and sells products to major retailers in the US and other countries. In fiscal year 2009, Wal-Mart and Toys R Us each represented over 10% of the company's gross sales.
This document is a Form 10-K annual report filed by Southwestern Public Service Company (SPS) with the Securities and Exchange Commission for the fiscal year ending December 31, 2004. SPS is an electric utility company that generates, transmits, and distributes electricity to customers in parts of Texas, New Mexico, Oklahoma and Kansas. The report provides an overview of SPS's operations and discusses recent regulatory developments affecting the electric utility industry, including SPS's authority to sell electricity at market-based rates set by the Federal Energy Regulatory Commission. It also lists various risk factors and discusses SPS's generation assets, fuel supply, customers, sales volumes and environmental matters.
This document is Toll Brothers, Inc.'s annual report (Form 10-K) filed with the SEC for the fiscal year ended October 31, 2008. It provides information on Toll Brothers' business operations, including that it designs and builds single-family homes and luxury residential communities in 21 U.S. states. In the past 5 years it has delivered over 35,000 homes. However, since 2005 it has experienced a slowdown in business due to factors like the economic downturn, housing market decline, and credit crunch. The report provides details on Toll Brothers' operations and the risks and challenges currently facing its industry and business.
This document is Xcel Energy Inc.'s annual report (Form 10-K) filed with the Securities and Exchange Commission for the fiscal year ending December 31, 2001. It provides an overview of the company's electric and gas utility operations in multiple US states, discusses regulatory issues, reports operating statistics, and summarizes subsidiaries including NRG Energy and e prime. The report is intended to comply with SEC reporting requirements and provide comprehensive information on the company's business and performance to investors.
Masco Corporation entered into a new $2 billion 5-year revolving credit agreement with various banks. The new agreement replaces two previous credit facilities that had expired or been terminated. The new agreement provides Masco with an unsecured revolving credit facility available in U.S. dollars and euros. It contains customary terms including financial covenants and events of default. Masco also restated its financial statements for 2001-2003 to separately report certain European businesses that it plans to sell as discontinued operations.
This document is Micron Technology's annual report on Form 10-K for the fiscal year ended August 28, 2008. It provides an overview of Micron's business operations, products, manufacturing facilities, and financial performance. Specifically, it summarizes that Micron is a global manufacturer of DRAM and NAND memory chips as well as image sensors. It faced significant challenges in 2008 from falling memory prices. In response, Micron announced a restructuring plan to cut costs and reduce its workforce. The report provides details on Micron's memory and image sensor products, manufacturing facilities, joint ventures with other companies, and financial results for fiscal year 2008.
Clear Channel Communications entered into an agreement to be acquired by private equity firms affiliated with Thomas H. Lee Partners and Bain Capital Partners. Under the terms of the agreement, shareholders will receive $37.60 per share in cash. The agreement includes provisions allowing Clear Channel to solicit other bids until certain dates and requires Clear Channel to pay termination fees to the buyers under certain circumstances. The employment agreements of key executives were also amended in connection with the transaction.
This document is Starbucks' annual report on Form 10-K for the fiscal year ended October 1, 2006. It provides information on Starbucks' business segments, which were reorganized in fiscal 2006 to include three segments: United States, International, and Global Consumer Products Group. The report also discloses that 85% of Starbucks' revenue comes from company-operated retail stores, while the remaining 15% comes from specialty operations such as licensed retail stores, grocery/warehouse club sales, and other initiatives.
Sallie Mae is the leading provider of education funding in the U.S., helping millions access college. In 2003, Sallie Mae had record loan origination and fee income growth from debt management. It is nearing full privatization from the government-sponsored enterprise program. The company provides a range of education loan, servicing, and debt collection products and services to help students and families at every stage of the education financing process.
Tenet Healthcare reported strong operating results for Q4 2008 despite challenges from the weak economy. Same hospital metrics like admissions, outpatient visits, and revenues improved. However, the stock price declined sharply in Q4. Tenet has taken actions to improve physician recruitment and quality of care. For 2009, Tenet expects adjusted EBITDA in the range of $735 million to $800 million, flat to 9% growth over 2008. Tenet will focus on managing volumes, costs, and capital expenditures prudently given economic uncertainties. Physician recruitment exceeded targets and new physicians are contributing to volume growth. Cost control was strong in Q4 and pay-for-performance programs will provide $7 million in new revenues. Ten
This document is KBR's 2007 Annual Report. It discusses KBR's positioning for growth after separating from Halliburton. Key points include:
- KBR restructured into six business units to better serve customers and capture market opportunities. The business units are seeing success with new contract awards.
- KBR delivered record financial performance in 2007 while also transitioning to an independent company and positioning itself for future growth. Income increased 177% and net income set an all-time record.
- Moving forward, KBR aims to leverage its expertise and capabilities to strengthen customer relationships, continue improving risk management, and create shareholder value through stable, predictable growth across its business units.
Trevor Fetter, President and CEO of Tenet Healthcare, discusses Tenet's strategy for progress and growth. He outlines that Tenet's culture and values are driving measurable improvements in operations, performance, and innovation. Key points include that same hospital adjusted EBITDA and margins have been expanding, volume trends are favorable, pricing growth has been strong, and they have effectively contained cost growth. Fetter also discusses strategic initiatives proving effective in quality, targeted growth, physician relationships, and capital investment. He believes Tenet has reached an "inflection point" in its turnaround over the past 12-18 months.
The document provides a summary of a conference call discussing Tenet Healthcare Corporation's financial results for Q4 2008.
1) Tenet reported strong operating results for Q4 2008, with improvements in same-hospital volumes, revenues, and profits. However, Tenet's stock price declined sharply in Q4.
2) Despite economic uncertainties, the speaker remains optimistic about Tenet's business fundamentals due to progress in physician recruitment, outpatient business stabilization, growth in targeted service lines, and quality achievements.
3) Tenet expects its 2009 adjusted EBITDA to range from $735 million to $800 million, either flat or up 9% from 2008, due to uncertainties around volumes, payor
pulte homes BCF65EEF-0BFE-4C58-8C84-345ECA968DBA_phm_Q42008WebcastSlidesfinance42
- Pulte maintained its strategic focus on strengthening its balance sheet in 4Q 2008 as market conditions deteriorated, increasing cash by $500M to $1.655B despite a $42M reduction in overhead costs and lowering lots under control by 23% to 121,000 units.
- 4Q 2008 revenue fell 43% to $1.7B and pre-tax loss was $479.7M compared to a $453.8M loss in 4Q 2007, with a net loss per share of $1.33 versus $3.46 in the prior year.
- Inventory and land-related impairment charges were $380M in 4Q 2008, with backlog falling to 2,174
dana holdings NominatingCommitteeCharter_013108finance42
The Nominating and Corporate Governance Committee Charter establishes the purpose, composition, duties, and responsibilities of Dana Holding Corporation's Nominating and Corporate Governance Committee. The Committee is responsible for identifying and recommending new board members, evaluating current directors, overseeing corporate governance policies and board evaluations, and ensuring compliance with regulatory governance requirements. The Committee is composed of at least three independent directors and meets as frequently as needed to fulfill its responsibilities of identifying qualified board candidates, developing governance policies, and advising the board on succession planning and compensation matters.
This document outlines the bylaws of Dana Holding Corporation. It discusses various topics related to stockholder meetings (including time/place of meetings, annual/special meetings, notice requirements, quorum, voting), the board of directors (including number, vacancies, committees), notices, officers, stock, and general provisions. Key details include requirements for stockholder proposals and nominations (notice must be given no earlier than 120 days and no later than 90 days before the anniversary of the prior year's annual meeting) and provisions regarding the order of business and conduct at stockholder meetings.
Terex Corporation is one of the largest manufacturers of construction equipment in the world. It has a diverse portfolio balanced across different construction product categories and geographies. Terex Construction is currently undergoing process improvements and restructuring to optimize costs and margins as North American and Western European markets have softened. However, emerging markets continue to see strong growth and present opportunities. Terex Construction's goals are to achieve $12 billion in sales and 12% operating margins by 2010 through initiatives in supply chain efficiency, pricing discipline, and acquisitions integration.
The document outlines standards of business conduct for members of the Dana Holding Corporation board of directors. It discusses avoiding conflicts of interest, maintaining confidentiality, complying with laws and regulations, and encouraging ethical behavior. Directors must disclose any conflicts, not take corporate opportunities for personal gain, and obtain approval before accepting gifts from entities doing business with the company. Any violations of the standards should be reported to the board chairman or governance committee chair. Waivers can only be granted by the governance committee or full board.
The IT department at Tenet Healthcare remains focused on supporting key business objectives such as improving clinical outcomes, growing patient volumes, recruiting and retaining staff, and improving cost metrics through initiatives like expanding clinical systems, developing consumer tools, and streamlining registration processes to enhance the patient experience. IT also aims to deliver effective technologies at a lower cost than peers through standardization, outsourcing, and leveraging centralized expertise.
Tenet Healthcare Corporation reported financial results for the fourth quarter of 2007 with improvements over the prior year. Net loss narrowed to $75 million compared to $386 million in the prior year. Same-hospital adjusted EBITDA increased 9.8% to $168 million. Admissions increased 0.1% with growth in managed care admissions, while outpatient visits declined 1.4%. Tenet provided guidance for 2008 of adjusted EBITDA between $775-850 million and earnings per share between negative 3 cents to positive 6 cents.
dana holdings AuditCommitteeCharter_013108finance42
The Audit Committee Charter establishes the purpose, composition, and duties of Dana Holding Corporation's Audit Committee. The Audit Committee is responsible for overseeing the company's financial reporting and audit process. It is tasked with retaining independent auditors, overseeing their work, and reviewing Dana Holding's financial statements, disclosure controls and procedures, and risk management practices. The Committee is also responsible for establishing procedures for complaints regarding financial reporting or accounting policies.
- The document is the transcript from a Q2 2008 earnings call for a healthcare company.
- Key highlights included 2.2% same-hospital admission growth and improving trends in volumes, pricing, and expenses.
- Management discussed strategies around physician relationships and service lines that are helping to increase commercial and total admissions.
This document is Tenet Healthcare Corporation's annual report on Form 10-K for the fiscal year ended December 31, 2008. It provides information on Tenet's business operations, including that it operates 53 general hospitals and other healthcare facilities across 12 states. It lists the hospitals by region and state, and describes the services offered and accreditations. The report also discusses Tenet's strategies, recent facility acquisitions, divestitures and openings, and factors that affect its operating results.
This document is Tenet Healthcare Corporation's quarterly report filed with the SEC for the quarter ended September 30, 2003. It includes their consolidated balance sheets as of December 31, 2002 and September 30, 2003, consolidated statements of operations for the quarters and year-to-date periods ended September 30, 2002 and 2003, and consolidated statements of cash flows for the year-to-date periods ended September 30, 2002 and 2003.
Terex Corporation provides forward-looking statements and non-GAAP measures in their presentation. Their purpose is to improve people's lives around the world through their construction equipment. Their mission is to delight customers with high-quality products and services that exceed expectations. Their vision is to be the most customer-responsive, profitable, and desirable place for employees to work in the industry. Terex has a strong and diversified revenue base globally, with income and sales growing substantially in recent years. They are the third largest construction equipment manufacturer in the world, with over 75% of sales where they have a strong market presence.
This document is a notice and proxy statement for USA Education Inc.'s 2001 annual meeting of shareholders. It notifies shareholders that the meeting will be held on May 10, 2001 to elect directors, vote on increasing authorized shares of common stock, ratify auditors, and conduct other business. It provides information about each item of business, the board of directors, executive compensation, and share ownership. Shareholders are urged to vote by proxy to establish a quorum for the meeting.
- The document is a letter from the Chairman and CEO of First American Corporation to shareholders updating them on the company's annual report and proxy materials for 2007.
- Instead of sending a traditional annual report and proxy statement, the company is sending its 2007 Form 10-K and amendment, which includes most of the information that would be in the proxy statement.
- The annual shareholder meeting date has not yet been set, but once it is, shareholders will receive proxy materials and a summary annual report highlighting the company's financial performance and changes ahead.
URS Corporation filed its annual report on Form 10-K for the fiscal year ended December 28, 2007. The filing includes information on the company's business segments, clients served, services provided, and markets addressed. It also provides consolidated financial statements and notes to the financial statements.
This document is an annual report filed by URS Corporation that provides an overview of the company's business for the past year. It discusses the company's clients, services, markets, and financial information. URS operates through two divisions, providing engineering and construction services, as well as systems engineering and technical assistance services primarily to US federal government agencies like the Departments of Defense and Homeland Security. The report provides details on the company's revenues, services, and markets by client type, including federal government, state and local government, private industry, and international clients.
This document is a Form 10-K annual report filed by Genworth Financial, Inc. with the U.S. Securities and Exchange Commission for the fiscal year ended December 31, 2005. It provides an overview of Genworth's business operations, financial results, risks, and other disclosures. Specifically, it summarizes that Genworth has three business segments: Protection, Retirement Income and Investments, and Mortgage Insurance. It reports the net earnings for 2005 of each segment and provides other selected financial information for Genworth as of December 31, 2005.
This document is Genworth Financial's annual report on Form 10-K filed with the SEC for the fiscal year ended December 31, 2005. It includes information such as an overview of Genworth's business operations, financial results, risks factors, legal proceedings, management's discussion and analysis of the financial statements, and the financial statements. Genworth provides insurance, investment and mortgage insurance products and services. For 2005, its Protection segment was the leading provider of individual long-term care insurance and term life insurance in the U.S. Its Retirement and Investments segment offers annuities and asset management products.
Toll Brothers, Inc. filed its annual report on Form 10-K with the SEC for the fiscal year ended October 31, 2007. The filing provides information on Toll Brothers' business operations, financial performance, risk factors, and audited financial statements. Specifically, the filing discloses that Toll Brothers designs, builds, and finances luxury single and attached homes across 22 states in the United States. It operates 368 communities containing over 27,000 home sites. Toll Brothers experienced a slowdown in demand beginning in late 2005 due to housing market conditions. The filing provides details on Toll Brothers' revenues, backlog, home prices, geographic presence, and business strategy to manage risks.
Craftmade International Inc. filed its annual report on Form 10-K for the fiscal year ended June 30, 2009. The report discusses the company's two segments - Specialty and Mass - which have been impacted by the economic downturn and decline in housing. In January 2008, the company acquired certain assets of Woodard, LLC, expanding its outdoor furniture offerings. Lowe's remains its largest customer although there are no long-term contracts. The report provides an overview of the company's business operations and financial information.
UNITED STATES SECURITIES AND EXCHANGE COMMISSION Was.docxouldparis
UNITED STATES
SECURITIES AND EXCHANGE COMMISSION
Washington, D.C. 20549
FORM 10-K
ANNUAL REPORT PURSUANT TO SECTION 13 OR 15(d)
OF THE SECURITIES EXCHANGE ACT OF 1934
For the Fiscal Year Ended December 31, 2018
Commission File Number 001-33401
CINEMARK HOLDINGS, INC
(Exact Name of Registrant as Specified in its Charter)
Delaware 20-5490327
(State or other jurisdiction
of incorporation or organization)
(I.R.S. Employer
Identification No.)
3900 Dallas Parkway
Suite 500 Plano, Texas 75093
(Address of principal executive offices) (Zip Code)
Registrant’s telephone number, including area code: (972) 665-1000
Securities registered pursuant to Section 12(b) of the Act:
Title of each class Name of each exchange on which registered
Common Stock, par value $0.001 per share New York Stock Exchange
Securities registered pursuant to Section 12(g) of the Act:
None
Indicate by check mark if the registrant is a well-known seasoned issuer, as defined in Rule 405 of the Securities Act. Yes ☒ No ☐
Indicate by check mark if the registrant is not required to file reports pursuant to Section 13 or Section 15 (d) of the Act. Yes ☐ No ☒
Indicate by check mark whether the registrant (1) has filed all reports required to be filed by Section 13 or 15(d) of the Se curities Exchange Act of 1934 during the
preceding 12 months (or for such shorter period that the registrant was required to file such reports), and (2) has been subject to such filing requirements for the past 90
days. Yes ☒ No ☐
Indicate by check mark whether the registrant has submitted electronically every Interactive Data File required to be submitted pursuant to Rule 405 of Regulation S-T
(§232.405 of this chapter) during the preceding 12 months (or for such shorter period that the registrant was required to submit such files). Yes ☒ No ☐
Indicate by check mark if disclosure of delinquent filers pursuant to Item 405 of Regulation S-K (§229.405 of this chapter) is not contained herein, and will not be
contained, to the best of registrant’s knowledge, in definitive proxy or information statements incorporated by reference in Part III of this Form 10-K or any amendment
to this Form 10-K. ☒
Indicate by check mark whether the registrant is a large accelerated filer, an accelerated filer, a non-accelerated filer, a smaller reporting company, or emerging growth
company. See the definitions of “large accelerated filer,” “accelerated filer,” “smaller reporting company,” and "emerging growth company" in Rule 12b-2 of the
Exchange Act.
Large accelerated filer ☒ Accelerated filer ☐
Non-accelerated filer ☐ Smaller reporting company ☐
Emerging growth company ☐
If an emerging growth company, indicate by check mark if the registrant has elected not to use the extended transition period for complying with any new or revised
financial accounting standards provided pursuant to Section 13 (a) of the Exchange Act. ☐ ...
This Form 10-K was filed by Southwestern Public Service Co. (SPS) as a wholly owned subsidiary of Xcel Energy Inc. It provides an overview of SPS's electric utility operations, including its focus on growing its rate base to meet customer demand. SPS serves parts of Texas and New Mexico. Key regulatory developments discussed include the repeal of PUHCA, mandatory reliability standards established by the Energy Policy Act of 2005, and FERC rulemakings implementing various aspects of the Act.
This document is C.H. Robinson Worldwide's annual report (Form 10-K) filed with the SEC for the year ended December 31, 2007. It provides an overview of the company's business operations, including that it is a non-asset based third party logistics provider offering freight transportation and logistics services through a network of 218 offices worldwide. The report describes C.H. Robinson's main business lines of multimodal transportation services, fresh produce sourcing, and information services. It provides details on the types of transportation it arranges and its relationships with over 48,000 transportation providers.
YRC Worldwide Inc.'s 2007 annual report discusses challenges faced in 2007 including a soft economy and disappointing performance from some operating units. The report also discusses organizational changes made to improve performance, including consolidating several companies under a new organization called YRC National Transportation and implementing a new five-year labor agreement. Finally, the report discusses focusing on cost management and capitalizing on growth areas of the business until the economy begins to recover.
This annual report summarizes Celanese Corporation's performance in 2006. It discusses Celanese's vision to become the premier chemical company through safety, growth, and value. In 2006, Celanese continued executing its transformation strategy through acquisitions that strengthened its global position and cost improvements. The report outlines Celanese's six-point strategy for 2007-2009 focusing on expansion in Asia, revitalization, innovation, organic growth, maintaining a strong balance sheet, and operational excellence.
This annual report summarizes Celanese Corporation's performance in 2006. It discusses Celanese's vision to become the premier chemical company through operational excellence, sustainable earnings growth, and value creation. In 2006, Celanese continued executing its transformation strategy through acquisitions that strengthened its global position and cost improvements that increased productivity. The report outlines Celanese's six-point strategy for the next three years, focusing on expansion in Asia, revitalization of businesses, innovation, organic growth, maintaining a strong balance sheet, and achieving operational excellence.
This document is Starwood Hotels & Resorts Worldwide, Inc.'s annual report for 2005 filed with the Securities and Exchange Commission (SEC). It discusses Starwood's business operations, properties, legal proceedings, executive officers, market for common stock, selected financial data, management discussion/analysis of financial results, controls and procedures, directors and executive compensation, security ownership, and related party transactions.
This document is Dover Corporation's annual report (Form 10-K) filed with the SEC for the fiscal year ending December 31, 2006. It provides an overview of Dover's business operations, reporting segments, management structure, acquisition strategy, and key financial data for fiscal year 2006. Dover operates through six business segments that manufacture specialized industrial products and equipment. It pursues a decentralized management approach and acquisition strategy focused on niche market leaders.
This document is Visteon Corporation's annual report on Form 10-K for the fiscal year ending December 31, 2005 filed with the United States Securities and Exchange Commission. It provides an overview of Visteon's business operations, financial statements, legal proceedings, risks factors, and other required disclosures. Key details include that Visteon is an automotive supplier incorporated in Delaware whose common stock is traded on the New York Stock Exchange. Financial statements and notes are provided for the fiscal year ending December 31, 2005 as reviewed by an independent accounting firm. Executive officers and information on controls and procedures are also summarized.
This document is a Form 10-K filing for CC Media Holdings, Inc. for the fiscal year ended December 31, 2008. It provides information on CC Media's business segments, which include Radio Broadcasting, Americas Outdoor Advertising, and International Outdoor Advertising. It discusses CC Media's acquisition of Clear Channel Communications in July 2008, and CC Media's restructuring efforts in response to declining advertising revenues. The filing also provides select financial data and details of CC Media's radio station portfolio.
The document is a Form 8-K filed by Realogy Corporation with the SEC providing information on its plan to issue $500 million in second lien secured term loans ("Second Lien Incremental Term Loans") to refinance some of its existing debt. It summarizes key terms of the Second Lien Incremental Term Loans including interest rates ranging from 13-15% and 14-19.5% depending on the type of loan. It also provides pro forma financial information showing the estimated impact on its cash, debt and interest expense if it issues $385 million of the Second Lien Incremental Term Loans.
Celanese Corporation has pursued a strategy of growth, performance, and execution over the past eight years. This strategy has improved the stability and strength of the company and enabled it to achieve strong cash generation and industry leadership in its diverse portfolio of specialty businesses. Celanese has consistently executed against four strategic pillars: participating in businesses with sustainable competitive advantages, leveraging advantaged positions, aligning with customers, and divesting non-core assets. Through relentless execution, Celanese has exceeded its growth objectives and is on track to expand its portfolio's earnings power beyond original plans. Celanese is pursuing continued growth opportunities to deliver more stable earnings growth.
Similar to slm 200710KBOW49222BOW014_BITS_NFeb292008 (20)
SAIC's employees are dedicated to delivering innovative solutions to support clients worldwide, particularly those on the front lines of homeland security and the war in Iraq. The document discusses several ways SAIC supports homeland security, including through emergency preparedness and response training, securing borders and transportation, and responding to nuclear, biological, and chemical threats. SAIC has extensive experience supporting government agencies and was chosen to integrate the new Department of Homeland Security's data network.
This document provides a 3-page annual report for SAIC, a technology and engineering company, for their 35th anniversary in 2004. It summarizes SAIC's history and accomplishments over 35 years, including helping analyze nuclear weapons, undertaking projects in nuclear energy and healthcare, and solving difficult problems for customers in many fields. It discusses SAIC's continued commitment to employee ownership and customer focus. The message to stockholders outlines SAIC's strategies under new CEO Ken Dahlberg to better serve customers, recommit to traditional values, and drive continued growth, including reorganizing into fewer customer-focused units and setting a goal to double the company's value in 5 years.
SAIC delivered strong financial and technical performance in fiscal year 2005. Revenues increased 23% to $7.2 billion and operating income rose 24%. SAIC won many new contracts and saw record contract awards and backlog. Going forward, SAIC aims to capture larger systems integration contracts while maintaining an entrepreneurial culture and pursuing new opportunities in areas like digital oilfield technology. SAIC also seeks to strengthen workforce diversity and development.
The document is SAIC's annual report for fiscal year 2006. It summarizes SAIC's financial performance for the year, highlighting increased revenues of $7.8 billion, net income of $927 million, and diluted earnings per share of $5.15. It also outlines SAIC's strategic business areas of homeland security, intelligence solutions, defense transformation, logistics and transportation, systems engineering and integration, and research and development. The report discusses SAIC's response to hurricanes Katrina and Rita and its commitment to customers, employees, and shareholders.
SAIC provides technical solutions and operational support to government agencies and commercial customers in key areas such as homeland security, intelligence, defense, logistics, and IT. In fiscal year 2007, SAIC achieved revenue growth of 7% and operating income growth of 19% while making strategic acquisitions to expand capabilities. SAIC is committed to executing strategies to accelerate organic growth, expand operating margins, and make additional strategic acquisitions.
1) SAIC achieved strong financial results in FY2008, with revenues of $8.94 billion, up 11% from FY2007, and operating income of $666 million, up 16% from the previous year.
2) SAIC completed strategic acquisitions to expand in energy, infrastructure, and environment areas and appointed a new COO, Larry Prior, to lead organizational transition efforts.
3) Project Alignment is a major multi-year initiative to improve performance by integrating HR, finance, IT and other functions into a shared services model across the company.
The document provides an overview of Terex Corporation for a May 2008 investor conference. It discusses Terex's purpose, mission, and vision. It summarizes Terex's sales, operating profit, and geographic diversity for 2007. It also outlines goals to achieve $12 billion in sales and 12% operating margin by 2010. Finally, it discusses opportunities to improve margins through pricing actions, supply management, productivity initiatives, and The Terex Way values.
The document provides an overview of Terex Corporation and its business segments for an investor conference. It summarizes that Terex has a diversified portfolio across industries and geographies that provides balance through economic cycles. It also outlines opportunities to improve margins through pricing actions, supply management initiatives, and productivity improvements. The goal is to achieve $12 billion in sales and a 12% operating margin by 2010.
The document provides an overview of Terex Corporation for a Merrill Lynch conference. It discusses Terex's purpose, mission, and vision. It also summarizes Terex's diversified business segments and product lines, with aerial work platforms, construction equipment, cranes, material processing and mining equipment being the largest segments. The document outlines Terex's goals for 2010 of achieving $12 billion in sales and 12% operating margins.
The document provides an overview of Terex Corporation from its Basics Industrials Conference presentation on May 8, 2008. It discusses Terex's purpose, mission, and vision. It highlights Terex's strong and diversified revenue base, with income from operations increasing 36% in 2007 and 28% in Q1 2008. It outlines Terex's goals for 2010 of $12 billion in sales and 12% operating margin. The document also provides an overview of each of Terex's business segments.
Terex Corporation provides forward-looking statements and non-GAAP measures in their presentation. Their purpose is to improve people's lives around the world through their construction equipment. Their mission is to delight customers with high-quality products and services that exceed expectations. Their vision is to be the most customer-responsive, profitable, and desirable place for employees to work in the industry. Terex has a strong and diversified revenue base globally, with income and sales growing significantly in recent years. They are the 3rd largest construction equipment manufacturer in the world, with over 75% of sales where they have a strong market presence.
The annual shareholder meeting presentation covered the following key points in 3 sentences:
Terex aims to achieve $12 billion in sales and 12% operating margin by 2010 through executing on supply chain management, pricing discipline, and lean initiatives to improve margins. The company has a diverse portfolio of products and geographic presence to balance performance across economic cycles. Opportunities for margin improvement include coordinating supply efforts, optimizing manufacturing footprint, and pricing actions to offset rising costs.
1) The annual shareholder meeting presentation discusses Terex Corporation's financial goals for 2010, including achieving $12 billion in sales with a 12% operating margin and 15% working capital to sales ratio.
2) It provides an overview of Terex's business segments and their market positions, with approximately 75% of sales generated in markets where Terex has a leading position.
3) The presentation highlights Terex's sales and backlog figures by business segment for the last twelve months through March 2008, with aerial work platforms sales up 9% and cranes sales up 26% compared to the prior year.
This document contains the presentation from Tim Ford, President of Terex Aerial Work Platforms, at the JPMorgan Basics & Industrials Conference on June 4, 2008. Ford discusses the strong sales growth and global expansion of Terex AWP over the past decade. He outlines the secular growth drivers of the aerial work platform industry and Terex AWP's strategy to further strengthen and globalize its business, maximize revenue and profit from its large installed base, and extend its product offerings beyond aerials. Ford also highlights opportunities to apply lean principles more broadly across the value chain through partnerships with customers and suppliers.
This document contains the presentation from Tim Ford, President of Terex Aerial Work Platforms, at the JPMorgan Basics & Industrials Conference on June 4, 2008. Ford discusses the strong sales growth and global expansion of Terex AWP over the past decade. He outlines the secular growth drivers for the aerial work platform industry and Terex AWP's strategies to further strengthen and globalize its business, maximize revenue and profit from its large installed base, and extend its product offerings beyond aerials. Ford also highlights opportunities to apply lean principles more broadly across the value chain and customer relationships.
Terex is a leading manufacturer of construction and mining equipment with strong market positions. It aims to grow sales to $12 billion by 2010 through executing on initiatives to improve supply chain management, pricing discipline, and productivity. Terex has a diversified business across products and geographies to balance performance through different economic cycles.
Terex is a leading manufacturer of construction and mining equipment with sales of $9.1 billion in 2007. It aims to grow sales to $12 billion by 2010 through organic growth and acquisitions while improving operating margins to 12% and reducing working capital to sales ratio to 15%. Terex has a diversified business across products and geographies that provides balance throughout the economic cycle.
Terex is the 3rd largest manufacturer of construction equipment in the world based on last twelve months of available Construction Equipment Sales. Terex has a strong and diversified revenue base with almost 70% of 2007 sales generated outside of the USA. Approximately 75% of 2007 sales were generated in markets where Terex has a larger market presence than competitors and/or a significant market share.
Sales and backlog for Terex's business segments through March 31, 2008:
- Aerial Work Platform sales increased 9% with backlog up 4% from the previous period.
- Crane segment sales rose 26% and backlog grew 70% over the same period.
- Material Processing & Mining sales were flat while backlog declined slightly.
Overall, Terex is experiencing growth across most segments though some backlogs decreased slightly from the prior period.
1) Terex is the 3rd largest manufacturer of construction equipment in the world, with sales of $10.1 billion over the last 12 months.
2) Terex aims to achieve $12 billion in sales and 12% operating margin by 2010, describing this goal as "12 by 12 in '10".
3) Terex has opportunities to improve margins through better pricing, supply chain management, and productivity initiatives. Reducing working capital, especially inventory, could free up hundreds of millions of dollars.
Vicinity Jobs’ data includes more than three million 2023 OJPs and thousands of skills. Most skills appear in less than 0.02% of job postings, so most postings rely on a small subset of commonly used terms, like teamwork.
Laura Adkins-Hackett, Economist, LMIC, and Sukriti Trehan, Data Scientist, LMIC, presented their research exploring trends in the skills listed in OJPs to develop a deeper understanding of in-demand skills. This research project uses pointwise mutual information and other methods to extract more information about common skills from the relationships between skills, occupations and regions.
The Rise of Generative AI in Finance: Reshaping the Industry with Synthetic DataChampak Jhagmag
In this presentation, we will explore the rise of generative AI in finance and its potential to reshape the industry. We will discuss how generative AI can be used to develop new products, combat fraud, and revolutionize risk management. Finally, we will address some of the ethical considerations and challenges associated with this powerful technology.
STREETONOMICS: Exploring the Uncharted Territories of Informal Markets throug...sameer shah
Delve into the world of STREETONOMICS, where a team of 7 enthusiasts embarks on a journey to understand unorganized markets. By engaging with a coffee street vendor and crafting questionnaires, this project uncovers valuable insights into consumer behavior and market dynamics in informal settings."
Abhay Bhutada, the Managing Director of Poonawalla Fincorp Limited, is an accomplished leader with over 15 years of experience in commercial and retail lending. A Qualified Chartered Accountant, he has been pivotal in leveraging technology to enhance financial services. Starting his career at Bank of India, he later founded TAB Capital Limited and co-founded Poonawalla Finance Private Limited, emphasizing digital lending. Under his leadership, Poonawalla Fincorp achieved a 'AAA' credit rating, integrating acquisitions and emphasizing corporate governance. Actively involved in industry forums and CSR initiatives, Abhay has been recognized with awards like "Young Entrepreneur of India 2017" and "40 under 40 Most Influential Leader for 2020-21." Personally, he values mindfulness, enjoys gardening, yoga, and sees every day as an opportunity for growth and improvement.
2. Elemental Economics - Mineral demand.pdfNeal Brewster
After this second you should be able to: Explain the main determinants of demand for any mineral product, and their relative importance; recognise and explain how demand for any product is likely to change with economic activity; recognise and explain the roles of technology and relative prices in influencing demand; be able to explain the differences between the rates of growth of demand for different products.
Tax System, Behaviour, Justice, and Voluntary Compliance Culture in Nigeria -...
slm 200710KBOW49222BOW014_BITS_NFeb292008
1. UNITED STATES SECURITIES AND EXCHANGE COMMISSION
Washington, D.C. 20549
Form 10-K
(Mark One)
¥ ANNUAL REPORT PURSUANT TO SECTION 13 OR 15(d)
OF THE SECURITIES EXCHANGE ACT OF 1934
For the fiscal year ended December 31, 2007 or
n TRANSITION REPORT PURSUANT TO SECTION 13 or 15(d)
OF THE SECURITIES EXCHANGE ACT OF 1934
For the transition period from to
Commission file numbers 001-13251
SLM Corporation
(Exact Name of Registrant as Specified in Its Charter)
Delaware 52-2013874
(State of Other Jurisdiction of (I.R.S. Employer
Incorporation or Organization) Identification No.)
12061 Bluemont Way, Reston, Virginia 20190
(Zip Code)
(Address of Principal Executive Offices)
(703) 810-3000
(Registrant’s Telephone Number, Including Area Code)
Securities registered pursuant to Section 12(b) of the Act
Common Stock, par value $.20 per share.
Name of Exchange on which Listed:
New York Stock Exchange
6.97% Cumulative Redeemable Preferred Stock, Series A, par value $.20 per share
Floating Rate Non-Cumulative Preferred Stock, Series B, par value $.20 per share
Name of Exchange on which Listed:
New York Stock Exchange
Medium Term Notes, Series A, CPI-Linked Notes due 2017
Medium Term Notes, Series A, CPI-Linked Notes due 2018
6% Senior Notes due December 15, 2043
Name of Exchange on which Listed:
New York Stock Exchange
Securities registered pursuant to Section 12(g) of the Act:
None.
Indicate by check mark whether the registrant is a well-known seasoned issuer, as defined in Rule 405 of the Securities
Yes ¥ No n
Act.
Indicate by check mark if the registrant is not required to file reports pursuant to Section 13 or 15(d) of the Act. Yes n No ¥
Indicate by check mark whether the registrant: (1) has filed all reports required to be filed by Section 13 or 15(d) of the Securities
Exchange Act of 1934 during the preceding 12 months (or for such shorter period that the registrant was required to file such reports), and
(2) has been subject to such filing requirements for the past 90 days. Yes ¥ No n
Indicate by check mark if disclosure of delinquent filers pursuant to Item 405 of Regulation S-K is not contained herein, and will not be
contained, to the best of registrant’s knowledge, in definitive proxy or information statements incorporated by reference in Part III of this
Form 10-K or any amendment to this Form 10-K. ¥
Indicate by check mark whether the registrant is a large accelerated filer, an accelerated filer, a non-accelerated filer, or a smaller
reporting company. See definitions of “large accelerated filer,” “accelerated filer” and “smaller reporting company” in Rule 12b-2 of the
Exchange Act. (Check one):
Large accelerated filer ¥ Accelerated filer n Non-accelerated filer n Smaller reporting company n
(Do not check if a smaller reporting company)
Indicate by check mark whether the registrant is a shell company (as defined in Rule 12b-2 of the Exchange Act). Yes n No ¥
The aggregate market value of voting stock held by non-affiliates of the registrant as of June 30, 2007 was $23.6 billion (based on
closing sale price of $57.58 per share as reported for the New York Stock Exchange — Composite Transactions).
As of January 31, 2008, there were 466,570,624 shares of voting common stock outstanding.
DOCUMENTS INCORPORATED BY REFERENCE
Portions of the Proxy Statement relating to the registrant’s Annual Meeting of Shareholders scheduled to be held May 8, 2008 are
incorporated by reference into Part III of this Report.
2. FORWARD-LOOKING AND CAUTIONARY STATEMENTS
This report contains forward-looking statements and information that are based on management’s current
expectations as of the date of this document. Statements that are not historical facts, including statements
about our beliefs or expectations and statements that assume or are dependent upon future events are forward-
looking statements, and are contained throughout this Annual Report on Form 10-K, including under the
sections entitled “Business” and “Management’s Discussion and Analysis of Financial Condition and Results
of Operations.” These forward-looking statements are subject to risks, uncertainties, assumptions and other
factors that may cause the actual results to be materially different from those reflected in such forward-looking
statements. These factors include, among others, the occurrence of any event, change or other circumstances
that could give rise to our ability to cost-effectively refinance the aggregate interim $30 billion asset-backed
commercial paper conduit facilities (collectively, the “Interim ABCP Facility”) extended to SLM Corporation,
more commonly known as Sallie Mae, and its subsidiaries (collectively, “the Company”) by Bank of America,
N.A. and JPMorgan Chase, N.A. in connection with the Merger Agreement (defined in the Glossary below),
including any potential foreclosure on the student loans under those facilities following their termination,
increased financing costs and more limited liquidity; any adverse outcomes in any significant litigation to
which we are a party; our derivative counterparties may terminate their positions with the Company if its
credit ratings fall to certain levels and the Company could incur substantial additional costs to replace any
terminated positions; changes in the terms of student loans and the educational credit marketplace arising from
the implementation of applicable laws and regulations and from changes in these laws and regulations, which,
among other things, may reduce the volume, average term and yields on student loans under the Federal
Family Education Loan Program (“FFELP”) or result in loans being originated or refinanced under non-FFELP
programs or may affect the terms upon which banks and others agree to sell FFELP loans to the Company. In
addition, a larger than expected increase in third-party consolidations of our FFELP loans could materially
adversely affect our results of operations. The Company could also be affected by changes in the demand for
educational financing or in financing preferences of lenders, educational institutions, students and their
families; incorrect estimates or assumptions by management in connection with the preparation of our
consolidated financial statements; changes in the composition of our Managed FFELP and Private Education
Loan portfolios; changes in the general interest rate environment and in the securitization markets for
education loans, which may increase the costs or limit the availability of financings necessary to initiate,
purchase or carry education loans; changes in projections of losses from loan defaults; changes in general
economic conditions; changes in prepayment rates and credit spreads; and changes in the demand for debt
management services and new laws or changes in existing laws that govern debt management services. All
forward-looking statements contained in this report are qualified by these cautionary statements and are made
only as of the date this Annual Report on Form 10-K is filed. The Company does not undertake any obligation
to update or revise these forward-looking statements to conform the statement to actual results or changes in
the Company’s expectations.
1
3. GLOSSARY
Listed below are definitions of key terms that are used throughout this document. See also APPENDIX A,
“FEDERAL FAMILY EDUCATION LOAN PROGRAM,” for a further discussion of the FFELP and The
College Cost Reduction and Access Act of 2007.
CCRAA — The College Cost Reduction and Access Act of 2007.
Consolidation Loan Rebate Fee — All holders of FFELP Consolidation Loans are required to pay to the
U.S. Department of Education (“ED”) an annual 105 basis point Consolidation Loan Rebate Fee on all
outstanding principal and accrued interest balances of FFELP Consolidation Loans purchased or originated
after October 1, 1993, except for loans for which consolidation applications were received between October 1,
1998 and January 31, 1999, where the Consolidation Loan Rebate Fee is 62 basis points.
Constant Prepayment Rate (“CPR”) — A variable in life of loan estimates that measures the rate at
which loans in the portfolio pay before their stated maturity. The CPR is directly correlated to the average life
of the portfolio. CPR equals the percentage of loans that prepay annually as a percentage of the beginning of
period balance.
“Core Earnings” — In accordance with the Rules and Regulations of the Securities and Exchange
Commission (“SEC”), we prepare financial statements in accordance with generally accepted accounting
principles in the United States of America (“GAAP”). In addition to evaluating the Company’s GAAP-based
financial information, management evaluates the Company’s business segments on a basis that, as allowed
under the Financial Accounting Standards Board’s (“FASB”) Statement of Financial Accounting Standards
(“SFAS”) No. 131, “Disclosures about Segments of an Enterprise and Related Information,” differs from
GAAP. We refer to management’s basis of evaluating our segment results as “Core Earnings” presentations for
each business segment and we refer to these performance measures in our presentations with credit rating
agencies and lenders. While “Core Earnings” results are not a substitute for reported results under GAAP, we
rely on “Core Earnings” performance measures in operating each business segment because we believe these
measures provide additional information regarding the operational and performance indicators that are most
closely assessed by management.
Our “Core Earnings” performance measures are the primary financial performance measures used by
management to evaluate performance and to allocate resources. Accordingly, financial information is reported
to management on a “Core Earnings” basis by reportable segment, as these are the measures used regularly by
our chief operating decision makers. Our “Core Earnings” performance measures are used in developing our
financial plans and tracking results, and also in establishing corporate performance targets and determining
incentive compensation. Management believes this information provides additional insight into the financial
performance of the Company’s core business activities. Our “Core Earnings” performance measures are not
defined terms within GAAP and may not be comparable to similarly titled measures reported by other
companies. “Core Earnings” net income reflects only current period adjustments to GAAP net income.
Accordingly, the Company’s “Core Earnings” presentation does not represent another comprehensive basis of
accounting.
See Note 20 to the consolidated financial statements,“Segment Reporting,” and “MANAGEMENT’S
DISCUSSION AND ANALYSIS OF FINANCIAL CONDITION AND RESULTS OF OPERATIONS —
BUSINESS SEGMENTS — Limitations of ‘Core Earnings’” for further discussion of the differences between
“Core Earnings” and GAAP, as well as reconciliations between “Core Earnings” and GAAP.
In prior filings with the SEC of SLM Corporation’s Annual Report on Form 10-K and quarterly report on
Form 10-Q, “Core Earnings” has been labeled as “‘Core’ net income” or “Managed net income” in certain
instances.
Direct Loans — Student loans originated directly by ED under the FDLP.
ED — The U.S. Department of Education.
2
4. Embedded Fixed Rate/Variable Rate Floor Income — Embedded Floor Income is Floor Income (see
definition below) that is earned on off-balance sheet student loans that are in securitization trusts sponsored by
us. At the time of the securitization, the value of Embedded Fixed Rate Floor Income is included in the initial
valuation of the Residual Interest (see definition below) and the gain or loss on sale of the student loans.
Embedded Floor Income is also included in the quarterly fair value adjustments of the Residual Interest.
Exceptional Performer (“EP”) Designation — The EP designation is determined by ED in recognition
of a servicer meeting certain performance standards set by ED in servicing FFELP Loans. Upon receiving the
EP designation, the EP servicer receives reimbursement on default claims higher than the legislated Risk
Sharing (see definition below) levels on federally guaranteed student loans for all loans serviced for a period
of at least 270 days before the date of default. The EP servicer is entitled to receive this benefit as long as it
remains in compliance with the required servicing standards, which are assessed on an annual and quarterly
basis through compliance audits and other criteria. The annual assessment is in part based upon subjective
factors which alone may form the basis for an ED determination to withdraw the designation. If the
designation is withdrawn, Risk Sharing may be applied retroactively to the date of the occurrence that resulted
in noncompliance. The College Cost Reduction Act of 2007 eliminated the EP designation effective October 1,
2007. See also Appendix A, “FEDERAL FAMILY EDUCATION LOAN PROGRAM.”
FDLP — The William D. Ford Federal Direct Student Loan Program.
FFELP — The Federal Family Education Loan Program, formerly the Guaranteed Student Loan
Program.
FFELP Consolidation Loans — Under the Federal Family Education Loan Program (“FFELP”), borrow-
ers with multiple eligible student loans may consolidate them into a single student loan with one lender at a
fixed rate for the life of the loan. The new note is considered a FFELP Consolidation Loan. Typically a
borrower may consolidate his student loans only once unless the borrower has another eligible loan to
consolidate with the existing FFELP Consolidation Loan. The borrower rate on a FFELP Consolidation Loan
is fixed for the term of the loan and is set by the weighted average interest rate of the loans being
consolidated, rounded up to the nearest 1/8th of a percent, not to exceed 8.25 percent. In low interest rate
environments, FFELP Consolidation Loans provide an attractive refinancing opportunity to certain borrowers
because they allow borrowers to consolidate variable rate loans into a long-term fixed rate loan. Holders of
FFELP Consolidation Loans are eligible to earn interest under the Special Allowance Payment (“SAP”)
formula (see definition below).
FFELP Stafford and Other Student Loans — Education loans to students or parents of students that
are guaranteed or reinsured under the FFELP. The loans are primarily Stafford loans but also include PLUS
and HEAL loans.
Fixed Rate Floor Income — We refer to Floor Income (see definition below) associated with student
loans whose borrower rate is fixed to term (primarily FFELP Consolidation Loans and Stafford Loans
originated on or after July 1, 2006) as Fixed Rate Floor Income.
Floor Income — FFELP student loans generally earn interest at the higher of a floating rate based on the
Special Allowance Payment or SAP formula (see definition below) set by ED and the borrower rate, which is
fixed over a period of time. We generally finance our student loan portfolio with floating rate debt over all
interest rate levels. In low and/or declining interest rate environments, when the fixed borrower rate is higher
than the rate produced by the SAP formula, our student loans earn at a fixed rate while the interest on our
floating rate debt continues to decline. In these interest rate environments, we earn additional spread income
that we refer to as Floor Income. Depending on the type of the student loan and when it was originated, the
borrower rate is either fixed to term or is reset to a market rate each July 1. As a result, for loans where the
borrower rate is fixed to term, we may earn Floor Income for an extended period of time, and for those loans
where the borrower interest rate is reset annually on July 1, we may earn Floor Income to the next reset date.
3
5. In accordance with new legislation enacted in 2006, lenders are required to rebate Floor Income to ED for all
new FFELP loans disbursed on or after April 1, 2006.
The following example shows the mechanics of Floor Income for a typical fixed rate FFELP Consolida-
tion Loan (with a commercial paper-based SAP spread of 2.64 percent):
Fixed Borrower Rate . . . . . . . . . . . . . . . . . . . . . . . . . . . . . . . . . . . . . . . . . . . . . . . . . . . . . . 7.25%
SAP Spread over Commercial Paper Rate . . . . . . . . . . . . . . . . . . . . . . . . . . . . . . . . . . . . . . . (2.64)%
Floor Strike Rate(1) . . . . . . . . . . . . . . . . . . . . . . . . . . . . . . . . . . . . . . . . . . . . . . . . . . . . . . . . 4.61%
(1)
The interest rate at which the underlying index (Treasury bill or commercial paper) plus the fixed SAP spread equals the fixed
borrower rate. Floor Income is earned anytime the interest rate of the underlying index declines below this rate.
Based on this example, if the quarterly average commercial paper rate is over 4.61 percent, the holder of the
student loan will earn at a floating rate based on the SAP formula, which in this example is a fixed spread to
commercial paper of 2.64 percent. On the other hand, if the quarterly average commercial paper rate is below
4.61 percent, the SAP formula will produce a rate below the fixed borrower rate of 7.25 percent and the loan
holder earns at the borrower rate of 7.25 percent. The difference between the fixed borrower rate and the
lender’s expected yield based on the SAP formula is referred to as Floor Income. Our student loan assets are
generally funded with floating rate debt, so when student loans are earning at the fixed borrower rate,
decreases in interest rates may increase Floor Income.
Graphic Depiction of Floor Income:
10.00%
Fixed Borrower Rate = 7.25%
Special Allowance Payment (SAP) Rate = 2.64%
9.00%
8.00% Lender Yield
Yield Fixed Borrower Rate
7.00%
6.00%
Floor Income
Floating Debt Rate
5.00%
Floor Strike Rate @ 4.61%
4.00%
4.00% 5.00% 6.00% 7.00%
Commercial Paper Rate
Floor Income Contracts — We enter into contracts with counterparties under which, in exchange for an
upfront fee representing the present value of the Floor Income that we expect to earn on a notional amount of
underlying student loans being economically hedged, we will pay the counterparties the Floor Income earned
on that notional amount over the life of the Floor Income Contract. Specifically, we agree to pay the
counterparty the difference, if positive, between the fixed borrower rate less the SAP (see definition below)
spread and the average of the applicable interest rate index on that notional amount, regardless of the actual
balance of underlying student loans, over the life of the contract. The contracts generally do not extend over
the life of the underlying student loans. This contract effectively locks in the amount of Floor Income we will
earn over the period of the contract. Floor Income Contracts are not considered effective hedges under
SFAS No. 133, “Accounting for Derivative Instruments and Hedging Activities,” and each quarter we must
record the change in fair value of these contracts through income.
4
6. Front-End Borrower Benefits — Financial incentives offered to borrowers at origination. Front-End
Borrower Benefits primarily represent our payment on behalf of borrowers for required FFELP fees, including
the federal origination fee and federal default fee. We account for these Front-End Borrower Benefits as loan
premiums amortized over the estimated life of the loans as an adjustment to the loan’s yield.
Gross Floor Income — Floor Income earned before payments on Floor Income Contracts.
GSE — The Student Loan Marketing Association was a federally chartered government-sponsored
enterprise and wholly owned subsidiary of SLM Corporation that was dissolved under the terms of the
Privatization Act (see definition below) on December 29, 2004.
Guarantors — State agencies or non-profit companies that guarantee (or insure) FFELP student loans
made by eligible lenders under the HEA.
HEA — The Higher Education Act of 1965, as amended.
Interim ABCP Facility — An aggregate of $30 billion asset-backed commercial paper conduit facilities
that we entered into on April 30, 2007 in connection with the Merger (defined below under “Merger
Agreement”).
Lender Partners — Lender Partners are lenders who originate loans under forward purchase commit-
ments to Sallie Mae where we own the loans from inception or, in most cases, acquire the loans soon after
origination.
Managed Basis — We generally analyze the performance of our student loan portfolio on a Managed
Basis, under which we view both on-balance sheet student loans and off-balance sheet student loans owned by
the securitization trusts as a single portfolio, and the related on-balance sheet financings are combined with off-
balance sheet debt. When the term Managed is capitalized in this document, it is referring to Managed Basis.
Merger Agreement — On April 16, 2007, the Company announced that a buyer group (“Buyer Group”)
led by J.C. Flowers & Co. (“J.C. Flowers”), Bank of America, N.A. and JPMorgan Chase, N.A. (the “Merger”)
signed a definitive agreement (“Merger Agreement”) to acquire the Company for approximately $25.3 billion
or $60.00 per share of common stock. (See also “Merger Agreement” filed with the SEC on the Company’s
Current Report on Form 8-K, dated April 18, 2007.) On January 25, 2008, the Company, Mustang Holding
Company Inc. (“Mustang Holding”), Mustang Merger Sub, Inc. (“Mustang Sub”), J.C. Flowers, Bank of
America, N.A. and JPMorgan Chase Bank, N.A. entered into a Settlement, Termination and Release
Agreement (the “Agreement”). Under the Agreement, a lawsuit filed by the Company related to the Merger, as
well as all counterclaims, was dismissed.
Preferred Lender List — Most higher education institutions select a small number of lenders to
recommend to their students and parents. This recommended list is referred to as the Preferred Lender List.
Preferred Channel Originations — Preferred Channel Originations are comprised of: 1) loans that are
originated by internally marketed Sallie Mae brands, and 2) student loans that are originated by lenders with
forward purchase commitment agreements with Sallie Mae and are committed for sale to Sallie Mae, such that
we either own them from inception or, in most cases, acquire them soon after origination.
Private Education Consolidation Loans — Borrowers with multiple Private Education Loans (defined
below) may consolidate them into a single loan with Sallie Mae (Private Consolidation Loans@). The interest
rate on the new loan is variable rate with the spread set at the lower of the average weighted spread of the
underlying loans (available only to Sallie Mae customers) or a new spread as a result of favorable underwriting
criteria.
5
7. Private Education Loans — Education loans to students or parents of students that are not guaranteed or
reinsured under the FFELP or any other federal or private student loan program. Private Education Loans
include loans for higher education (undergraduate and graduate degrees) and for alternative education, such as
career training, private kindergarten through secondary education schools and tutorial schools. Higher
education loans have repayment terms similar to FFELP loans, whereby repayments begin after the borrower
leaves school. Our higher education Private Education Loans to students attending Title IV Schools are not
dischargeable in bankruptcy, except in certain limited circumstances. Repayment for alternative education
generally begins immediately.
In the context of our Private Education Loan business, we use the term “non-traditional loans” to describe
education loans made to certain borrowers that have or are expected to have a high default rate as a result of a
number of factors, including having a lower tier credit rating, low program completion and graduation rates or,
where the borrower is expected to graduate, a low expected income relative to the borrower’s cost of
attendance.
Privatization Act — The Student Loan Marketing Association Reorganization Act of 1996.
Reconciliation Legislation — The Higher Education Reconciliation Act of 2005, which reauthorized the
student loan programs of the HEA and generally became effective as of July 1, 2006.
Repayment Borrower Benefits — Financial incentives offered to borrowers based on pre-determined
qualifying factors, which are generally tied directly to making on-time monthly payments. The impact of
Repayment Borrower Benefits is dependent on the estimate of the number of borrowers who will eventually
qualify for these benefits and the amount of the financial benefit offered to the borrower. We occasionally
change Repayment Borrower Benefits programs in both amount and qualification factors. These programmatic
changes must be reflected in the estimate of the Repayment Borrower Benefits discount when made.
Residual Interest — When we securitize student loans, we retain the right to receive cash flows from the
student loans sold to trusts we sponsor in excess of amounts needed to pay servicing, derivative costs (if any),
other fees, and the principal and interest on the bonds backed by the student loans. The Residual Interest,
which may also include reserve and other cash accounts, is the present value of these future expected cash
flows, which includes the present value of Embedded Fixed Rate Floor Income described above. We value the
Residual Interest at the time of sale of the student loans to the trust and at the end of each subsequent quarter.
Retained Interest — The Retained Interest includes the Residual Interest (defined above) and servicing
rights (as the Company retains the servicing responsibilities).
Risk Sharing — When a FFELP loan defaults, the federal government guarantees 97 percent of the
principal balance plus accrued interest (98 percent on loans disbursed before July 1, 2006) and the holder of
the loan is at risk for the remaining amount not guaranteed as a Risk Sharing loss on the loan. FFELP student
loans originated after October 1, 1993 are subject to Risk Sharing on loan default claim payments unless the
default results from the borrower’s death, disability or bankruptcy. FFELP loans serviced by a servicer that has
EP designation (see definition above) from ED are subject to one-percent Risk Sharing for claims filed on or
after July 1, 2006 and before October 1, 2007.
Special Allowance Payment (“SAP”) — FFELP student loans originated prior to April 1, 2006 (with the
exception of certain PLUS and SLS loans discussed below) generally earn interest at the greater of the
borrower rate or a floating rate determined by reference to the average of the applicable floating rates (91-day
Treasury bill rate or commercial paper) in a calendar quarter, plus a fixed spread that is dependent upon when
the loan was originated and the loan’s repayment status. If the resulting floating rate exceeds the borrower
rate, ED pays the difference directly to us. This payment is referred to as the Special Allowance Payment or
SAP and the formula used to determine the floating rate is the SAP formula. We refer to the fixed spread to
the underlying index as the SAP spread. For loans disbursed after April 1, 2006, FFELP loans effectively only
6
8. earn at the SAP rate, as the excess interest earned when the borrower rate exceeds the SAP rate (Floor
Income) must be refunded to ED.
Variable rate PLUS Loans and SLS Loans earn SAP only if the variable rate, which is reset annually,
exceeds the applicable maximum borrower rate. For PLUS loans disbursed on or after January 1, 2000, this
limitation on SAP was repealed effective April 1, 2006.
Title IV Programs and Title IV Loans — Student loan programs created under Title IV of the HEA,
including the FFELP and the FDLP, and student loans originated under those programs, respectively.
Variable Rate Floor Income — For FFELP Stafford student loans whose borrower interest rate resets
annually on July 1, we may earn Floor Income or Embedded Floor Income (see definitions above) based on a
calculation of the difference between the borrower rate and the then current interest rate. We refer to this as
Variable Rate Floor Income because Floor Income is earned only through the next reset date.
Wholesale Consolidation Loans — During 2006, we implemented a loan acquisition strategy under
which we began purchasing a significant amount of FFELP Consolidation Loans, primarily via the spot
market, which augments our in-house FFELP Consolidation Loan origination process. Wholesale Consolida-
tion Loans are considered incremental volume to our core acquisition channels, which are focused on the retail
marketplace with an emphasis on our brand strategy.
7
9. PART I.
Item 1. Business
INTRODUCTION TO SLM CORPORATION
SLM Corporation, more commonly known as Sallie Mae, is the market leader in education finance. SLM
Corporation is a holding company that operates through a number of subsidiaries. (References in this Annual
Report to the “Company” refer to SLM Corporation and its subsidiaries).
Our primary business is to originate and hold student loans. We provide funding, delivery and servicing
support for education loans in the United States through our participation in the Federal Family Education
Loan Program (“FFELP”) and through our own non-federally guaranteed Private Education Loan programs.
We primarily market our FFELP Stafford loans and Private Education Loans through on-campus financial aid
offices. We have also expanded into direct-to-consumer marketing, primarily for Private Education Loans, to
reach those students and families that choose not to consult with the financial aid office.
We have used both internal growth and strategic acquisitions to attain our leadership position in the
education finance marketplace. Our sales force, which delivers our products on campuses across the country, is
the largest in the student loan industry. The core of our marketing strategy is to promote our on-campus
brands, which generate student loan originations through our Preferred Channel. Loans generated through our
Preferred Channel are more profitable than loans acquired through other acquisition channels because we own
them earlier in the student loan’s life and generally incur lower costs to acquire such loans. We have built
brand leadership through the Sallie Mae name, the brands of our subsidiaries and those of our lender partners.
These sales and marketing efforts are supported by the largest and most diversified servicing capabilities in the
industry.
We have expanded into a number of fee-based businesses, most notably, our Asset Performance Group
(“APG”) business (formerly, Debt Management Operations (“DMO”)). We also earn fees for a number of
services including student loan and guarantee servicing, 529 college-savings plan administration services, and
for providing processing capabilities and information technology to educational institutions. We also operate
an affinity marketing program through Upromise, Inc. (“Upromise”). References in this Annual Report to
“Upromise” refer to Upromise and its subsidiaries.
At December 31, 2007, we had approximately 11,000 employees.
CURRENT BUSINESS STRATEGY
On September 27, 2007, the College Cost Reduction and Access Act of 2007 (“CCRAA”) was signed
into law by the President, resulting in, among other things, a reduction in the yield received by the Company
on FFELP loans originated on or after October 1, 2007. In the summer of 2007, the global capital markets
began to experience a severe dislocation that has persisted to present. This dislocation, along with a reduction
in the Company’s unsecured debt ratings caused by the proposed Merger, resulted in more limited access to
the capital markets than the Company has enjoyed in the past and a substantial increase in its cost of newly
obtained funding.
Our management team is evaluating certain aspects of our business in light of the impact of the CCRAA
and the current challenges in the capital markets. The CCRAA has a number of important implications for the
profitability of our FFELP loan business, including a reduction in Special Allowance Payments, the elimination
of the Exceptional Performer designation and the corresponding reduction in default payments to 97 percent
through 2012 and 95 percent thereafter, an increase in the lender paid origination fees for certain loan types
and a reduction in default collection retention fees and account maintenance fees related to guaranty agency
activities. As a result, we expect that the CCRAA will significantly reduce and, combined with higher
financing costs, could possibly eliminate the profitability of new FFELP loan originations, while also
increasing our Risk Sharing in connection with our FFELP loan portfolio.
8
10. We plan to curtail less profitable student loan origination and acquisition activities that have less strategic
value, including originations of Private Education Loans for high default rate and lower-tier credit borrowers,
as well as spot purchases and Wholesale Consolidation Loan purchases, all of which will also reduce our
funding needs. We expect to minimize incremental FFELP Consolidation Loan volume as a result of
significant margin erosion for FFELP Consolidation Loans created by the combined effect of the CCRAA and
elevated funding costs. However, we will continue our efforts to protect select FFELP assets existing in our
portfolio. We expect to continue to aggressively pursue other FFELP-related fee income opportunities such as
FFELP loan servicing, guarantor servicing and collections. In addition, we plan to reduce and, over time, to no
longer offer certain borrower benefits in connection with both our FFELP loans and our Private Education
Loans.
We expect to continue to focus on generally higher-margin Private Education Loans, originated both
through our school channel and our direct-to-consumer channel, with particular attention to upholding our
more stringent underwriting standards. In January 2008, we notified some of our school customers whose
students have non-traditional loans that we were curtailing certain high default rate lending programs and
reviewing the pricing of others. Actual credit performance at these programs was materially below our original
expectations. Charge-offs at these non-traditional schools are largely driven by low program completion and
graduation rates. The non-traditional portfolio is also particularly impacted by the weakening U.S. economy.
We also expect to adjust our Private Education Loan pricing at all schools to reflect the current financing and
market conditions.
We expect to see lenders exit the student loan industry in response to the CCRAA and current conditions
in the credit markets and, as a result, expect to partially offset declining loan volumes caused by our more
selective lending policies with increased market share assumed from participants exiting the industry.
The impacts of the CCRAA as well as the challenges we are facing in the capital markets are also
requiring us to rationalize our business operations and reduce our costs. We are undertaking a thorough review
of all of our business units with a goal of achieving appropriate risk-adjusted returns across all of our business
segments and providing cost-effective services. As a result, we aim to reduce our operating expenses by up to
20 percent as compared to 2007 operating expenses by year-end 2009, before adjusting for growth and other
investments. Since year-end 2007, we have reduced our work force by approximately three percent.
BUSINESS SEGMENTS
We provide an array of credit products and related services to the higher education and consumer credit
communities and others through two primary business segments: our Lending business segment and our APG
business segment. These defined business segments operate in distinct business environments and have unique
characteristics and face different opportunities and challenges. They are considered reportable segments under
the Financial Accounting Standards Board’s (“FASB”) Statement of Financial Accounting Standards (“SFAS”)
No. 131, “Disclosures about Segments of an Enterprise and Related Information,” based on quantitative
thresholds applied to the Company’s financial statements. In addition, within our Corporate and Other business
segment, we provide a number of complementary products and services to guarantors and lender partners that
are managed within smaller operating segments, the most prominent being our Guarantor Servicing and Loan
Servicing businesses. Our Corporate and Other business segment also includes the activities of our Upromise
subsidiary. In accordance with SFAS No. 131, we include in Note 20 to our consolidated financial statements,
“Segment Reporting,” separate financial information about our operating segments.
Management, including the Company’s chief operating decision makers, evaluates the performance of the
Company’s operating segments based on their profitability as measured by “Core Earnings.” Accordingly, we
provide information regarding the Company’s reportable segments in this report based on “Core Earnings.”
“Core Earnings” are the primary financial performance measures used by management to develop the
Company’s financial plans, track results, and establish corporate performance targets and incentive compensa-
tion. While “Core Earnings” are not a substitute for reported results under generally accepted accounting
principles in the United States (“GAAP”), the Company relies on “Core Earnings” in operating its business
because “Core Earnings” permit management to make meaningful period-to-period comparisons of the
9
11. operational and performance indicators that are most closely assessed by management. Management believes
this information provides additional insight into the financial performance of the core business activities of our
operating segments. (See “MANAGEMENT’S DISCUSSION AND ANALYSIS OF FINANCIAL CONDI-
TION AND RESULTS OF OPERATIONS — BUSINESS SEGMENTS” for a detailed discussion of our “Core
Earnings,” including a table that summarizes the pre-tax differences between “Core Earnings” and GAAP by
business segment and the limitations to this presentation. )
We generate most of our “Core Earnings” earnings in our Lending business from the spread between the
yield we receive on our Managed portfolio of student loans and the cost of funding these loans less the
provisions for loan losses. We incur servicing, selling and administrative expenses in providing these products
and services, and provide for loan losses. On our consolidated statement of income, prepared in accordance
with GAAP, this spread income is reported as “net interest income” for on-balance sheet loans, and as “gains
on student loan securitizations” and “servicing and securitization revenue” for off-balance sheet loans for
which we have a Retained Interest. Total “Core Earnings” revenues for this segment were $1.4 billion in 2007.
In our APG business segment, we provide a wide range of accounts receivable and collections services
including student loan default aversion services, defaulted student loan portfolio management services,
contingency collections services for student loans and other asset classes, and accounts receivable management
and collection for purchased portfolios of receivables that are delinquent or have been charged off by their
original creditors as well as sub-performing and non-performing mortgage loans. In the purchased receivables
business, we focus on a variety of consumer debt types with emphasis on charged-off credit card receivables
and distressed mortgage receivables. We purchase these portfolios at a discount to their face value, and then
use both our internal collection operations coupled with third-party collection agencies to maximize the
recovery on these receivables.
LENDING BUSINESS SEGMENT
In our Lending business segment, we originate and acquire both federally guaranteed student loans
(FFELP loans), which are administered by the U.S. Department of Education (“ED”), and Private Education
Loans, which are not federally guaranteed. Borrowers use Private Education Loans primarily to supplement
federally guaranteed loans in meeting the cost of education. We manage the largest portfolio of FFELP and
Private Education Loans in the student loan industry, serving over 10 million student and parent customers
through our ownership and management of $163.6 billion in Managed student loans as of December 31, 2007,
of which $135.2 billion or 83 percent are federally insured. We serve a diverse range of clients that includes
over 6,000 educational and financial institutions and state agencies. We are the largest servicer of student
loans, servicing a portfolio of $127.4 billion of FFELP loans and $32.6 billion of Private Education Loans as
of December 31, 2007. We also market student loans, both federal and private, directly to the consumer. In
addition to education lending, we originate mortgage and consumer loans. In 2007 we originated $848 million
in mortgage and consumer loans. Our mortgage and consumer loan portfolio totaled $545 million at
December 31, 2007, of which $19 million are mortgages in the held-for-sale portfolio.
10
12. Student Lending Marketplace
The following chart shows estimated sources of funding for attending two-year and four-year colleges for
the academic year (“AY”) ending June 30, 2008 (AY 2007-2008). Approximately 36 percent of the funding
comes from federally guaranteed student loans and Private Education Loans. Parent/student contributions
consist of savings/investments, current period earnings and other loans obtained through the normal financial
aid process.
Sources of Funding for College Attendance — AY 2007-2008(1)
Total Projected Cost — $258 Billion
(dollars in billions)
Parent/Student
Federal Student
Contributions
$71 Loans
$74
$18
$95
Private Education
Loans
Scholarships, Grants, &
Other
(1)
Source: Based on estimates by Octameron Associates, “Don’t Miss Out,” 32nd Edition; College Board, “2007
Trends in Student Aid”; and Sallie Mae. Includes tuition, room, board, transportation and miscellaneous costs
for two and four year college degree-granting programs.
Federally Guaranteed Student Lending Programs
There are two competing programs that provide student loans where the ultimate credit risk lies with the
federal government: the FFELP and the Federal Direct Lending Program (“FDLP”). FFELP loans are provided
by private sector institutions and are ultimately guaranteed by ED except for the Risk Sharing loss. FDLP
loans are funded by taxpayers and provided to borrowers directly by ED on terms similar to student loans in
the FFELP. In addition to these government guaranteed programs, financial institutions also make Private
Education Loans, where the lender or holder assumes the credit risk of the borrower.
For the federal fiscal year (“FFY”) ended September 30, 2007 (FFY 2007), ED estimated that the
FFELP’s market share in federally guaranteed student loans was 80 percent, up from 79 percent in FFY 2006.
(See “LENDING BUSINESS SEGMENT — Competition.”) Total FFELP and FDLP volume for FFY 2007
grew by 7 percent, with the FFELP portion growing 8 percent.
The Higher Education Act (the “HEA”) includes regulations that cover every aspect of the servicing of a
federally guaranteed student loan, including communications with borrowers, loan originations and default
aversion. Failure to service a student loan properly could jeopardize the guarantee on federal student loans.
This guarantee generally covers 98 and 97 percent (95 percent after 2012) of the student loan’s principal and
accrued interest for loans disbursed before and after July 1, 2006, respectively. In the case of death, disability
or bankruptcy of the borrower, the guarantee covers 100 percent of the student loan’s principal and accrued
interest.
11
13. FFELP student loans are guaranteed by state agencies or non-profit companies called guarantors, with ED
providing reinsurance to the guarantor. Guarantors are responsible for performing certain functions necessary
to ensure the program’s soundness and accountability. These functions include reviewing loan application data
to detect and prevent fraud and abuse and to assist lenders in preventing default by providing counseling to
borrowers. Generally, the guarantor is responsible for ensuring that loans are being serviced in compliance
with the requirements of the HEA. When a borrower defaults on a FFELP loan, we submit a claim to the
guarantor who reimburses us for principal and accrued interest subject to the Risk Sharing (See APPENDIX A,
“FEDERAL FAMILY EDUCATION LOAN PROGRAM,” to this document for a more complete description
of the role of guarantors.)
Private Education Loan Products
In addition to federal loan programs, which have statutory limits on annual and total borrowing, we
sponsor a variety of Private Education Loan programs and purchase loans made under such programs to bridge
the gap between the cost of education and a student’s resources. The majority of our higher education Private
Education Loans are made in conjunction with a FFELP Stafford loan, and are marketed to schools through
the same marketing channels — and by the same sales force — as FFELP loans. In 2004, we expanded our
direct-to-consumer loan marketing channel with our Tuition AnswerSM loan program under which we originate
and purchase loans outside of the traditional financial aid process. We also originate and purchase Private
Education Loans marketed by our SLM Financial subsidiary to career training, technical and trade schools,
tutorial and learning centers, and private kindergarten through secondary education schools. These loans are
primarily made at schools not eligible for Title IV loans. Private Education Loans are discussed in more detail
below.
Drivers of Growth in the Student Loan Industry
The growth in our Managed student loan portfolio is driven by the growth in the overall student loan
marketplace, as well as by our own market share gains. Rising enrollment and college costs have resulted in
the size of the federally insured student loan market more than doubling over the last 10 years. Federally
insured student loan originations grew from $29.0 billion in FFY 1997 to $64.3 billion in FFY 2007.
According to the College Board, tuition and fees at four-year public institutions and four-year private
institutions have increased 54 percent and 33 percent, respectively, in constant, inflation-adjusted dollars, since
AY 1997-1998. Under the FFELP, there are limits to the amount students can borrow each academic year. The
first loan limit increases since 1992 were implemented July 1, 2007 when freshman and sophomore limits
were increased to $3,500 and $4,500 from $2,625 and $3,500, respectively. The fact that guaranteed student
loan limits have not kept pace with tuition increases has driven more students and parents to Private Education
Loans to meet an increasing portion of their education financing needs. Loans — both federal and private — as
a percentage of total student aid were 53 percent of total student aid in AY 1996-1997 and 52 percent in AY
2006-2007. Private Education Loans accounted for 24 percent of total student loans — both federally
guaranteed and Private Education Loans — in AY 2006-2007, compared to 7 percent in AY 1997-1998.
The National Center for Education Statistics predicts that the college-age population will increase
approximately 14 percent from 2007 to 2016. Demand for education credit will also increase due to the rise in
students not attending college directly from high school and adult education.
12
14. The following charts show the historical and projected enrollment and average tuition and fee growth for
four-year public and private colleges and universities.
Historical and Projected Enrollment
(in millions)
Historical and Projected Enrollment Levels
20.4
20.2
21 19.9
19.7
19.4
19.1
18.8
18.6
18.3
18
17.7
17.5
17.3
18 16.9
16.6
15.9
15.3
15
12
9
6
3
0
2000 2003 2006 2009 2012 2015
Source: National Center for Education Statistics
Note: Total enrollment in all degree-granting institutions; middle alternative projections for 2006 onward.
Cost of Attendance(1)
Cumulative % Increase from AY 1997-1998
100
80
60
40
20
–
98
99
00
01
02
03
04
05
06
07
19
19
20
20
20
20
20
20
20
20
Tuition & Fees 4-Year Private
Tuition & Fees 4-Year Public
Source: The College Board
(1)
Cost of attendance is in current dollars and includes
tuition, fees and on-campus room and board.
Sallie Mae’s Lending Business
Our primary marketing point-of-contact is the school’s financial aid office where we focus on delivering
flexible and cost-effective products to the school and its students. Our sales force is the largest in the industry
and currently markets the following internal lender brands: Academic Management Services (“AMS”), Nellie
Mae, Sallie Mae Education Trust, SLM Financial, Student Loan Funding Resources (“SLFR”), Southwest
Student Services (“Southwest”) and Student Loan Finance Association (“SLFA”). We also actively market the
loan guarantee of United Student Aid Funds, Inc. (“USA Funds”) and its affiliate, Northwest Education Loan
Association (“NELA”), through a separate sales force.
We acquire student loans from two principal sources: our Preferred Channel and strategic acquisitions.
In 2007, we originated $25.5 billion in student loans through our Preferred Channel, of which a total of
$16.6 billion or 65 percent was originated through our internal lending brands. The mix of Preferred Channel
Originations marks a significant shift from the past, when our internal lending brands were the smallest
component of our Preferred Channel Originations. Internal lending brand growth is a key factor to our long-
13
15. term market penetration. This positions us to control our future volume as well as the costs to originate new
assets. Our internal lending brand loans are our most valuable loans because we do not pay a premium other
than to ED to originate them. The adverse impact of the CCRAA on FFELP loan profitability has further
increased the importance of our internal lending brands as a vehicle for achieving appropriate risk-adjusted
returns.
Preferred Channel Originations growth has been fueled by new business from schools leaving the FDLP
or other FFELP lending relationships, same school sales growth, and growth in the for-profit sector. Since
1999, we have partnered with over 300 schools that have chosen to return to the FFELP from the FDLP. Our
FFELP loan originations at these schools totaled over $2.4 billion in 2007. In addition to working with new
schools, we have also forged broader relationships with many of our existing school clients. Our FFELP and
private originations at for-profit schools have grown faster than at not-for-profit schools due to enrollment
trends as well as our increased market share of lending to these institutions. We expect that in 2008 and in
subsequent years this trend will be reversed. Many of our for-profit school customers have programs for which
we offer non-traditional loans. As we cut back on Private Education Loan programs to this non-traditional
segment of our customer base, we expect to lose FFELP loan volume originated through these schools as well.
Similarly, as we reduce premiums for lender partner and school-as-lender purchases, we expect to lose FFELP
volume. Accordingly, we expect volume in both FFELP loan and Private Education Loan originations to
decline in 2008 relative to 2007.
Consolidation Loans
Between 2003 and 2006, we experienced a surge in consolidation activity as a result of aggressive
marketing and historically low interest rates. This growth has contributed to the changing composition of our
student loan portfolio. FFELP Consolidation Loans earn a lower yield than FFELP Stafford Loans due
primarily to the Consolidation Loan Rebate Fee. The Consolidation Loan margin was 75 basis points lower
than a FFELP Stafford loan in repayment as a result of this fee. This negative impact is somewhat mitigated
by the longer average life of FFELP Consolidation Loans. FFELP Consolidation Loans now represent
67 percent of both our on-balance sheet federally guaranteed student loan portfolio and Managed federally
guaranteed portfolio, respectively.
We expect the percentage of our portfolio consisting of Consolidation Loans will decline steadily over
time. The CCRAA dramatically reduced the margin on new FFELP Consolidation Loans and, as a result these
loans are only marginally profitable for high balance loans and are not profitable for lower loan balances.
Legislation passed in 2006 provided for all FFELP loans to bear a fixed rate to the borrower, thereby
eliminating the potential for the borrower to lock in a more beneficial interest rate on post-July 1, 2006 loans
in a low interest rate environment. This had a significant adverse impact on the Consolidation Loan industry
that developed as a result of the low interest rate environment that existed between 2000 and 2004.
Accordingly, we are no longer buying Wholesale Consolidation Loans or actively marketing Consolidation
Loans to our customer base. Finally, under the HEA, borrowers with loan balances exceeding $30,000 can
extend their repayment term without consolidating their loans. As a result of all of these factors, we believe
that FFELP loans will have a much lower propensity to consolidate in the future. We intend to accommodate
those borrowers who have high loan balances and who wish to consolidate their loans. We will also direct
borrowers wishing to extend their loan’s term to the FFELP extended repayment product, which we believe
will be an attractive alternative to a Consolidation Loan for borrowers seeking a lower monthly payment.
GradPLUS
The Deficit Reduction Act of 2005 expanded the existing Federal PLUS loan program to include graduate
and professional students (“GradPLUS Loans”). Previously, PLUS loans were restricted to parents of
dependent, undergraduate students.
GradPLUS Loans generally have a lower rate of interest than our Private Education Loans and they allow
graduate and professional students to borrow up to the full cost of their education (tuition, room and board),
14
16. less other financial aid received. In 2007, we originated $606 million of GradPLUS loans which represented
two percent of our Preferred Channel Originations.
Private Education Loans
The rising cost of education has led students and their parents to seek additional private sources to
finance their education. Private Education Loans are often packaged as supplemental or companion products to
FFELP loans. Over the last several years, the growth of Private Education Loans has continued due to tuition
increasing faster than the rate of inflation coupled with stagnant FFELP lending limits. This growth combined
with the relatively higher spreads has led to Private Education Loans contributing a higher percentage of our
net interest margin in recent years. We expect this trend to continue in the foreseeable future in part due to
margin erosion for FFELP student loans. In 2007, Private Education Loans contributed 36 percent of our
overall “Core Earnings” net interest income before provisions for loan losses plus other income, up from
29 percent in 2006.
The Higher Education Reconciliation Act of 2005 increased FFELP loan limits on July 1, 2007 for
freshman and sophomores. This, along with the introduction of GradPLUS Loans discussed above, will
somewhat offset the rate of growth in Private Education Loans in the future. We believe this loss of future
Private Education Loan volume for graduate students will be replaced by an increase in federally insured
loans.
Since we bear the full credit risk for Private Education Loans, they are underwritten and priced according
to credit risk based upon customized consumer credit scoring criteria. We mitigate some of this credit risk by
providing price and eligibility incentives for students to obtain a credit-worthy cosigner, and 52 percent of our
Managed Private Education Loans have a cosigner. Due to their higher risk profile, Private Education Loans
earn higher spreads than their FFELP loan counterparts. In 2007, Private Education Loans earned an average
“Core Earnings” spread (before provisions for loan losses and the Interim ABCP Facility Fees) of 5.15 percent
versus an average “Core Earnings” spread of 1.04 percent for FFELP loans (before provisions for loan losses
and the Interim ABCP Facility Fees).
Our largest Private Education Loan program is the Signature Student Loan», which is offered to
undergraduates and graduates through the financial aid offices of colleges and universities to supplement
traditional FFELP loans. We also offer specialized loan products to graduate and professional students
primarily through our MBA Loans», LAWLOANS» and, Sallie Mae Medical School Loans» and Sallie Mae
DENTALoans» programs. Generally, these loans do not require borrowers to begin repaying their loans until
after graduation and allow a grace period from six to nine months.
In 2004 we began to offer Tuition Answer» loans directly to the consumer through targeted direct mail
campaigns and Web-based initiatives. Under the Tuition Answer loan program, creditworthy parents, sponsors
and students may borrow between $1,500 and $40,000 per year to cover any qualified higher education
expense, but now capped at the full cost of tuition and board at the school they attend. No school certification
is required, although a borrower must provide enrollment documentation. At December 31, 2007, we had
$3.3 billion of Tuition Answer loans outstanding in our Managed student loan portfolio.
We also offer alternative Private Education Loans for information technology, cosmetology, mechanics,
medical/dental/lab, culinary and broadcasting education programs. On average, these career training programs
typically last fewer than 12 months. These loans require the borrower to begin repaying the loan immediately;
however, students can opt to make relatively small payments while enrolled. At December 31, 2007, we had
$2.4 billion of career training loans outstanding.
Acquisitions
We have acquired several companies in the student loan industry that have increased our sales and
marketing capabilities, added significant new brands and greatly enhanced our product offerings. The following
15
17. table provides a timeline of strategic acquisitions that have played a major role in the growth of our Lending
business.
Lending Segment Timeline
July
1999 October
July 2000
Nellie 2004
USA Group
Mae Southwest
1999 2000 2001 2002 2003 2004 2005 2006 2007
July 2000 November December
SLFR 2003 2004
AMS SLFA
Financing
Prior to the announcement of the Merger, the Company funded its loan originations primarily with a
combination of term asset-backed securitizations and unsecured debt. Upon the announcement of the Merger
on April 17, 2007, credit spreads on our unsecured debt widened considerably, significantly increasing our
cost of accessing the unsecured debt markets. As a result, in the near term, we expect to fund our operations
primarily through the issuance of student loan asset-backed securities and borrowings under secured student
loan financing facilities, as further described below. We historically have been a regular issuer of term asset-
backed securities in the domestic and international capital markets. (See also “MANAGEMENT’S DISCUS-
SION AND ANALYSIS OF FINANCIAL CONDITION AND RESULTS OF OPERATIONS — LIQUIDITY
AND CAPITAL RESOURCES.”) For the reasons described above, securitization is currently and is likely to
continue to be our principal source of cost-effective financing. We expect approximately 90 percent or more of
our funding needs in 2008 will be satisfied through asset-backed securitizations.
The Company has engaged J.P. Morgan Securities, Inc. (“JPMorgan”) and Banc of America Securities,
LLC (“BAS”) as Lead Arrangers and Joint Bookrunners along with Barclays Capital, The Royal Bank of
Scotland, plc and Deutsche Bank Securities, Inc. as Co-Lead Arrangers and Credit Suisse, New York Branch,
as Arranger to underwrite and arrange up to $28.0 billion of secured FFELP loan facilities and a $7.0 billion
secured private credit student loans facility (together, the “Facilities”).
As of February 28, 2008, we anticipate closing on $23.4 billion of FFELP student loan ABCP conduit
facilities and $5.9 billion of Private Education Loan ABCP conduit facilities on February 29, 2008, or as soon
as practical thereafter. Also on that date, we anticipate closing on an additional $2.0 billion secured FFELP
loan facility. In addition, we anticipate closing on an additional $2.5 billion of student loan ABCP conduit
facilities by mid March 2008. The new $33.8 billion of financing facilities we expect to close on, which may
ultimately be increased to up to $35 billion in aggregate, will replace our $30 billion Interim ABCP Facility
and $6 billion ABCP facility. The initial term of each of the new facilities will be 364 days. These new
facilities will provide funding for certain of our FFELP loans and Private Education Loans until such time as
these loans are refinanced in the term ABS markets. In the event amounts outstanding under the Interim ABCP
Facility are not repaid by the Company in full, the Interim ABCP Facility will terminate on April 24, 2008.
In connection with our financing programs, we undertake regular investor development efforts intended to
continually expand and diversify our pool of investors.
One of our major objectives when financing our business is to minimize interest rate risk by matching the
interest rate and term characteristics of our Managed assets with our Managed liabilities, generally on a pooled
16
18. basis, to the extent practical. To achieve this objective, we use derivative financial instruments extensively to
reduce our interest rate and foreign currency exposure. Match funding and interest rate risk management also
help stabilize our student loan spread in various interest rate environments.
On February 4, 2008, Standard & Poor’s Ratings Services announced that it lowered our credit ratings to
“BBB-/A-3” from “BBB+/A-2.” Standard & Poor’s also announced that our rating remains on CreditWatch
with negative implications, pending the closing of the new asset-backed commercial paper conduit discussed
above. Notwithstanding the lowering of our credit rating, we believe that we have taken several steps in the
last several months to further strengthen the company and position it for ratings improvement in the future.
These steps include raising more than $3.0 billion in equity capital, securing commitments for $33.8 billion in
financing from some of the world’s largest financial institutions, eliminating our equity forward positions and
curtailing certain private education lending programs to students attending schools where loan performance is
materially below our original expectations. We intend to continue to work with Standard & Poor’s and the
other rating agencies to demonstrate our financial strength and stability.
Sallie Mae Bank
On November 3, 2005, we announced that the Utah Department of Financial Institutions approved our
application for an industrial bank charter. Beginning in February and August 2006, Sallie Mae Bank (the
“Bank”) began funding and originating Private Education Loans and FFELP Consolidation Loans, respectively,
made by Sallie Mae to students and families nationwide. This allows us to capture the full economics of these
loans from origination. In addition, the industrial bank charter allows us to expand the products and services
we can offer to students and families. Funds received in connection with our tuition payment plan product are
deposited and held in escrow with the Bank. In addition, cash rebates that Upromise members earn from
qualifying purchases from Upromise’s participating companies are held by the Bank. These deposits are used
by the Bank for a low cost source of funding.
Competition
Our primary competitor for federally guaranteed student loans is the FDLP, which in its first four years of
existence (FFYs 1994-1997) grew its market share of the total federally sponsored student loan market from
four percent in FFY 1994 to a peak of 34 percent in FFY 1997. The FDLP’s market share has steadily
declined since then to 20 percent in FFY 2007. Historically, we have also faced competition for both federally
guaranteed and non-guaranteed student loans from a variety of financial institutions including banks, thrifts
and state-supported secondary markets. However, as a result of the CCRAA and the dislocation in the capital
markets, the student loan industry is undergoing a significant transition. A number of student lenders have
ceased operations altogether or curtailed activity. The environment of aggressive price competition between
lenders has also decreased dramatically. Many of the lenders that remain in the business have been
rationalizing pricing by reducing borrower benefits. As a result of these factors, we believe that as the largest
student lender, we are well positioned to increase market share in the coming years. Our FFY 2007 FFELP
Preferred Channel Originations totaled $17 billion, representing a 27 percent market share.
ASSET PERFORMANCE GROUP BUSINESS SEGMENT
In our APG segment, we provide a wide range of accounts receivable and collections services including
student loan default aversion services, defaulted student loan portfolio management services, and contingency
collections services for student loans and other asset classes. We also provide accounts receivable management and
collections services on consumer and mortgage receivable portfolios that we purchase. The table below presents a
timeline of key acquisitions that have fueled the growth of our APG business, including: General Revenue
Corporation (“GRC”) and Pioneer Credit Recovery (“PCR”), concentrated in the student loan industry; AFS
Holdings, LLC, the parent company of Arrow Financial Services, LLC (collectively, “AFS”), a debt management
company that purchases and services distressed debt in several industries including and outside of education
receivables; and GRP/AG Holdings, LLC (“GRP”), a debt management company that acquires and manages
portfolios of sub-performing and non-performing mortgage loans.
17
19. In recent years we have diversified our APG contingency revenue stream into the purchase of distressed
and defaulted receivables to complement our student loan business. We now have the expertise to acquire and
manage portfolios of sub-performing and non-performing mortgage loans, substantially all of which are
secured by one-to-four family residential real estate. We also have a servicing platform and a disciplined
portfolio pricing approach to several consumer debt asset classes.
APG Segment Timeline
January September
2002
July 2000 2004
GRC
USA Group AFS
1999 2000 2001 2002 2003 2004 2005 2006 2007
January August
2002 2005
PCR GRP
In 2007, our APG business segment had revenues totaling $605 million and net income of $116 million.
Our largest customer, USA Funds, accounted for 28 percent of our revenue in 2007.
Products and Services
Student Loan Default Aversion Services
We provide default aversion services for five guarantors, including the nation’s largest, USA Funds. These
services are designed to prevent a default once a borrower’s loan has been placed in delinquency status.
Defaulted Student Loan Portfolio Management Services
Our APG business segment manages the defaulted student loan portfolios for six guarantors under long-
term contracts. APG’s largest customer, USA Funds, represents approximately 17 percent of defaulted student
loan portfolios in the market. Our portfolio management services include selecting collection agencies and
determining account placements to those agencies, processing loan consolidations and loan rehabilitations, and
managing federal and state offset programs.
Contingency Collection Services
Our APG business segment is also engaged in the collection of defaulted student loans and other debt on
behalf of various clients including guarantors, federal agencies, schools, credit card issuers, utilities, and other
retail clients. We earn fees that are contingent on the amounts collected. We provide collection services for
ED and now have approximately 11 percent of the total market for such services. We have relationships with
more than 900 colleges and universities to provide collection services for delinquent student loans and other
receivables from various campus-based programs.
Collection of Purchased Receivables
In our APG business, we also purchase delinquent and defaulted receivables from credit originators and
other holders of receivables at a significant discount from the face value of the debt instruments. In addition,
we purchase sub-performing and non-performing mortgage receivables at a discount usually calculated as a
percentage of the underlying collateral. We use a combination of internal collectors and outside collection
agencies to collect on these portfolios, seeking to attain the highest cost/benefit for our overall collection
strategy. We recognize revenue primarily using the effective yield method, though we use the cost recovery
18
20. method when appropriate, in certain circumstances. A major success factor in the purchased receivables
business is the ability to effectively price the portfolios. We conduct both quantitative and qualitative analysis
to appropriately price each portfolio to yield a return consistent with our APG financial targets.
Competition
The private sector collections industry is highly fragmented with few large companies and a large number
of small scale companies. The APG businesses that provide third-party collections services for ED, FFELP
guarantors and other federal holders of defaulted debt are highly competitive. In addition to competing with
other collection enterprises, we also compete with credit grantors who each have unique mixes of internal
collections, outsourced collections, and debt sales. Although the scale, diversification, and performance of our
APG business has been a competitive advantage, the trend in the collections industry is for credit grantors to
sell portfolios rather than to manage contingency collections.
In the purchased paper business, the marketplace is trending more toward open market competitive
bidding rather than solicitation by sellers to a select group of potential buyers. Price inflation and the
availability of capital in the sector contribute to this trend. Unlike many of our competitors, our APG business
does not rely solely on purchased portfolio revenue. This enables us to maintain pricing discipline and
purchase only those portfolios that are expected to meet our profitability and strategic goals. Portfolios are
purchased individually on a spot basis or through contractual relationships with sellers to periodically purchase
portfolios at set prices. We compete primarily on price, and additionally on the basis of our reputation and
industry experience.
CORPORATE AND OTHER BUSINESS SEGMENT
The Company’s Corporate and Other business segment includes the aggregate activity of its smaller
operating segments, primarily its Guarantor Servicing, Loan Servicing, and Upromise operating segments.
Corporate and Other also includes several smaller products and services, including comprehensive financing
and loan delivery solutions to college financial aid offices and students to streamline the financial aid process.
Guarantor Services
We earn fees for providing a full complement of administrative services to FFELP guarantors. FFELP
student loans are guaranteed by these agencies, with ED providing reinsurance to the guarantor. The guarantors
are non-profit institutions or state agencies that, in addition to providing the primary guarantee on FFELP
loans, are responsible for other activities, including:
• guarantee issuance — the initial approval of loan terms and guarantee eligibility;
• account maintenance — the maintaining, updating and reporting on records of guaranteed loans;
• default aversion services — these services are designed to prevent a default once a borrower’s loan has
been placed in delinquency status (we perform these activities within our APG segment);
• guarantee fulfillment — the review and processing of guarantee claims;
• post claim assistance — assisting borrowers in determining the best way to pay off a defaulted loan; and
• systems development and maintenance — the development of automated systems to maintain compli-
ance and accountability with ED regulations.
Currently, we provide a variety of these services to nine guarantors and, in AY 2006-2007, we processed
$17.9 billion in new FFELP loan guarantees, of which $14.2 billion was for USA Funds, the nation’s largest
guarantor. We processed guarantees for approximately 32 percent of the FFELP loan market in AY 2006-2007.
Guarantor servicing fee revenue, which includes guarantee issuance and account maintenance fees, was
$156 million for the year ended December 31, 2007, 86 percent of which we earned from services performed
on behalf of USA Funds. Under some of our guarantee services agreements, including our agreement with
USA Funds, we receive certain scheduled fees for the services that we provide under such agreements. The
19
21. payment for these services includes a contractually agreed upon set percentage of the account maintenance
fees that the guarantors receive from ED.
The Company’s guarantee services agreement with USA Funds has a five-year term that will be
automatically increased by an additional year on October 1 of each year unless a prior notice is given by
either party.
Our primary non-profit competitors in guarantor servicing are state and non-profit guarantee agencies that
provide third-party outsourcing to other guarantors.
(See APPENDIX A, “FEDERAL FAMILY EDUCATION LOAN PROGRAM — Guarantor Funding” for
details of the fees paid to guarantors.)
Upromise
Upromise has a number of programs that encourage consumers to save for the cost of college education.
Upromise has established an affinity marketing program which is designed to increase consumer purchases of
merchant goods and services and to promote saving for college by consumers who are members of this
program. Merchant partners generally pay Upromise transaction fees based on member purchase volume,
either online or in stores depending on the contractual arrangement with the merchant partner. A percentage of
the consumer members’ purchases is set aside in an account maintained by Upromise on the members’ behalf.
Upromise, through its wholly owned subsidiaries, Upromise Investments, Inc. (“UII”), a registered
broker-dealer, and Upromise Investment Advisors, LLC (“UIA”), provides transfer and servicing agent services
and program management associated with various 529 college-savings plans. Upromise manages $19 billion in
529 college-savings plans.
REGULATION
Like other participants in the FFELP, the Company is subject to the HEA and, from time to time, to
review of its student loan operations by ED and guarantee agencies. ED is authorized under its regulations to
limit, suspend or terminate lenders from participating in the FFELP, as well as impose civil penalties if lenders
violate program regulations. The laws relating to the FFELP are subject to revision. In addition, Sallie Mae,
Inc., as a servicer of federal student loans, is subject to certain ED regulations regarding financial responsibil-
ity and administrative capability that govern all third-party servicers of insured student loans. Failure to satisfy
such standards may result in the loss of the government guarantee of the payment of principal and accrued
interest on defaulted FFELP loans. Also, in connection with our guarantor servicing operations, the Company
must comply with, on behalf of its guarantor servicing customers, certain ED regulations that govern guarantor
activities as well as agreements for reimbursement between the Secretary of Education and the Company’s
guarantor servicing customers. Failure to comply with these regulations or the provisions of these agreements
may result in the termination of the Secretary of Education’s reimbursement obligation.
The Company’s originating or servicing of federal and private student loans also subjects it to federal and
state consumer protection, privacy and related laws and regulations. Some of the more significant federal laws
and regulations that are applicable to our student loan business include:
• the Truth-In-Lending Act;
• the Fair Credit Reporting Act;
• the Equal Credit Opportunity Act;
• the Gramm-Leach Bliley Act; and
• the U.S. Bankruptcy Code.
20
22. APG’s debt collection and receivables management activities are subject to federal and state consumer
protection, privacy and related laws and regulations. Some of the more significant federal laws and regulations
that are applicable to our APG business include:
• the Fair Debt Collection Practices Act;
• the Fair Credit Reporting Act;
• the Gramm-Leach-Bliley Act; and
• the U.S. Bankruptcy Code.
In addition, our APG business is subject to state laws and regulations similar to the federal laws and
regulations listed above. Finally, certain APG subsidiaries are subject to regulation under the HEA and under
the various laws and regulations that govern government contractors.
Sallie Mae Bank is subject to Utah banking regulations as well as regulations issued by the Federal
Deposit Insurance Corporation, and undergoes periodic regulatory examinations.
Finally, Upromise’s affiliates, which administer 529 college-savings plans, are subject to regulation by the
Municipal Securities Rulemaking Board, the National Association of Securities Dealers, Inc. and the Securities
and Exchange Commission (“SEC”) through the Investment Advisers Act of 1940.
AVAILABLE INFORMATION
The SEC maintains an Internet site (http://www. sec. gov) that contains periodic and other reports such as
annual, quarterly and current reports on Forms 10-K, 10-Q and 8-K, respectively, as well as proxy and
information statements regarding SLM Corporation and other companies that file electronically with the SEC.
Copies of our annual reports on Form 10-K and our quarterly reports on Form 10-Q are available on our
website as soon as reasonably practicable after we electronically file such reports with the SEC. Investors and
other interested parties can also access these reports at www. salliemae.com/about/investors.
Our Code of Business Conduct, which applies to Board members and all employees, including our Chief
Executive Officer and Chief Financial Officer, is also available, free of charge, on our website at
www.salliemae.com/about/business_code. htm. We intend to disclose any amendments to or waivers from our
Code of Business Conduct (to the extent applicable to our Chief Executive Officer or Chief Financial Officer)
by posting such information on our website.
In 2007, the Company submitted the annual certification of its Chief Executive Officer regarding the
Company’s compliance with the NYSE’s corporate governance listing standards, pursuant to Section 303A.12(a)
of the NYSE Listed Company Manual.
In addition, we filed as exhibits to the Company’s Annual Report on Form 10-K for the year ended
December 31, 2006 and to this Annual Report on Form 10-K, the certifications required under Section 302 of
the Sarbanes-Oxley Act of 2002.
21
23. Item 1A. Risk Factors
LENDING BUSINESS SEGMENT — FFELP STUDENT LOANS
Because of the new FFELP economics resulting from the College Cost Reduction and Access Act of 2007
and the increased funding spreads in the current capital markets, we have made significant changes to our
business strategy, but there can be no assurance that such changes will be effective in meeting these
challenges.
On September 27, 2007, the College Cost Reduction and Access Act of 2007 (“CCRAA”) was signed
into law by the President. The CCRAA substantially reduced the profitability of our FFELP business,
including a reduction in Special Allowance Payments, the elimination of the Exceptional Performer designa-
tion and the corresponding reduction in default payments to 97 percent through 2012 and 95 percent thereafter,
an increase in the lender paid origination fees for certain loan types, and reduction in default collections
retention fees and account maintenance fees related to guaranty agency activities. As a result, assuming no
reductions to borrower benefits or to our operating and servicing costs, we expect that the CCRAA will reduce
substantially our pre-tax yield on FFELP loans. This reduction combined with higher financing costs resulting
from the severe dislocations in the global capital markets, could possibly eliminate the profitability of new
FFELP loan originations, while increasing our Risk Sharing in connection with our FFELP loan portfolio. We
also expect that low-balance FFELP Consolidation Loans will no longer be profitable.
As a result of these developments, management has revised its business strategy to:
• Focus on origination and acquisition activities for both FFELP loans and Private Education Loans that
generate acceptable returns under the new FFELP economics;
• Curtail unprofitable originations that have less strategic value, including:
• Education loans made to certain borrowers that have or are expected to have a high default rate
(see “GLOSSARY — Private Education Loans”); and
• Wholesale Consolidation Loan acquisitions and low-balance FFELP Consolidation Loan originations.
• Adjust the pricing of Private Education Loan products to reflect market conditions; and
• Reduce or, over time, eliminate borrower benefits on FFELP loans.
In addition, we have reduced the premium that we pay for FFELP loan volume at certain school-as-lender
clients. We also anticipate reducing the premium that we pay for FFELP loan volume with certain of our
lender partners. These actions are likely to effectively end our school-as-lender relationships and to result in
certain of our lender partners either exiting the FFELP business or seeking others with whom to partner. These
actions could also adversely affect the growth in our guarantee and APG collection businesses.
We also will undertake a comprehensive review of all of our business units with a goal of achieving
appropriate risk-adjusted returns across all of our business segments and providing cost-effective services. In
addition, we aim to reduce our operating expenses by up to 20 percent as compared to 2007 operating
expenses by year-end 2009, before adjusting for growth and other investments. Since year-end 2007, as part of
this expense reduction effort, we have reduced our work force by approximately three percent. Accordingly,
we could lose management that are key to managing operational risk.
There can be no assurance that changes we are making or may make in the future to address these
developments will be successful in meeting the significant challenges of the new FFELP economics and the
increased funding spreads in the current capital markets.
A larger than expected increase in third-party consolidation activity may reduce our loan spreads, materially
impair our Retained Interest, reduce our interest earning assets and otherwise materially adversely affect
our results of operations.
If third-party consolidation activity increases beyond management’s expectations, our student loan spread
may be adversely affected; our Retained Interest may be materially impaired; our future earnings may be
reduced from the loss of interest earning assets; and our results of operations may be adversely affected. Our
student loan spread may be adversely affected because third-party consolidators generally target our highest
yielding FFELP Loans and an increased run-off of Private Education Loans, which generally have higher
22
24. yields than our FFELP loans, would change the overall mix within our portfolio resulting in a reduction to our
weighted-average loan spread. Our Retained Interest may be materially impaired if consolidation activity
reaches levels not anticipated by management. We may also incur impairment charges if we increase our
expected future Constant Prepayment Rate (“CPR”) assumptions used to value the Residual Interest as a result
of such unanticipated levels of consolidation. The potentially material adverse affect on our operating results
related to FFELP loans also relates to our hedging activities in connection with Floor Income. We enter into
certain Floor Income Contracts under which we receive an upfront fee in exchange for our payment of the
Floor Income earned on a notional amount of underlying FFELP Loans over the life of the Floor Income
Contract. If third-party consolidation activity that involves refinancing a Sallie Mae managed existing FFELP
Loan with a new third-party owned FFELP Loan increases substantially, then the Floor Income that we are
obligated to pay under such Floor Income Contracts may exceed the Floor Income actually generated from the
underlying FFELP loans, possibly to a material extent. In such a scenario, we would either close out the
related Floor Income Contracts or purchase an offsetting hedge. In either case, the adverse impact on both our
GAAP and “Core Earnings” could be material. (See “MANAGEMENT’S DISCUSSION AND ANALYSIS OF
FINANCIAL CONDITION AND RESULTS OF OPERATIONS — LENDING BUSINESS SEGMENT —
Floor Income — Managed Basis.”)
Incorrect estimates and assumptions by management in connection with the preparation of our consolidated
financial statements could adversely affect the reported amounts of assets and liabilities and the reported
amounts of income and expenses.
The preparation of our consolidated financial statements requires management to make certain critical
accounting estimates and assumptions that could affect the reported amounts of assets and liabilities and the
reported amounts of income and expense during the reporting periods. (See “MANAGEMENT’S DISCUS-
SION AND ANALYSIS OF FINANCIAL CONDITION AND RESULTS OF OPERATIONS — CRITICAL
ACCOUNTING POLICIES AND ESTIMATES.”) For example, for both our federally insured and Private
Education Loans, the unamortized portion of premiums and discounts is included in the carrying value of the
student loan on the consolidated balance sheet. We recognize income on our student loan portfolio based on
the expected yield of the student loan after giving effect to the amortization of purchase premiums and
accretion of student loan income discounts, as well as the impact of Repayment Borrower Benefits. In arriving
at the expected yield, we make a number of estimates that when changed are reflected as a cumulative
catch-up from the inception of the student loan. The most sensitive estimate for premium and discount
amortization is the estimate of the CPR, which measures the rate at which loans in the portfolio pay before
their stated maturity. The CPR is used in calculating the average life of the portfolio. A number of factors can
affect the CPR estimate such as the rate of consolidation activity and default rates. If we make an incorrect
CPR estimate, the previously recognized income on our student loan portfolio based on the expected yield of
the student loan will need to be adjusted in the current period.
The amount of loan loss reserves also depends on estimates. We maintain an allowance for loan losses at
an amount believed to be sufficient to absorb losses incurred in our FFELP loan and Private Education Loan
portfolios based on estimated probable net credit losses as of the reporting date. We analyze those portfolios to
determine the effects that the various stages of delinquency have on borrower default behavior and ultimate
charge-off. When calculating the allowance for loan losses on Private Education Loans, we divide the portfolio
into categories of similar risk characteristics based on loan program type, loan status (in-school, grace,
repayment, forbearance, delinquency), underwriting criteria, existence or absence of a cosigner, and aging. We
use historical experience coupled with qualitative factors regarding changes in portfolio mix, macroeconomic
indicators, policies, procedures, laws, regulations, underwriting, and other factors to estimate default and
collection rate projections. We then apply these default and collection rate projections to each category of loan
to estimate the necessary allowance balance. Because the process relies on historical experience, if current or
future loan loss experience varies significantly from the past, our allowance could be deemed inadequate to
cover incurred losses in the portfolio. Additionally, since the allowance estimate is also reliant on other
qualitative factors, management’s ability to determine which qualitative factors are relevant to the allowance
and our ability to accurately incorporate these factors into our estimates can have a material impact on the
allowance.
23