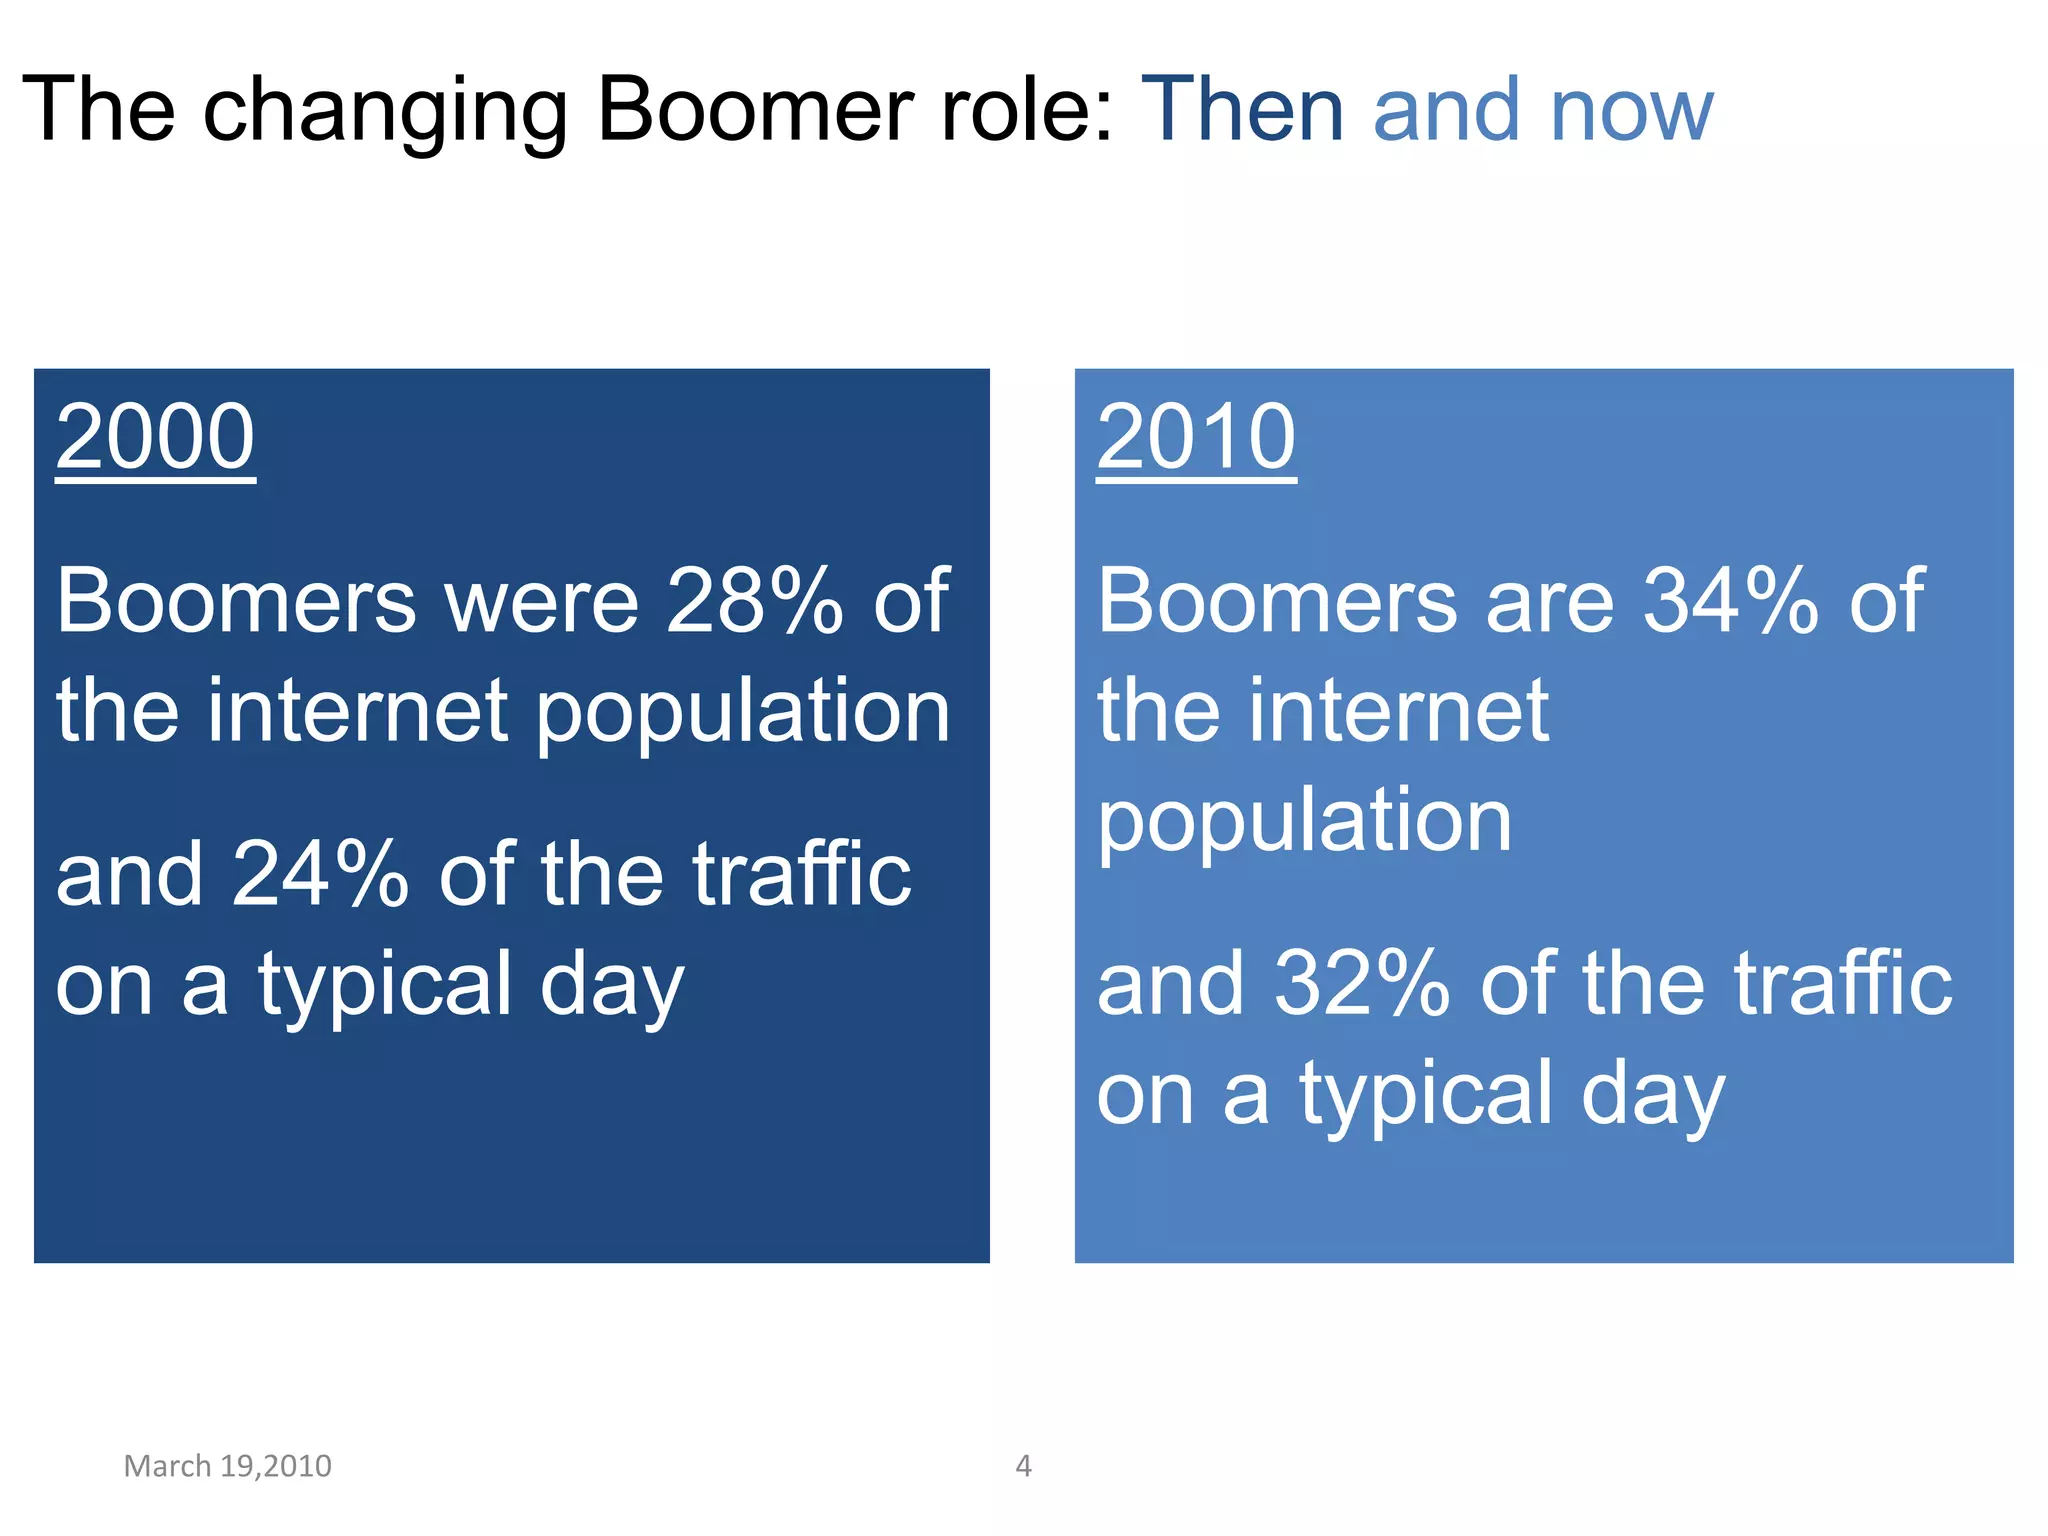
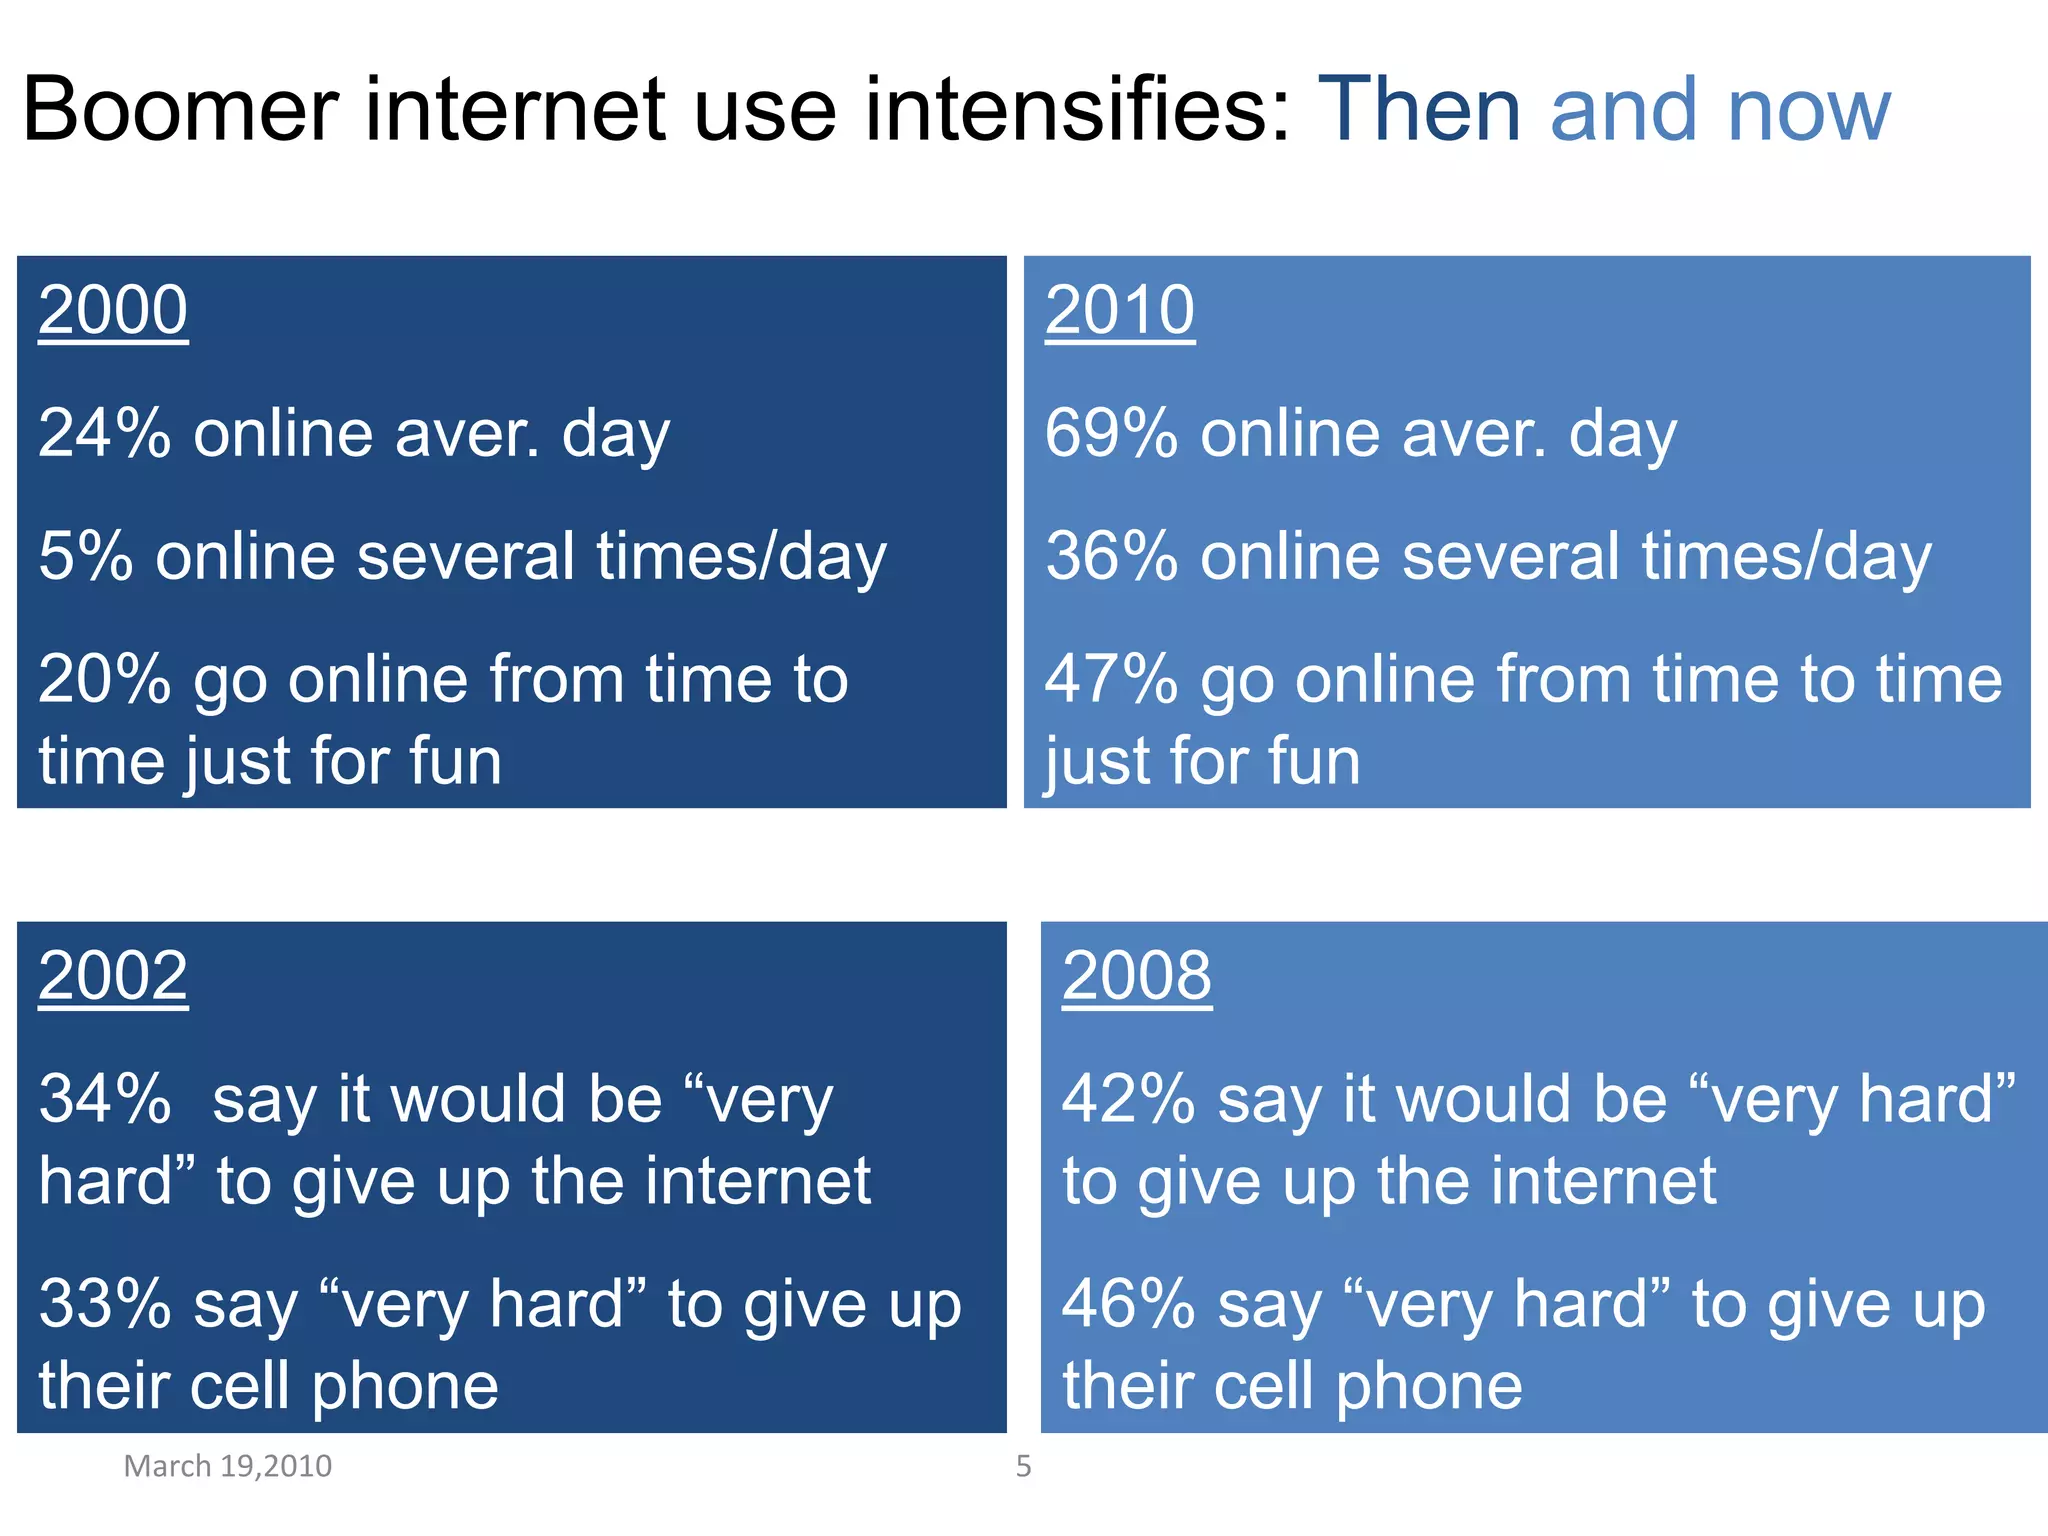
Future Ready: The New Retiree  Stephen Abram, MLSSLA Annual ConferenceEncore CaucusJune 14, 2011
These slides are available at Stephen’s Lighthouse blog
March 19,20103The changing Boomer audience: Thenand now200040% use internet<5% broadband at home34% own a cell phone0% connect to internet wirelessly<10% use “cloud” = slow, stationary connections that are built around my computer201074% use internet63% broadband at home81% own a cell phone46% connect to internet wirelessly>50% use “cloud”= fast, mobile connections that are moving to outside servers and storage
March 19,20104The changing Boomer role: Thenand now2000Boomers were 28% of the internet populationand 24% of the traffic on a typical day2010Boomers are 34% of the internet population and 32% of the traffic on a typical day
March 19,20105Boomer internet use intensifies: Thenand now200024% online aver. day5% online several times/day20% go online from time to time just for fun201069% online aver. day36% online several times/day 47% go online from time to time just for fun200234%  say it would be “very hard” to give up the internet33% say “very hard” to give up their cell phone200842% say it would be “very hard” to give up the internet46% say “very hard” to give up their cell phone
Boomers are often like other internet users
Boomers and e-commerce
Boomers and social media
1/28/20099Activity pyramid: Online pursuits by generationThe majority of teens and Gen Y use SNS, but fewer maintain blogs. Less than a fifth of online adults older than Gen X use SNS.While there are always exceptions, older generations typically do not engage with the internet past e-commerce.The vast majority of online adults from all generations uses email and search engines.Generations Online in 2009
1/28/200910Activity grid: Online pursuits by generationAbove this line, over 50% of internet users in the given generation engage in this online activity (see table on slide 10 for percentages)Generations Online in 2009
1/28/200911Activity diagram: Overall online pursuitsSource: Qualitatively based on the combination of activities pursued by the majority (at least 50%) of each generation, based on type of activity. See next slide for more detail.Generations Online in 2009
1/28/200912Table: Overall online pursuitsTypes of Activities:Generations Online in 2009
1/28/200913Generations in 2009Generations Online in 2009
1/28/200914Generations online in 2009Generations Online in 20091/28/2009
1/28/200915Americans online by ageChart 1: Percentage of Americans online by age (Teens, 12-17, Nov. 2007-Feb. 2008, margin of error = ±3%. Adults, December 2008, margins of error differ by subgroup. See methodology).Generations Online in 2009
1/28/200916Americans with home broadband by ageChart 2: Percentage of all Americans with broadband at home by age (Teens, 12-17, Nov. 2007-Feb. 2008, margin of error = ±3%. Adults, December 2008, margins of error differ by subgroup. See methodology.).Generations Online in 2009
1/28/200917Home internet users with broadband at homeChart 3: Percentage of home internet users with broadband at home (Teen internet users, 12-17, Nov. 2007-Feb. 2008, margin of error = ±4%. Adults, December 2008, margins of error differ by subgroup. See methodology.).Generations Online in 2009
1/28/200918Generational differences in online activitiesGenerations Online in 2009
1/28/200919MethodologyThe results of this survey are based on data from a series of telephone interviews conducted by Princeton Survey Research Associates International primarily between August 2006 and December 2008. For all results based on adult internet users, the margin of error is ±3%. For results based on teen internet users (ages 12-17), conducted in October-November, 2004, and October-November, 2006, the margin of error is ±4%. For results based on teen internet users, conducted in November 2007-February, 2008, the margin of error is ±3%. The margin of error for each generational subgroup shown in the table on page four and discussed throughout the report, however, can be considerably higher than that for the sample of all internet users. Below is a list of the average margins of error (MOE) for each age group listed in the table:Generations Online in 2009
Facilitated Discussion
What is Different?Approach to world.
5 and 10 To Go
Stephen Abram, MLS, FSLAVP strategic partnerships and marketsCengage Learning (Gale)Cel: 416-669-4855stephen.abram@cengage.comStephen’s Lighthouse Bloghttp://stephenslighthouse.comFacebook: Stephen AbramLinkedIn / Plaxo: Stephen AbramTwitter: sabramSlideShare: StephenAbram1

Sla encore2011

  • 1.
    Future Ready: TheNew Retiree Stephen Abram, MLSSLA Annual ConferenceEncore CaucusJune 14, 2011
  • 2.
    These slides areavailable at Stephen’s Lighthouse blog
  • 3.
    March 19,20103The changingBoomer audience: Thenand now200040% use internet<5% broadband at home34% own a cell phone0% connect to internet wirelessly<10% use “cloud” = slow, stationary connections that are built around my computer201074% use internet63% broadband at home81% own a cell phone46% connect to internet wirelessly>50% use “cloud”= fast, mobile connections that are moving to outside servers and storage
  • 4.
    March 19,20104The changingBoomer role: Thenand now2000Boomers were 28% of the internet populationand 24% of the traffic on a typical day2010Boomers are 34% of the internet population and 32% of the traffic on a typical day
  • 5.
    March 19,20105Boomer internetuse intensifies: Thenand now200024% online aver. day5% online several times/day20% go online from time to time just for fun201069% online aver. day36% online several times/day 47% go online from time to time just for fun200234% say it would be “very hard” to give up the internet33% say “very hard” to give up their cell phone200842% say it would be “very hard” to give up the internet46% say “very hard” to give up their cell phone
  • 6.
    Boomers are oftenlike other internet users
  • 7.
  • 8.
  • 9.
    1/28/20099Activity pyramid: Onlinepursuits by generationThe majority of teens and Gen Y use SNS, but fewer maintain blogs. Less than a fifth of online adults older than Gen X use SNS.While there are always exceptions, older generations typically do not engage with the internet past e-commerce.The vast majority of online adults from all generations uses email and search engines.Generations Online in 2009
  • 10.
    1/28/200910Activity grid: Onlinepursuits by generationAbove this line, over 50% of internet users in the given generation engage in this online activity (see table on slide 10 for percentages)Generations Online in 2009
  • 11.
    1/28/200911Activity diagram: Overallonline pursuitsSource: Qualitatively based on the combination of activities pursued by the majority (at least 50%) of each generation, based on type of activity. See next slide for more detail.Generations Online in 2009
  • 12.
    1/28/200912Table: Overall onlinepursuitsTypes of Activities:Generations Online in 2009
  • 13.
  • 14.
    1/28/200914Generations online in2009Generations Online in 20091/28/2009
  • 15.
    1/28/200915Americans online byageChart 1: Percentage of Americans online by age (Teens, 12-17, Nov. 2007-Feb. 2008, margin of error = ±3%. Adults, December 2008, margins of error differ by subgroup. See methodology).Generations Online in 2009
  • 16.
    1/28/200916Americans with homebroadband by ageChart 2: Percentage of all Americans with broadband at home by age (Teens, 12-17, Nov. 2007-Feb. 2008, margin of error = ±3%. Adults, December 2008, margins of error differ by subgroup. See methodology.).Generations Online in 2009
  • 17.
    1/28/200917Home internet userswith broadband at homeChart 3: Percentage of home internet users with broadband at home (Teen internet users, 12-17, Nov. 2007-Feb. 2008, margin of error = ±4%. Adults, December 2008, margins of error differ by subgroup. See methodology.).Generations Online in 2009
  • 18.
    1/28/200918Generational differences inonline activitiesGenerations Online in 2009
  • 19.
    1/28/200919MethodologyThe results ofthis survey are based on data from a series of telephone interviews conducted by Princeton Survey Research Associates International primarily between August 2006 and December 2008. For all results based on adult internet users, the margin of error is ±3%. For results based on teen internet users (ages 12-17), conducted in October-November, 2004, and October-November, 2006, the margin of error is ±4%. For results based on teen internet users, conducted in November 2007-February, 2008, the margin of error is ±3%. The margin of error for each generational subgroup shown in the table on page four and discussed throughout the report, however, can be considerably higher than that for the sample of all internet users. Below is a list of the average margins of error (MOE) for each age group listed in the table:Generations Online in 2009
  • 22.
  • 23.
  • 24.
  • 25.
    Stephen Abram, MLS,FSLAVP strategic partnerships and marketsCengage Learning (Gale)Cel: 416-669-4855stephen.abram@cengage.comStephen’s Lighthouse Bloghttp://stephenslighthouse.comFacebook: Stephen AbramLinkedIn / Plaxo: Stephen AbramTwitter: sabramSlideShare: StephenAbram1