Download to read offline

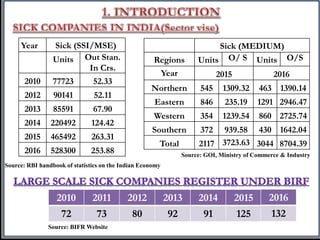
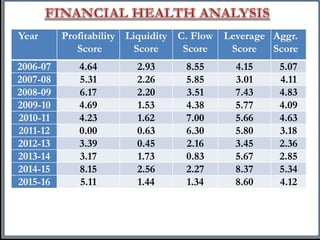
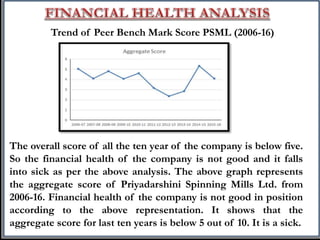
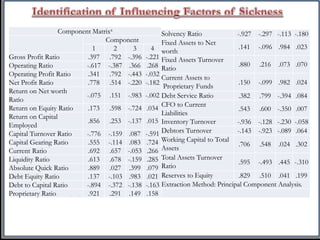
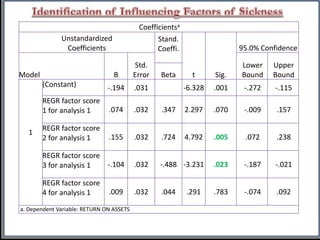
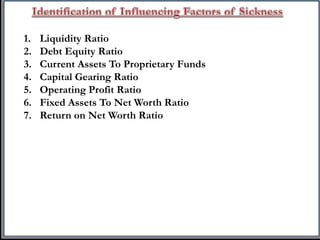
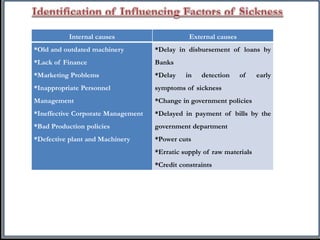


This study analyzed the financial health and factors influencing sickness of Priyadarshini Spinning Mills Ltd. over 2006-2016. Financial health analysis showed the company's overall score was below 5, indicating sickness. Multiple regression identified 7 key factors influencing sickness, including liquidity ratio, debt equity ratio, and current assets to proprietary funds. The study concludes the company has weak profitability and liquidity that represents sickness, and identifies both internal and external causes of its financial problems.


