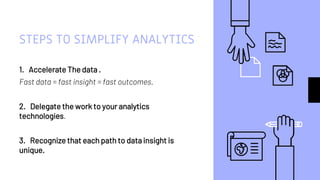
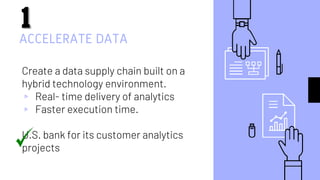
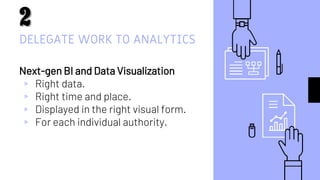
Take a look at this interesting presentation on ➡ 3 Pillars to become successful with your analytics strategy
Inculcate a culture of analytics, have the right people on-board, get your organization strategy on one page, and have the right architecture and data management strategies in place.
Link: https://bit.ly/2BanJcW
This presentation is based on the article Simplify Your Analytics Strategy by Narendra Mulani.I have made this presentation
as a part of my data internship course
This is the analysis report of the HCS done as the part of the Data Analytics & Managerial relavance internship under the guidance of the Prof. Sameer Mathur(Ph.D,Carnige Mellon)IIM_LUCKNOW
Data Analytics with Managerial Applications InternshipJahanvi Khedwal
Data Analytics with Managerial Applications Internship under Prof. Sameer Mathur-Making Advanced Analytics Work for You by Dominic Barton and David Court-presentation
Organizations are making analytics the highest-priority
innovative technology. It’s no wonder why. The demands
placed upon businesses today are unprecedented. To
succeed in this volatile environment companies will have
to use analytics continuously. Top performing companies
have implemented the next generation of analytics with
more intuitive real-time information and presentation
through visualization for discovery and exploration.
This presentation contains the key ideas from the article "Simplify your analytics strategy" by Narendra Mulani published in HBR. This presentation is a part of my internship under Prof. Sameer Mathur, IIM-L
DI&A Slides: Descriptive, Prescriptive, and Predictive AnalyticsDATAVERSITY
Data analysis can be divided into descriptive, prescriptive and predictive analytics. Descriptive analytics aims to help uncover valuable insight from the data being analyzed. Prescriptive analytics suggests conclusions or actions that may be taken based on the analysis. Predictive analytics focuses on the application of statistical models to help forecast the behavior of people and markets.
This webinar will compare and contrast these different data analysis activities and cover:
- Statistical Analysis – forming a hypothesis, identifying appropriate sources and proving / disproving the hypothesis
- Descriptive Data Analytics – finding patterns
- Predictive Analytics – creating models of behavior
- Prescriptive Analytics – acting on insight
- How the analytic environment differs for each
The New Self-Service Analytics - Going Beyond the ToolsKatherine Gabriel
In today’s business climate, using data to make quick decisions is a common ask across organizations. To fulfill such asks business users want more, faster, and better access to data and analytic tools. IT wants to balance this need for speed with the responsibility to protect the data assets from security, privacy, and quality risks. A common solution to this scenario is self-service BI or self-service analytics. Chances are you are already using self-service BI in some way, shape, or form or have heard a pitch from an analytic tool vendor!
Self-service BI has been around for several decades and yet business users keep asking for more and more. Has self-service BI failed to deliver on its promise? Is it time to revisit what self-service really means? How can business and IT work together to achieve better decision-making outcomes for their organization?
We cover:
• How to demystify what self-service analytics means
• New trends driving the self-service analytics evolution
• Best practices and lessons learned from real-life examples
• Recommendations for making progress within your organization
Advance your self-service journey.
Guided Analytics vs. Self-Service BI: Choose Your Path to Data-driven Success!Polestar Solutions
Empower your organization with the right analytics approach—Guided Analytics or Self-Service Business Intelligence (BI)—to unlock the true potential of your data. Discover the benefits and find your perfect fit, whether you prefer expert-guided insights or self-exploration, enabling your team to make data-driven decisions and drive transformative outcomes.
Table of ContentsIntroduction. 2Summary of the busines.docxjohniemcm5zt
Table of Contents
Introduction
.
2
Summary of the business
.
3
Benefits and disadvantages of Business Analytics
.
3
Challenges that the organization may face using business analytics.
5
Business Analytic Techniques That the organization Can Use
.
6
The Implementation Plan
.
7
Backup plan
.
8
Conclusion
.
8
References
.
9
Introduction
Analytics refers to discovering, interpreting and communicating important patterns in collected data. Analytics has been used in organizations since exercises in managements were put into place by Frederick Winslow Taylor in the late 19th century.
Today, with the introduction of computers in day to day running of businesses, organizations and most of the institutions, the use of analytics has been brought to a whole new level. These consequential patterns can help in decision making in different scenarios.
Business analytics refers to the proficient use of technologies in continuously exploring and investigating past business performance so as to make inferences and help in business planning and decisions. Predictive modeling and statistical methods are extensively utilized to help the management in making this decision.
Business analytics are applicable in a wide range of business and organization scenarios to help in making management decisions. Business analytics has been changed the way businesses look at their key indicators of performance.
The business analyst has responsibilities in the following areas:
They help in identifying the technical actions that would address a certain situations, also supports in delivering the business strategies.
They help in defining procedures they will use in organizations.
They help in supporting the implementations and operations of strategic plans.
They refine the techniques once they have implemented in order to tolerate changes while ensuring continued alignment with the business strategy.
Business Description
The firm is involved in the design. Design firms make designs to clients to meet their (clients) needs.
The business analytics can use different methods analytical techniques. For example, the orders for particular graphic designs vary seasonally due to upcoming promotions and holiday season. The firm should use business analytics to know when in the past they experience different designing orders. The firm should use business analytics to analyze data so that it can be able to make informed decisions.
The organization possesses technological equipment’s but they do have any integrated system. The business should use analytics to connect its databases for easy access and efficiency of information flow.
The firm should also use business analytics to predict how the business would perform in a new environment it wishes to venture into. It would analyse all the factors that would seemingly impact its operations and success in the new environment.
Benefits and disadvantages of Business Analytics
Benefits
Business analytics creates a better .
Many internal audit departments are investing in data analytics, but are struggling to fully realize the anticipated benefits. By avoiding common pitfalls and implementing data analytics holistically throughout the department, stalled analytics programs can be restarted, or new programs more successfully implemented.
Quantitative Data AnalysisReliability Analysis (Cronbach Alpha) Common Method...2023240532
Quantitative data Analysis
Overview
Reliability Analysis (Cronbach Alpha)
Common Method Bias (Harman Single Factor Test)
Frequency Analysis (Demographic)
Descriptive Analysis
Adjusting primitives for graph : SHORT REPORT / NOTESSubhajit Sahu
Graph algorithms, like PageRank Compressed Sparse Row (CSR) is an adjacency-list based graph representation that is
Multiply with different modes (map)
1. Performance of sequential execution based vs OpenMP based vector multiply.
2. Comparing various launch configs for CUDA based vector multiply.
Sum with different storage types (reduce)
1. Performance of vector element sum using float vs bfloat16 as the storage type.
Sum with different modes (reduce)
1. Performance of sequential execution based vs OpenMP based vector element sum.
2. Performance of memcpy vs in-place based CUDA based vector element sum.
3. Comparing various launch configs for CUDA based vector element sum (memcpy).
4. Comparing various launch configs for CUDA based vector element sum (in-place).
Sum with in-place strategies of CUDA mode (reduce)
1. Comparing various launch configs for CUDA based vector element sum (in-place).
Chatty Kathy - UNC Bootcamp Final Project Presentation - Final Version - 5.23...John Andrews
SlideShare Description for "Chatty Kathy - UNC Bootcamp Final Project Presentation"
Title: Chatty Kathy: Enhancing Physical Activity Among Older Adults
Description:
Discover how Chatty Kathy, an innovative project developed at the UNC Bootcamp, aims to tackle the challenge of low physical activity among older adults. Our AI-driven solution uses peer interaction to boost and sustain exercise levels, significantly improving health outcomes. This presentation covers our problem statement, the rationale behind Chatty Kathy, synthetic data and persona creation, model performance metrics, a visual demonstration of the project, and potential future developments. Join us for an insightful Q&A session to explore the potential of this groundbreaking project.
Project Team: Jay Requarth, Jana Avery, John Andrews, Dr. Dick Davis II, Nee Buntoum, Nam Yeongjin & Mat Nicholas
Adjusting OpenMP PageRank : SHORT REPORT / NOTESSubhajit Sahu
For massive graphs that fit in RAM, but not in GPU memory, it is possible to take
advantage of a shared memory system with multiple CPUs, each with multiple cores, to
accelerate pagerank computation. If the NUMA architecture of the system is properly taken
into account with good vertex partitioning, the speedup can be significant. To take steps in
this direction, experiments are conducted to implement pagerank in OpenMP using two
different approaches, uniform and hybrid. The uniform approach runs all primitives required
for pagerank in OpenMP mode (with multiple threads). On the other hand, the hybrid
approach runs certain primitives in sequential mode (i.e., sumAt, multiply).
Techniques to optimize the pagerank algorithm usually fall in two categories. One is to try reducing the work per iteration, and the other is to try reducing the number of iterations. These goals are often at odds with one another. Skipping computation on vertices which have already converged has the potential to save iteration time. Skipping in-identical vertices, with the same in-links, helps reduce duplicate computations and thus could help reduce iteration time. Road networks often have chains which can be short-circuited before pagerank computation to improve performance. Final ranks of chain nodes can be easily calculated. This could reduce both the iteration time, and the number of iterations. If a graph has no dangling nodes, pagerank of each strongly connected component can be computed in topological order. This could help reduce the iteration time, no. of iterations, and also enable multi-iteration concurrency in pagerank computation. The combination of all of the above methods is the STICD algorithm. [sticd] For dynamic graphs, unchanged components whose ranks are unaffected can be skipped altogether.
Data Centers - Striving Within A Narrow Range - Research Report - MCG - May 2...pchutichetpong
M Capital Group (“MCG”) expects to see demand and the changing evolution of supply, facilitated through institutional investment rotation out of offices and into work from home (“WFH”), while the ever-expanding need for data storage as global internet usage expands, with experts predicting 5.3 billion users by 2023. These market factors will be underpinned by technological changes, such as progressing cloud services and edge sites, allowing the industry to see strong expected annual growth of 13% over the next 4 years.
Whilst competitive headwinds remain, represented through the recent second bankruptcy filing of Sungard, which blames “COVID-19 and other macroeconomic trends including delayed customer spending decisions, insourcing and reductions in IT spending, energy inflation and reduction in demand for certain services”, the industry has seen key adjustments, where MCG believes that engineering cost management and technological innovation will be paramount to success.
MCG reports that the more favorable market conditions expected over the next few years, helped by the winding down of pandemic restrictions and a hybrid working environment will be driving market momentum forward. The continuous injection of capital by alternative investment firms, as well as the growing infrastructural investment from cloud service providers and social media companies, whose revenues are expected to grow over 3.6x larger by value in 2026, will likely help propel center provision and innovation. These factors paint a promising picture for the industry players that offset rising input costs and adapt to new technologies.
According to M Capital Group: “Specifically, the long-term cost-saving opportunities available from the rise of remote managing will likely aid value growth for the industry. Through margin optimization and further availability of capital for reinvestment, strong players will maintain their competitive foothold, while weaker players exit the market to balance supply and demand.”
3. WHAT
TO DO ?
Companies should
pursue a simpler and
systematically
structured path to
uncover the insights
from their data.
3
4. STEPS TO SIMPLIFY ANALYTICS
1. Accelerate The data .
Fast data = fast insight = fast outcomes.
2. Delegate the work to your analytics
technologies.
3. Recognize that each path to data insight is
unique.
4
5. ACCELERATE DATA
Create a data supply chain built on a
hybrid technology environment.
▹ Real- time delivery of analytics
▹ Faster execution time.
U.S. bank for its customer analytics
projects
5
6. DELEGATE WORK TO ANALYTICS
Next-gen BI and Data Visualization
▹ Right data.
▹ Right time and place.
▹ Displayed in the right visual form.
▹ For each individual authority.
6
7. DELEGATE WORK TO ANALYTICS
Data discovery
▹ Side-project.
▹ Test data to uncover patterns that
are not clearly evident.
▹ More discovery = More
opportunities.
7
8. DELEGATE WORK TO ANALYTICS
Analytics applications
▹ Applications can simplify
advanced analytics.
▹ Industry specific and tailored
apps.
8
9. DELEGATE WORK TO ANALYTICS
Machine learning and cognitive
computing
▹ Removes much of the human
element from the data modeling
process.
▹ Allows software intelligence to
make even better-informed
decisions.
9
10. RECOGNIZE EACH UNIQUE PATH
▹ Analytics include many different
elements.
▹ Business nature based approach.
■ Known problem with known
solution.
■ Known problem with unknown
solution.
1
0
11. INSIGHTS
Companies need not to be
cautious about incorporating
analytics because of the complex
nature but rather follow a
structured simple method.
Through this, one can add value to
their organization keeping their
main focus over their important
functions instead trying to analyze
the analytics.
1
1
12. INSIGHTS
The systematic approach to analytics
include few simple paths. First,
companies should create a data supply
chain on hybrid-tech environment with
real-time delivery of analytics. Second,
they need to entrust work to analytics
technologies with the help of real-time
data visualization apps and machine
learning. Finally, companies need to
distinguish different elements of
analytics based on the business
problem and tackle it with either
known hypothesis based approach or
look for any patterns in data.
1
2
14. Data Analytics is still a new concept (in India) and many usually find it
pretty complex. Managers need to ensure that its complexity does not
cost their organization too much resources and time. Managers needs
to set a structured and simple method for its incorporation by
following the discussed steps and try to exploit it upto its potential.
Managers need to focus on data supply chain and integrate next-gen
analytics and visualization tools for its easy use. Exploiting data will
lead to push the decision making down the heirarchy line and make
organization more efficient and capable .