Download as PDF, PPTX


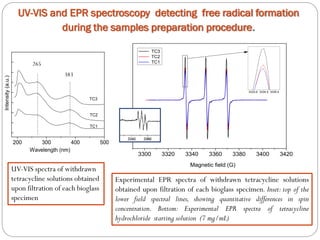
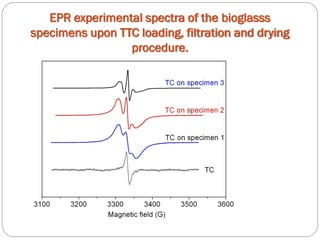
![Tetracycline hydrochloride may act as a chemical spin trap.
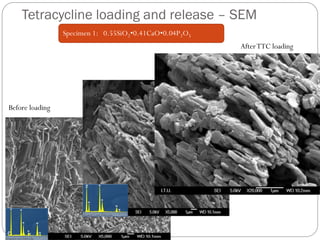
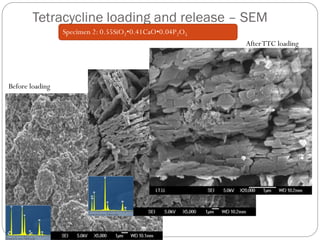
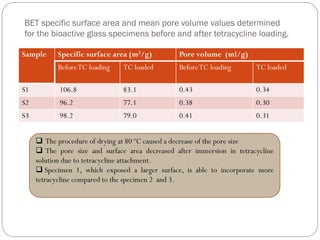
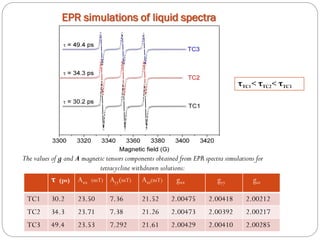
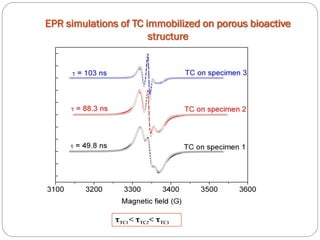
EPR and UV/VIS spectroscopy have shown that the specimen with a larger surface are is able to incorporate more tetracycline.
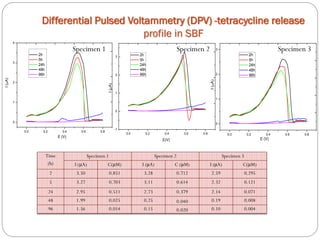
The maximum TC amount was released after 2 h, and thereafter the release continued slightly for 24 h, followed by a drastic diminution after 48 h.
The pores size modification and specific surface area after tetracycline loading seems to be the main factor in tetracycline controlled released process.
Similar results were obtained for different pharmaceutical compounds: hydrocortisone, propolis, β-cyclodextrin[ Z.R. Domingues& all, Biomaterials 25 (2004) 327–333; A. L. Andrade & all, Journal of Non-Crystalline Solids 355 (2009) 811– 816]. Observations](https://image.slidesharecdn.com/simonacavaluapmas2014-140912105203-phpapp01/85/Simona-cavalu-apmas2014-27-320.jpg)
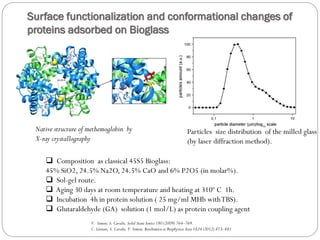
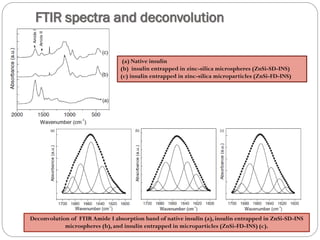
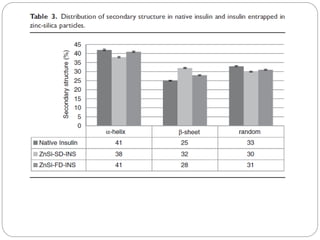
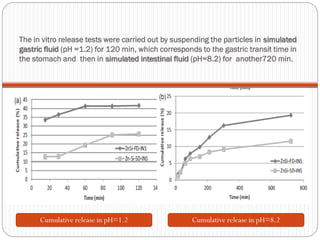
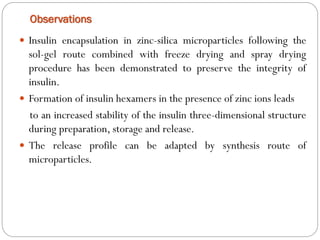


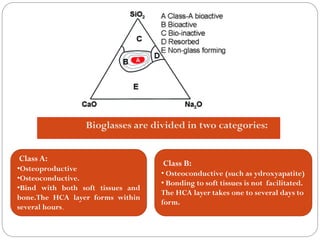
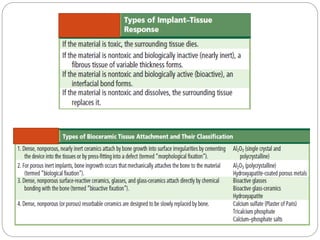
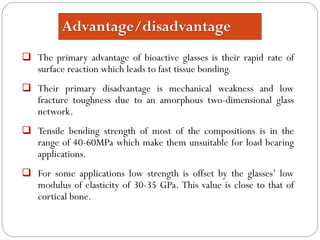
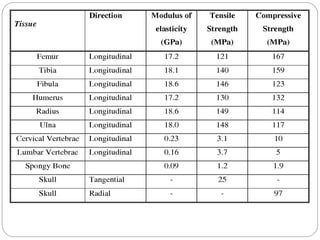
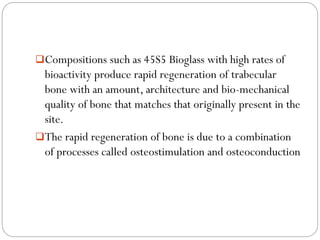
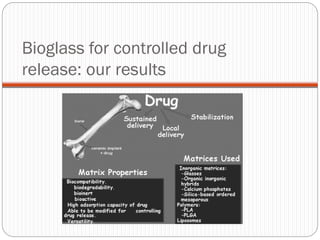
The document discusses the development and applications of bioceramics, particularly bioglass, for hard tissue replacement and drug delivery. It highlights the properties, advantages, and disadvantages of different bioglass compositions, focusing on their rapid tissue bonding and the challenges of mechanical strength. Additionally, it details the methods for drug encapsulation and the controlled release of pharmaceuticals, emphasizing studies on tetracycline and insulin microencapsulation for targeted applications.


