SIM Equity Research Project - Spring 2014 - CCK - Martin Smith
1. Closing Price
(as of 3/28/2014)
$43.87
Market
Cap
$6.0B
Dividend Yield
0.00%
Price
Target
$36.00
Projected
Return
-17.9%
SIM
Rating
SELL
$36
$38
$40
$42
$44
$46
Mar-13
May-13
Jul-13
Sep-13
Nov-13
Jan-14
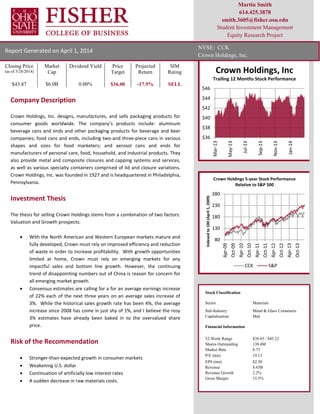
Crown Holdings, Inc
Trailing 12 Months Stock Performance
80
130
180
230
280
Apr-09
Oct-09
Apr-10
Oct-10
Apr-11
Oct-11
Apr-12
Oct-12
Apr-13
Oct-13
Indexedto100(April1,2009)
Crown Holdings 5-year Stock Performance
Relative to S&P 500
CCK S&P
Report Generated on April 1, 2014
NYSE: CCK
Crown Holdings, Inc.
Martin Smith
614.425.3878
smith.3605@fisher.osu.edu
Student Investment Management
Equity Research Project
Company Description
Crown Holdings, Inc. designs, manufactures, and sells packaging products for
consumer goods worldwide. The company’s products include: aluminum
beverage cans and ends and other packaging products for beverage and beer
companies; food cans and ends, including two-and three-piece cans in various
shapes and sizes for food marketers; and aerosol cans and ends for
manufacturers of personal care, food, household, and industrial products. They
also provide metal and composite closures and capping systems and services,
as well as various specialty containers comprised of lid and closure variations.
Crown Holdings, Inc. was founded in 1927 and is headquartered in Philadelphia,
Pennsylvania.
Investment Thesis
The thesis for selling Crown Holdings stems from a combination of two factors:
Valuation and Growth prospects.
With the North American and Western European markets mature and
fully developed, Crown must rely on improved efficiency and reduction
of waste in order to increase profitability. With growth opportunities
limited at home, Crown must rely on emerging markets for any
impactful sales and bottom line growth. However, the continuing
trend of disappointing numbers out of China is reason for concern for
all emerging market growth.
Consensus estimates are calling for a for an average earnings increase
of 22% each of the next three years on an average sales increase of
3%. While the historical sales growth rate has been 4%, the average
increase since 2008 has come in just shy of 1%, and I believe the rosy
3% estimates have already been baked in to the overvalued share
price.
Risk of the Recommendation
Stronger-than-expected growth in consumer markets
Weakening U.S. dollar
Continuation of artificially low interest rates
A sudden decrease in raw materials costs.
Stock Classification
Sector Materials
Sub-Industry Metal & Glass Containers
Capitalization Mid
Financial Information
52-Week Range $38.85 / $45.22
Shares Outstanding 138.4M
Market Beta 0.73
P/E (ttm) 19.13
EPS (ttm) $2.30
Revenue 8.65B
Revenue Growth 2.2%
Gross Margin 15.5%
2. CCK: Crown Holdings, Inc. – Equity Research Project Martin Smith
Student Investment Management Spring 2014 Page 2 of 20
Table of Contents
Company Description ................................................................................................................................................................................................................ 1
Investment Thesis ..................................................................................................................................................................................................................... 1
Risk of the Recommendation..................................................................................................................................................................................................... 1
Company Overview......................................................................................................................................................................................................................... 3
Operating Segments.................................................................................................................................................................................................................. 3
Aerosol Packaging .............................................................................................................................................................................................................................3
Beverage Packaging...........................................................................................................................................................................................................................3
Food Packaging and Closures............................................................................................................................................................................................................4
Specialty Packaging ...........................................................................................................................................................................................................................5
Business Segments .................................................................................................................................................................................................................... 5
Americas Beverage............................................................................................................................................................................................................................5
North America Food..........................................................................................................................................................................................................................5
European Beverage...........................................................................................................................................................................................................................5
European Food..................................................................................................................................................................................................................................6
Asia Pacific ........................................................................................................................................................................................................................................6
Non-Reportable Segments................................................................................................................................................................................................................6
Competitive Advantage ............................................................................................................................................................................................................. 6
The Customer is Always Right ...........................................................................................................................................................................................................6
Location, Location, Location..............................................................................................................................................................................................................7
Recent News and Share Performance ........................................................................................................................................................................................ 7
Investment Thesis ........................................................................................................................................................................................................................... 8
Key Fundamental and Economic Drivers .................................................................................................................................................................................... 8
North America...................................................................................................................................................................................................................................8
International .....................................................................................................................................................................................................................................8
Financial Analysis ...................................................................................................................................................................................................................... 8
Revenue ............................................................................................................................................................................................................................................8
Operating Margins ............................................................................................................................................................................................................................9
Share Buyback...................................................................................................................................................................................................................................9
Peer Comparison...............................................................................................................................................................................................................................9
Liquidity Analysis...............................................................................................................................................................................................................................9
Discounted Cash Flow Analysis ................................................................................................................................................................................................ 10
Multiple Analysis..................................................................................................................................................................................................................... 10
Relative to the S&P 500 Benchmark................................................................................................................................................................................................10
Relative to its Sector .......................................................................................................................................................................................................................10
Relative to its Industry ....................................................................................................................................................................................................................11
Crown Multiples Evaluation ............................................................................................................................................................................................................11
Risks to the Recommendation ................................................................................................................................................................................................. 12
External Risks ..................................................................................................................................................................................................................................12
Conclusion .................................................................................................................................................................................................................................... 14
Recommendation.......................................................................................................................................................................................................................... 14
Appendixes ................................................................................................................................................................................................................................... 15
Appendix 1: Forecast of Income Statement............................................................................................................................................................................. 15
A. Income Statement...............................................................................................................................................................................................................15
B. Detailed Breakdown of Income Statement .........................................................................................................................................................................16
Appendix 2: Select Balance Sheet a Cash Flow Figures............................................................................................................................................................. 17
Appendix 3: Discounted Cash Flow Analysis ............................................................................................................................................................................ 18
Appendix 4: Sensitivity Analysis.............................................................................................................................................................................................. 19
A. Price Target Sensitivity Analysis ..........................................................................................................................................................................................19
B. Potential Upside / Downside Sensitivity Analysis ................................................................................................................................................................19
Sources......................................................................................................................................................................................................................................... 20
3. CCK: Crown Holdings, Inc. – Equity Research Project Martin Smith
Student Investment Management Spring 2014 Page 3 of 20
Company Overview
In 1891, William Painter invented the crown cap for
bottling carbonated beverages. The following year,
he founded the Crown Cork and Seal Company in
Baltimore, Maryland and set out to convince
bottlers that his cap was ideal for their product.
Crown Cork and Seal thrived in the early years,
expanding manufacturing into Europe, South
America, and Asia by 1906. In 1927, Crown Cork
and Seal merged with the New Process Cork
Company creating Crown Holdings, Inc. (hereby
known as Crown or “the Company”).
In the 1930’s, Crown commanded more than half
of the world’s market share for bottle caps. The
company acquired Acme Can Company of
Philadelphia and entered the tin can business in
1936, further expanding its footprint. However,
the expansive growth and profitability slowed, and
by 1957 Crown was on the verge of bankruptcy
from a series of poor diversification moves. John
Connelly, a former supplier to Crown, acquired
control of the company.
In just one year’s time, Connelly orchestrated the
beginnings of a miraculous turnaround, moving the
corporate headquarters to Philadelphia, paring
down the size of the organization, and
implementing stringent economies. In five short
years, Connelly had achieved a 1,646% increase in
profits on a relatively insignificant sales increase. A
$100 investment in Crown in 1957 would be worth
approximately $66,000 today; proof of the
leadership present in the office of the CEO.
Operating Segments
Crown Holdings operates its business in four
segments: Aerosol Packaging, Beverage Packaging,
Food Packaging and Closures, and Specialty
Packaging.
Aerosol Packaging
The Company’s customers for aerosol cans and
ends include manufacturers of personal care, food,
household, and industrial products. Some of these
companies include Colgate Palmolive, KIK Custom,
Procter & Gamble, SC Johnson, and Unilever. The
aerosol can business is highly competitive, so
Crown competes by offering its customers a broad
range of products including multiple sizes, multiple
color schemes, and shaped packaging.
Beverage Packaging
The Company supplies beverage cans and ends and
other packaging products to a variety of beverage
and beer companies, including Anheuser-Busch
InBev, Carlsberg, Coca-Cola, Cott Beverages, Dr
Pepper Snapple Group, Heineken, National
Beverage, and Pepsi-Cola. Crown’s beverage
business is built around local, regional and global
markets, which has served to develop their
understanding of global consumer expectations.
4. CCK: Crown Holdings, Inc. – Equity Research Project Martin Smith
Student Investment Management Spring 2014 Page 4 of 20
The beverage market is dynamic and highly
competitive, with each packaging manufacturer
working with its customers to satisfy consumers’
ever-changing needs. Crown competes by offering
its customers broad market knowledge, resources
at all levels of its worldwide organization, and
extensive research and development capabilities
that have enabled the Company to provide its
customers with innovative products. They meet
their customers’ beverage packaging needs with an
array of two-piece beverage cans and ends, and
metal bottle caps. Innovations include the
SuperEnd® beverage can end, shaped beverage
cans which include size differentiation, such as slim
line cans for low calorie products or larger sizes for
high volume consumption.
Beverage can manufacturing is capital intensive,
requiring significant investment in tools and
machinery. Crown is currently seeking to
effectively manage its invested capital while also
continuing its research and development efforts to
reduce can and end diameter, lighten the metal
content of its cans, reduce non-metal costs, and
reduce water and energy usage while improving
production processes.
Food Packaging and Closures
The Company manufactures a variety of food cans
and ends, including two and three-piece cans in
numerous shapes and sizes. They sell these food
cans to food marketers such as Bonduelle, Cecab,
Mars, Simmons Foods, Nestlé, Princes Group and
Stockmeyer. The Company offers a wide variety of
metal vacuum closures and sealing equipment
solutions to leading marketers such as Abbot
Laboratories, Danone, H. J. Heinz, Nestlé, Premier
Foods, and Unilever. Crown supplies total
packaging solutions, including metal and composite
closures, and capping systems and services.
Additionally the Company works closely with
customers, retailers, and glass and plastic container
manufacturers to develop innovative closure
solutions and meet customer requirements.
Technologies used to produce food cans include
three-piece welded, two-piece drawn and wall-
0 1000 2000 3000
Amercas Beverage
North America Food
European Beverage
European Food
Asia Pacific
Non-Reportable
Segments
Sales (in Millions of Dollars)
Sales by Reportable Segment
2011 2012 2013
-15%
-10%
-5%
0%
5%
10%
15%
20%
25%
2011 2012 2013
Sales Growth by Reportable Setment
Amercas
Beverage
North America
Food
European
Beverage
European Food
Asia Pacific
Non-Reportable
Segments
5. CCK: Crown Holdings, Inc. – Equity Research Project Martin Smith
Student Investment Management Spring 2014 Page 5 of 20
ironed, as well as two-piece drawn and redrawn.
The Company also offers its LIFTOFF™ series of
food ends, including its Easylift™ full aperture steel
food can ends, and PeelSeam™, a flexible
aluminum foil laminated end.
Crown offers expertise in closure design and
decoration, ranging from quality printing in up to
nine colors, to inside-the-cap printing, which offers
customers new promotional possibilities. The
Company’s commitment to innovation has led to
developments in packaging materials, surface
finishes, can shaping, lithography, filling, sealing
and opening techniques, and improved
environmental performance. The Company
manufactures easy-to-open, vacuum sealed, and
traditional can ends for a large variety of heat-
processed and dry food products including fruits
and vegetables, meat, seafood, soups, ready-made
meals, infant formula, coffee, and pet food.
Specialty Packaging
The Company’s specialty packaging business is
primarily located in Europe and Asia. They produce
a wide variety of specialty containers with
numerous lid and closure variations. The
Company’s specialty packaging customers include
Abbott Laboratories, Akzo Nobel, Britvic, Kraft,
Mars, Nestlé, Nippon Paints, PPG, Tikkurlia Oy and
United Biscuits.
Business Segments
The company’s activities are usually divided into
five reportable business segments and one non-
reportable segment which contribute differently to
the overall performance of Crown: Americas
Beverage, North America Food, European
Beverage, European Food, and Asia Pacific.
Americas Beverage
The Americas Beverage segment manufactures
aluminum beverage cans and ends and steel
crowns and supplies a variety of customers from its
operations in the U.S., Brazil, Canada, Colombia,
and Mexico. The U.S. and Canadian beverage can
markets are mature markets which have
experienced slightly declining volumes in recent
years. In Brazil, the Company's sales unit volumes
have increased in recent years primarily due to
market growth. Crown recently began
construction on a new facility in northern Brazil
and expects to begin commercial shipments in the
first half of 2014.
North America Food
The North America Food segment manufactures
steel and aluminum food cans and ends and metal
vacuum closures. From their manufacturing
facilities they are able to supply a variety of
customers with operations in the U.S. and Canada.
The North American food can and closures market
is a mature market which has experienced stable to
slightly declining volumes in recent years.
European Beverage
The Company's European Beverage segment
manufactures steel and aluminum beverage cans
and ends, and supplies a variety of customers from
its operations throughout Eastern and Western
Europe, the Middle East, and North Africa. In
recent years, the European beverage can market
6. CCK: Crown Holdings, Inc. – Equity Research Project Martin Smith
Student Investment Management Spring 2014 Page 6 of 20
has been growing at approximately 4.7%, with
beverage cans increasing from 52% of total
revenue in 2011 to 56% in 2013.
European Food
The European Food segment manufactures steel
and aluminum food cans, ends, and metal vacuum
closures. Crown supplies a variety of customers
from its operations throughout Europe and Africa.
The European food can market is a mature market
which has experienced stable to slightly declining
volumes in recent years.
Asia Pacific
The Company's Asia Pacific segment primarily
consists of beverage can operations in Cambodia,
China, Malaysia, Singapore, Thailand, and Vietnam.
This segment also includes the Company's non-
beverage can operation of food cans and specialty
packaging in China, Singapore, Thailand, and
Vietnam. In recent years, Crown’s beverage can
businesses in Asia have experienced significant
growth.
In 2012, Crown commercialized new beverage can
plants in Putian, Ziyang and Heshan, China and
expanded capacity at its plant in Ho Chi Minh City,
Vietnam. In the fourth quarter of 2012, the
Company acquired an aluminum beverage can and
end production facility in Vietnam and also
acquired a controlling interest in Superior Multi-
Packaging Ltd. (“Superior”), a listed company on
the Singapore Exchange. Superior primarily
produces specialty packaging containers for
consumer products companies at its facilities in
China, Singapore, and Vietnam.
In the first quarter of 2013, the Crown
commercialized additional beverage can lines at its
facilities in Putian, China and Bangi, Malaysia. In
the second quarter of 2013, they also
commercialized new beverage can plants in
Danang, Vietnam and Bangkok, Thailand; and in
July, the Company began production at its new
plant in Sihanoukville, Cambodia.
Non-Reportable Segments
The Company's non-reportable segments includes
the aerosol can businesses in North America and
Europe, its specialty packaging business in Europe
and its tooling and equipment operations in the
U.S. and U.K. In recent years, their specialty
packaging and aerosol can businesses have
experienced slightly declining sales volumes.
Competitive Advantage
The Customer is Always Right
Most of Crown’s products are sold in highly
competitive markets, primarily differentiated on
price and quality. Crown is not the biggest or most
efficient of the manufacturing companies, so it is
unlikely that they will be able to compete based on
economies of scale. However, in contrast to their
bulky brethren, Crown has tremendous skill in die
forming and metal fabrication, crisp printing in up
to nine colors, unique packaging materials, and
new surface finishes, allowing them to much more
easily adapt to the customer’s needs. This inherent
flexibility allows Crown to sell to players of all sizes,
filling a niche opportunity ignored by their
competitors.
7. CCK: Crown Holdings, Inc. – Equity Research Project Martin Smith
Student Investment Management Spring 2014 Page 7 of 20
Location, Location, Location
Crown took the dramatic step of closing its largest
manufacturing facilities and moving their
operations closer to the customers, as opposed to
their source of raw-materials. Additionally,
because customers rarely keep containers on site,
Crown opts to keep more than a month’s inventory
on hand, reducing both delivery cost and time,
while improving customer satisfaction numbers
worldwide.
Recent News and Share Performance
On October 31, 2013, Crown announced an
agreement to buy Spanish food-can maker Mivisa
Envases SAU for €1.2 billion ($1.64 billion)
including debt from Blackstone Group, N+1
Mercapital and the company’s management.
Mivisa is the largest food can producer in the
Iberian Peninsula, with nine manufacturing
facilities in Spain and another in Morocco. The
move will increase Crown’s footprint in Europe and
the Middle East, where Crown generated over $4
billion in sales in 2013 (47% of revenues according
to Bloomberg).
In order to close the deal, Crown agreed to pay
nine times Mivisa’s EBITDA, whereas the average
EBITDA multiple in four recent acquisitions within
the industry during the past 5 years was only 7.7x,
implying that Crown paid a 16.8% premium above
recent market levels. This premium equates to an
additional $275 million in purchase price. Despite
the premium paid, the chart below shows there
was a significant upside reaction to the acquisition
announcement, with shares surging 7.3% the day
the news hit. Since that time however, shares of
CCK have failed to keep their momentum going,
increasing only 2.2% whereas the S&P 500 has
increased 4.4% during the same timeframe.
$37
$38
$39
$40
$41
$42
$43
$44
$45
$46
31-Oct
14-Nov
28-Nov
12-Dec
26-Dec
9-Jan
23-Jan
6-Feb
20-Feb
6-Mar
Crown Holdings Share Price
Since Announcement of Mivisa Acquisition
-2%
0%
2%
4%
6%
8%
10%
12%
31-Oct
14-Nov
28-Nov
12-Dec
26-Dec
9-Jan
23-Jan
6-Feb
20-Feb
6-Mar
Crown Holdings Recent Performance
Compared to S&P 500
CCK
S&P
8. CCK: Crown Holdings, Inc. – Equity Research Project Martin Smith
Student Investment Management Spring 2014 Page 8 of 20
Investment Thesis
This paragraph aims to provide a brief overview of
the current and projected market climate, the
drivers of the Metal and Glass Containers industry,
and a target price based on these assumptions. An
explanation of the company’s financial statements
and ratios will help assess the firm’s current
situation, as well as provide a benchmark to
compare our Discounted Cash Flow model against.
Key Fundamental and Economic Drivers
The materials sector as a whole is highly correlated
to Gross Domestic Product (96.5% correlation over
the past year), and Crown Holdings is no exception
to that rule. While Crown manufactures containers
for food and beverage products, these containers
are primarily used for discretionary goods, meaning
sales are good in times of expansion and poor in
times of contraction.
North America
While GDP numbers in the United States have
shown slow but consistent growth, the North
American segment in both food and beverage are
mature markets, with sales declining on average
over the previous 3 years. As such, Crown is relying
more and more on developing economies in order
to generate the expendable income necessary for
the purchase of their products.
International
Due to the ever strengthening link between world
economies, the slow recovery of US markets are
having positive effects on some developing nations,
as the rising tide effect lifts all boats. However,
recent numbers suggest that a slowdown is present
in China. A slowdown in China could be
catastrophic to the Company, as the Asia Pacific
segment represents the largest growth segment
companywide. Additionally, a slowdown in China
could have far reaching effects to the world
economy, giving question as to whether the recent
uptrend in the materials sector is sustainable.
Chinese infrastructure spending has slowed
significantly, coupled with a weakening of the
Yuan. With both money growth and loan growth
decelerating, a sudden reacceleration in the
Chinese economy is unlikely, and I see this as a
headwind for the materials sector. Sluggish
economic data out of China and other emerging
markets give me pause as to whether CCK will be
able to achieve the lofty earnings estimates set
forth by analysts following the name.
Financial Analysis
A copy of the total pro forma income statement
can be found in appendix 1 on page 15. The
following paragraphs present and explain the
various assumptions used for the calculations as
well as the main takeaways from the analysis.
Revenue
As previously mentioned, Crown Holdings is
experiencing a decline in sales in their North
America segments due to the maturity of the
markets. That decline is being offset by
accelerating revenues out of their Asia Pacific
segment as well as their European Beverage
segment. The European Food segment was hit
9. CCK: Crown Holdings, Inc. – Equity Research Project Martin Smith
Student Investment Management Spring 2014 Page 9 of 20
hard due to the European Debt crisis and ensuing
European recession, but revenues are accelerating
once again. I expect the Company to grow sales at
a pace of 3%, coming in above the 0.9% they have
averaged throughout the previous five years, but in
line with the three year average. Historically
Crown has averaged 3.3% growth, but I believe
they will fall short of this number in the
foreseeable future as I am concerned with the
prospect of a Chinese slowdown.
Operating Margins
Crown has publicly stated during recent conference
calls as well as SEC filings that they would like to
positively influence their sales and administrative
expenses in order to improve margins. In the
previous five years, they have on average seen a
0.10% improvement, and I see this trend
continuing for an estimated three additional years.
However, it is only possible to cut costs so much,
and I feel it imprudent to assume that continued
cost cutting will continue beyond three years.
Share Buyback
Earnings per share have seen an upward
movement in recent years due in part to the
continuously decreasing outstanding share count.
During each of the previous three years, Crown has
purchased and retired approximately 4.5% of
outstanding shares, taking the total from 162.4
million in 2010 down to the current level of 138.4.
During this time period, interest rates have been
kept artificially low by the Federal Reserve,
allowing Crown to roll over debt at beneficial
levels. Low interest expense, coupled with strong
cash flows have resulted in a shareholder friendly
environment, and once again, I expect this pattern
to continue.
Peer Comparison
Metric (ttm) CCK OI BLL SLGN
Market Cap: 5.97B 5.42B 7.58B 3.09B
Revenue: 8.66B 6.97B 8.47B 3.71B
Gross Margin: 15.47% 19.08% 18.77% 14.74%
EBITDA: 1.05B 1.15B 1.17B 0.50B
Op. Margin: 10.59% 10.95% 10.32% 9.19%
Net Income: 324M 202M 406M 185M
Diluted EPS: 2.30$ 1.11$ 2.73$ 2.87$
P/E: 19.07 29.61 19.75 19.68
Crown Holdings main competitors within the metal
and glass containers sub-industry of the materials
sector are Owens-Illinois (OI), Ball Corp (BLL), and
Silgan Holdings (SLGN). Ball Corp represents
Crown’s closest competitor, as they offer metal
beverage, food, and aerosol containers to a
worldwide customer base.
Despite having a significantly smaller Market Cap
($5.97B vs $7.58B), the Company actually comes in
slightly higher in revenue ($8.66B vs $8.47B).
Crown Holdings’ gross margins are 3.3% lower than
that of Ball Corp, however, when it comes to
operating margins, Crown actually achieved a
number 0.27% superior to Ball Corp.
Liquidity Analysis
A reading of 0.67 for the more conservative quick
ratio shows that Crown does not have enough
liquid assets minus inventories to cover their short
term financial obligations. With a current ratio of
1.09, Crown has $1.09 in liquid assets for every
$1.00 of short-term obligations. While Crown
10. CCK: Crown Holdings, Inc. – Equity Research Project Martin Smith
Student Investment Management Spring 2014 Page 10 of 20
would be able to cover their debts, a 1.09 ratio
does not suggest an incredibly stable balance
sheet.
Discounted Cash Flow Analysis
A Discounted Cash Flow model has been included
as Appendix 3 (page 18) of this report, combining
data projected forward as part of the Income
Statement, Balance Sheet, and Statement of Cash
Flows. Despite a Terminal Growth Rate of 3.3% to
reflect the long-term growth rate of this 122 year
old company (a figure I believe to be generous), as
well as a 10% discount rate (a number often used
to value the market, but still relatively cheap
compared to most stocks within the basic materials
sector), my price target only amounted to $37.31,
representing a fair value 15.0% below the closing
price as of March 28, 2014.
Due to the lenient growth and discount rates
applied to the model, I opted to perform a
sensitivity analysis to show the reasonable range of
possible price targets. Using growth rates ranging
from 2.1% to 4.5% and discount rates ranging from
8% to 12%, I calculated price targets from $25.22
up to an unlikely figure of $71.06.
Multiple Analysis
Another useful approach to valuation of a company
involves comparing multiples to that of its
benchmark, sector, and industry. This helps to
determine if the stock is currently trading at a
discount, is fairly valued, or is selling at a premium
compared to its peers.
Relative to the S&P 500 Benchmark
The current share price reflects the 10 year
historical average when compared to Sales and
Cash Flows per share, and actually reflects a slight
discount versus historical earnings figures.
However, the Price-to-Book number is at the 10
year high point, 2.6 times the historical average of
3.3.
Relative to
S&P 500 High Low Median Current
Trailing P/E 11.5 0.7 1.0 0.9
Forward P/E 1.2 0.7 0.9 0.8
P/B 8.7 2.7 3.3 8.7
P/S 0.6 0.1 0.4 0.4
P/CF 1.3 0.4 0.9 0.9
Relative to its Sector
When compared to its peers within the materials
sector, the Price-to-Sales and Price-to-Cash Flows
once again are at their historical average. As with
the S&P 500 comparison, it appears that Crown is
again trading at a slight discount compared to its
current and projected earnings. However, similarly
to the S&P comparison, the price-to-book ratio is
once again at the historical high, approximately
twice the average level. This could mean that
investors have high hopes for growth in the
Relative to
Sector High Low Median Current
Trailing P/E 9.7 0.4 1.0 0.7
Forward P/E 1.4 0.4 0.9 0.8
P/B 7.3 2.7 3.7 7.3
P/S 0.8 0.2 0.5 0.5
P/CF 1.4 0.5 0.9 1.0
11. CCK: Crown Holdings, Inc. – Equity Research Project Martin Smith
Student Investment Management Spring 2014 Page 11 of 20
company, a figure not backed up by the low
forward price-to-earnings ratio.
Relative to its Industry
We see more of the same when looking at the
comparison of Crown versus its industry group. We
actually see a slight overvaluation when compared
to sales this time, but once again a slight discount
versus trailing price-to-earnings. In this instance,
the forward looking price-to-earnings number is in-
line with historical averages, but the price-to-book
number is once again at the 10 year high and
extremely elevated compared to averages.
Relative to
Industry High Low Median Current
Trailing P/E 12.9 0.8 1.1 1.0
Forward P/E 1.4 0.7 1.1 1.1
P/B 4.7 1.9 2.7 4.7
P/S 1.1 0.2 0.7 0.8
P/CF 1.9 0.5 1.3 1.3
Crown Multiples Evaluation
Relative valuations all seem to indicate that CCK is
trading at a fair to slightly discounted level, with
the exception of the price-to-book, which is
running counter to each of the other valuations.
That being said, I’ve use combined target multiples
with forecasted values for earnings, book value,
sales, cash flow, and EBITDA per share to produce
the following table:
Forward P/E21.1 8.5 12.9 13.3 2.52 13.0 32.76$
P/B 22.5 8.1 10.1 22.5 2.32 12.0 27.82$
P/S 0.8 0.2 0.6 0.7 67.00 0.6 40.20$
P/CF 12.2 4.2 8.7 10.8 3.03 10.0 30.30$
P/EBITDA 11.8 1.8 5.7 6.1 5.65 6.0 33.90$
Average of all target prices 33.00$
Average of target prices (excluding P/B) 34.29$
Upside/Downside potential -21.8%
The target price in this instance varies from $27.82
(P/B) to $40.20, with the average coming in at
$33.00. However, because the price-to-book
number has appeared so detached from the rest of
the relative valuations, I feel it is prudent to
eliminate this figure from our calculation. The
exclusion of the price-to-book target raises our
average target price to $34.29, showing a fair value
21.8% lower than the current market price of
$43.78.
12. CCK: Crown Holdings, Inc. – Equity Research Project Martin Smith
Student Investment Management Spring 2014 Page 12 of 20
Risks to the Recommendation
While I have attempted to consider as many
variables as possible, it must be mentioned that
forecasting is an inexact science. Risks exist both
internally and externally, domestically and abroad
that could radically effect the assumptions set
forth, resulting in drastically different earnings and
stock price figures from my target numbers.
External Risks
Any company that operates outside the borders of
the United States faces some risks, but Crown
Holdings is increasingly an international operation.
Crown generated 73% of their 2011 and 2012 sales
abroad, with the figure increasing to 74% in 2013,
and that number is expected to grow in the future
due to the Company’s business strategy and the
Mivisa acquisition. A significant majority of the
Company’s growth is expected to come via
expansion into the developing markets of Eastern
Europe, Asia, the Middle East, and South America.
A prolonged period of political or economic
stability could drive sales higher than estimated in
these regions, resulting in an upward movement in
share price.
Furthermore, if the current European sovereign
debt crisis continues its improvement, there will
likely be a positive effect on the Company's
European business, as well as the businesses of the
Company's European customers and suppliers. If
this crisis wanes and leads to a significant
improvement in the valuation of the euro, the
value of financial assets that are denominated in
euros would be significantly increased when
translated to U.S. dollars for financial reporting
purposes. Any of these conditions could ultimately
improve the Company's overall business,
prospects, operating results, financial condition,
and cash flows, and such improvement may be
more pronounced if the Company expands in
Western Europe through potential acquisitions or
otherwise.
In its consolidated financial statements, Crown
translates financial results from the local currency
into U.S. dollars based on average exchange rates
prevailing during a reporting period. During times
of a weakening U.S. dollar, its reported
international revenue and earnings will be
increased because the local currency will translate
into more U.S. dollars, again resulting in better-
than-expected earnings results.
Crown uses various raw materials for the
production of their finished good. The availability
of these materials and their prices depends on
global and local supply, as well as demand forces,
governmental regulations (including tariffs), levels
of production, resource availability, transportation,
and other factors. In recent years, the
consolidation of steel suppliers, shortage of raw
materials affecting the production of steel, and the
increased global demand for steel, especially in
China, have contributed to an overall tighter supply
for steel, resulting in increased steel prices and
allocated cut backs of products by steel suppliers.
In 2013, steel and aluminum represented 25% and
39% respectively of the cost of goods sold. While
Crown passes most of the raw materials costs on to
their customers, the slowdown in the Chinese
economy may result in lower steel prices,
13. CCK: Crown Holdings, Inc. – Equity Research Project Martin Smith
Student Investment Management Spring 2014 Page 13 of 20
eliminating the threat of compressed margins due
to an inability to pass on price movements.
Crown has a substantial level of outstanding debt,
with the Mivisa acquisition only increasing that
indebtedness further. As a result, a significant
portion of the Company's cash flows are required
to pay interest and principal. Sales outpacing
expectations would result in increased cash flows,
improving their balance sheet and future
borrowing prospects available under their senior
secured credit facilities, allowing Crown to fund
future liquidity needs.
As of December 31, 2013, approximately $850
million of the Company's $3.8 billion of total
outstanding obligations were subject to floating
interest rates. The Company's annual interest
expense was $236 million, $226 million and $232
million for 2013, 2012 and 2011, respectively.
Based on the amount of variable rate debt
outstanding at December 31, 2013, a 1% increase
in variable interest rates would increase its annual
interest expense by $8.5 million. Negative changes
in economic conditions could result in the
continuation of artificially low interest rates,
thereby locking in the Company's interest expense
and stabilizing funds available for other projects.
14. CCK: Crown Holdings, Inc. – Equity Research Project Martin Smith
Student Investment Management Spring 2014 Page 14 of 20
Conclusion
Utilizing the bottom up approach of a Discount
Cash Flow model with an assumed terminal growth
rate of 3.3% and a discount rate of 10%, I came to a
target price of $37.31, which results in a potential
downside of 15%. Through using multiple
valuation methods, I calculated a price target of
$34.29, or a potential downside of 27.9% from the
closing price on March 28th
, 2014.
Due to the nature of multiples valuation versus the
discounted cash flow method, I am going to
assume that the DCF model is the more accurate
estimation of worth. After combining the two
targets, allowing for a weighting of 67% for the DCF
and 33% for the multiples valuation target, I came
to a final price target of $36.00, representing a
potential downside of 21.8%.
Final Price Target
Calculation
Price
Valuation
Weight
Potential
Upside /
Downside
Current Price 43.87$
Discounted Cash Flow
Price Target 37.31$ 67% -15.0%
Multiples Valuation
Price Targe 34.29$ 33% -21.8%
Final Price Target 36.00$ -17.9%
Recommendation
I recommend a SELL rating for Crown Holdings, Inc.
(CCK) for the following previously stated reasons:
Recent numbers suggest that a slowdown is
present in China. A slowdown in China could be
catastrophic to the Company, as the Asia Pacific
segment represents the largest growth
segment companywide. Additionally, a
slowdown in China could have far reaching
effects to the world economy, giving question
as to whether the recent uptrend in the
materials sector is sustainable.
Consensus estimates are calling for a for an
average earnings increase of 22% each of the
next three years on an average sales increase of
3%. While the historical sales growth rate has
been 4%, the average increase since 2008 has
come in just shy of 1%, and I believe the rosy
3% estimates have already been baked in to the
overvalued share price.
I believe Crown overpaid for their acquisition of
Mivisa Envases. Not only did Crown pay an
estimated $275 million above the market value
of the company, they took on a substantial
amount of debt in the process.
With the Federal Reserve winding down its
bond buying program and publically
announcing its intention to begin raising
interest rates six months after the program
ends, I fully expect borrowing rates to increase
proportionately. Currently the Company has
$850 million in debt, subject to floating rates,
so if sales come in below expectations and cash
flows are unable to cover obligations, Crown
will need to rollover their debt at higher rates,
further exacerbating the problem.
Company: Crown Holding, Inc.
Ticker: CCK
Current Price: $43.87 (March 28, 2014)
Target Price: $36.00
Recommendation: SELL
Analyst: Martin Smith
15. CCK: Crown Holdings, Inc. – Equity Research Project Martin Smith
Student Investment Management Spring 2014 Page 15 of 20
Appendixes
Appendix 1: Forecast of Income Statement
A. Income Statement
Summary of Operations 2008 2009 2010 2011 2012 2013 2014 E 2015E 2016E
Net sales 8,305$ 7,938$ 7,941$ 8,644$ 8,470$ 8,656$ 8,916$ 9,183$ 9,459$
Cost of products sold 6885 6551 6519 7120 7013 7180 7,406 7,628 7,857
Depreciation and amortization 216 194 172 176 180 134 138 142 146
Gross profit 1,204$ 1,193$ 1,250$ 1,348$ 1,277$ 1,342$ 1,372$ 1,413$ 1,456$
Gross Margin 14.5% 15.0% 15.7% 15.6% 15.1% 15.5% 15.4% 15.4% 15.4%
Selling and administrative expense 396 381 360 395 382 425 417 421 424
Provision for asbestos 25 55 46 28 35 32 40 41 42
Provision for restructuring 21 43 42 77 48 46 47 49 50
Asset impairments and sales 6 (6) (18) 6 (48) (12) (13) (13) (14)
Income from operations 756$ 720$ 820$ 842$ 860$ 851$ 880$ 916$ 953$
Interest expense 291 241 194 221 226 236 252 259 267
Loss from early extinguishments of debt 2 26 16 32 0 41 21 21 22
Interest income 21 (6) (4) 2 (7) (5) 0 0 0
Foreign exchange (1) 3 0 0 0
Income before income taxes 442$ 459$ 614$ 587$ 642$ 576$ 608$ 635$ 663$
Provision for/(benefit from) income taxes 112 7 165 194 (17) 148 152 159 166
Equity earnings/(loss) (2) 3 3 5 0 0 0 0
Net income 330 450 452 396 664 428$ 456$ 476$ 498$
Net income attributable to noncontrolling interests (104) (116) (128) (114) (105) (104) (117) (123) (128)
Net income attributable to Crown Holdings 226$ 334$ 324$ 282$ 559$ 324$ 338$ 354$ 369$
Net Margin 2.7% 4.2% 4.1% 3.3% 6.6% 3.7% 3.8% 3.9% 3.9%
Average shares outstanding (diluted) 162.9 161.9 162.4 154.3 148.4 140.7 134.4 128.3 122.5
Earnings per Share (GAAP) 1.39$ 2.06$ 2.00$ 1.83$ 3.77$ 2.30$ 2.52$ 2.76$ 3.01$
16. CCK: Crown Holdings, Inc. – Equity Research Project Martin Smith
Student Investment Management Spring 2014 Page 16 of 20
B. Detailed Breakdown of Income Statement
Summary of Operations 2008 2009 2010 2011 2012 2013 2014 E 2015E 2016E
Net sales 8,305$ 7,938$ 7,941$ 8,644$ 8,470$ 8,656$ 8,916$ 9,183$ 9,459$
Sales Growth -4.4% 0.0% 8.9% -2.0% 2.2% 3.0% 3.0% 3.0%
Cost of products sold 6885 6551 6519 7120 7013 7180 7,406 7,628 7,857
(as percent of sales) 82.9% 82.5% 82.1% 82.4% 82.8% 82.9% 83.1% 83.1% 83.1%
Depreciation and amortization 216 194 172 176 180 134 138 142 146
(as percent of sales) 2.6% 2.4% 2.2% 2.0% 2.1% 1.5% 1.5% 1.5% 1.5%
Gross profit 1,204$ 1,193$ 1,250$ 1,348$ 1,277$ 1,342$ 1,372$ 1,413$ 1,456$
Gross Margin 14.5% 15.0% 15.7% 15.6% 15.1% 15.5% 15.4% 15.4% 15.4%
Selling and administrative expense 396 381 360 395 382 425 417 421 424
(as percent of sales) 4.8% 4.8% 4.5% 4.6% 4.5% 4.9% 4.7% 4.6% 4.5%
Provision for asbestos 25 55 46 28 35 32 40 41 42
(as percent of sales) 0.3% 0.7% 0.6% 0.3% 0.4% 0.4% 0.4% 0.4% 0.4%
Provision for restructuring 21 43 42 77 48 46 47 49 50
(as percent of sales) 0.3% 0.5% 0.5% 0.9% 0.6% 0.5% 0.5% 0.5% 0.5%
Asset impairments and sales 6 (6) (18) 6 (48) (12) (13) (13) (14)
(as percent of sales) 0.1% -0.1% -0.2% 0.1% -0.6% -0.1% -0.1% -0.1% -0.1%
Income from operations 756$ 720$ 820$ 842$ 860$ 851$ 880$ 916$ 953$
Interest expense 291 241 194 221 226 236 252 259 267
(as percent of sales) 3.5% 3.0% 2.4% 2.6% 2.7% 2.7% 2.8% 2.8% 2.8%
Loss from early extinguishments of debt 2 26 16 32 0 41 21 21 22
(as percent of sales) 0.0% 0.3% 0.2% 0.4% 0.0% 0.5% 0.2% 0.2% 0.2%
Interest income 21 (6) (4) 2 (7) (5) 0 0 0
Foreign exchange (1) 3 0 0 0
Income before income taxes 442$ 459$ 614$ 587$ 642$ 576$ 608$ 635$ 663$
Provision for/(benefit from) income taxes 112 7 165 194 (17) 148 152 159 166
(as percent of sales) 25.3% 1.5% 26.9% 33.0% -2.6% 25.7% 25.0% 25.0% 25.0%
Equity earnings/(loss) (2) 3 3 5 0 0 0 0
Net income 330 450 452 396 664 428$ 456$ 476$ 498$
Net income attributable to noncontrolling interests (104) (116) (128) (114) (105) (104) (117) (123) (128)
(as percent of sales) -31.5% -25.8% -28.3% -28.8% -15.8% -24.3% -25.8% -25.8% -25.8%
Net income attributable to Crown Holdings 226$ 334$ 324$ 282$ 559$ 324$ 338$ 354$ 369$
Net Margin 2.7% 4.2% 4.1% 3.3% 6.6% 3.7% 3.8% 3.9% 3.9%
17. CCK: Crown Holdings, Inc. – Equity Research Project Martin Smith
Student Investment Management Spring 2014 Page 17 of 20
Appendix 2: Select Balance Sheet a Cash Flow Figures
2008 2009 2010 2011 2012 2013 2014 E 2015E 2016E
Balance Sheet
Assets
Receivables, net 734 714 936 948 1057 1064 1,158 1,256 1,359
(as percent of sales) 8.8% 9.0% 11.8% 11.0% 12.5% 12.3% 13.0% 13.7% 14.4%
Inventories 979 960 1060 1148 1166 1213 1,289 1,369 1,452
(as percent of sales) 11.8% 12.1% 13.3% 13.3% 13.8% 14.0% 14.5% 14.9% 15.3%
Liabilities and equity
Accounts payable and accrued liabilities 1,982 1,866 1,978 2,090 2,146 2,547 2,325 2,428 2,536
(as percent of sales) 23.9% 23.5% 24.9% 24.2% 25.3% 29.4% 26.1% 26.4% 26.8%
Statement of Cash Flows
Cash flows from operating activities
Depreciation and amortization 216 194 172 176 180 134 138 142 146
(as percent of sales) 2.6% 2.4% 2.2% 2.0% 2.1% 1.5% 1.5% 1.5% 1.5%
Cash flows from investing activities
Capital expenditures (174) (180) (320) (401) (324) (275) (298) (307) (316)
(as percent of sales) -2.1% -2.3% -4.0% -4.6% -3.8% -3.2% -3.3% -3.3% -3.3%
20. CCK: Crown Holdings, Inc. – Equity Research Project Martin Smith
Student Investment Management Spring 2014 Page 20 of 20
Sources
Crown Holdings, Inc. SEC Filings: 2010, 2011, 2012, and 2013 (Form 10-K)
Crown Holdings, Inc. FY 2013 Earnings Call Transcript
Crown Holdings, Inc. Corporate Website: www.crowncork.com
Standard & Poor’s Capital IQ: Accessed at the Ohio State University
Bloomberg: Accessed at the Ohio State University
Thomson Reuters Baseline: Accessed at the Ohio State University
Charles Schwab: www.schwab.com
Zacks.com: http://www.zacks.com/stock/news/121869/Crown-Holdings-Misses-On-Q4-Earnings
Yahoo Finance: finance.yahoo.com
Google Finance: www.google.com/finance
Morningstar: www.morningstar.com
http://blog.bcaresearch.com/downgrading-the-u-s-sp-materials-sector
http://www.bloomberg.com/news/2013-10-31/crown-to-acquire-mivisa-for-1-64-billion-from-blackstone-n-
1.html