1. 1 | P a g e
Analysts
Jay Miller
jay-r-miller@uiowa.edu
Zach Monroe
zachary-monroe-1@uiowa.edu
Company Overview
Alcoa Inc. (AA) is a global industry leader in
engineering and manufacturing lightweight metals.
Alcoa specializes in producing multi-material goods
including aluminum, titanium, and nickel. Their
products are used in various industries across the
board: aerospace, automotive, commercial
transportation, packaging, building and construction,
oil and gas, defense, consumer electronics, and
industrial applications. Best known for its aluminum
production, Alcoa participates in mining, refining,
and smelting the commodity. The US and Europe
comprise of 81% of all Alcoa sales (55% & 26%
respectively), however, their business spans across 30
countries including Australia, Brazil, China, Guinea,
Iceland, Russia, and Saudi Arabia.21
Stock Performance Highlights
52 Week High $33.93
52 Week Low $20.22
Beta Value 1.72
Share Highlights
Market Capitalization $10.1bn
Shares Outstanding 438mm
Book Value per Share $33.64
EPS -$0.31
Forward P/E 94.5
Company Performance Highlights
ROA FY ’15 -5.87
ROE FY ’15 -2.23
Sales FY’15 $22,543 Bn
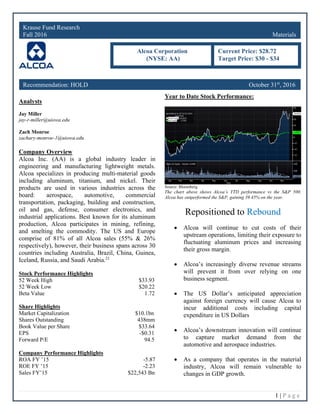
Year to Date Stock Performance:
Source: Bloomberg
The chart above shows Alcoa’s YTD performance vs the S&P 500.
Alcoa has outperformed the S&P, gaining 39.45% on the year.
Repositioned to Rebound
Alcoa will continue to cut costs of their
upstream operations, limiting their exposure to
fluctuating aluminum prices and increasing
their gross margin.
Alcoa’s increasingly diverse revenue streams
will prevent it from over relying on one
business segment.
The US Dollar’s anticipated appreciation
against foreign currency will cause Alcoa to
incur additional costs including capital
expenditure in US Dollars
Alcoa’s downstream innovation will continue
to capture market demand from the
automotive and aerospace industries.
As a company that operates in the material
industry, Alcoa will remain vulnerable to
changes in GDP growth.
Krause Fund Research
Fall 2016 Materials
Recommendation: HOLD October 31st
, 2016
Alcoa Corporation
(NYSE: AA)
Current Price: $28.72
Target Price: $30 - $34
2. 2 | P a g e
We are initiating a hold rating for Alcoa Corporation
(AA) for the Krause Fund Portfolio. The current share
price is trading at $28.72, but we believe this is
slightly below the true intrinsic value of the stock.
According to our discounted cash flow model and
economic value calculations, we forecast share price
to reach $34.42. Our relative price to sales valuation
priced Alcoa’s intrinsic value at $34.11. Due to
Alcoa’s low dividend payout we believe our dividend
discount model’s valuation of $11.68 can be
overlooked. We anticipate Alcoa will continue to
rebound from a rough 2015 and create long-term
growth for our portfolio.
GROSS DOMESTIC PRODUCT
Materials are highly dependent on the health of the
overall economy. It is vital that the economy is
growing in order for materials companies to be
lucrative. As GDP per capita grows, demand from
end market consumers increase. As a result, more
materials will be used in the production of roads,
buildings, factories, planes, automobiles and other
industrial production uses.1
Supply and demand ultimately determine the price
and volume of materials sold and consequently the
sales and profits of materials firms. Supply is
relatively fixed because the materials sector is very
capital intensive and it can take years to get a new
mine or refinery to be up and running. On the other
hand, supply surplus can result in the closing of
factories in order to decrease production in an attempt
to stabilize aluminum prices. Demand as well is
highly correlated with economic growth. Materials
companies better capture the demand of end-markets
including commercial construction, transportation,
aerospace, and automotive when the economy is
experiencing growth.1
In 2009, after the US GDP fell over 2.77%, real
GDP growth in the United States has fallen relatively
flat. In the United States, the Compound Annual
Growth Rate (CAGR) of GDP over the last 10 years
has been roughly 2.6% and average yearly GDP
growth over the past 10 years has been a little under
2%. GDP growth has been trending downwards and
this year GDP looks to be around 1.7%. Our group
predicts GDP growth to be level at around 1.5% in the
foreseeable future.4
Source: TradingEconomics.com
The chart above shows the US GDP growth rate in the last 10 years.
INTEREST RATES
The materials sector is highly capital intensive. The
sector requires large initial cash outflows in order to
purchase and develop mining facilities, refineries,
smelters, and other big ticket items. The borrowing
nature signifies that materials companies are
generally highly leveraged and take on large amounts
of debt relative to equity. Subsequently, the manner in
which materials companies operate make this sector
highly cyclical. Large scale operations force
companies such as Alcoa to borrow regardless of
economic stability. The lower the interest rates, the
cheaper the cost of debt is for materials companies.
This can fuel large profits in good times and pose
as headwinds in economic downturns.1
Interest rates play a large role in the ability for
materials companies to be able to take on and pay
down debt. Since mines and other large scale projects
can take two to ten years to develop, having too much
debt with high interest rates can hinder a materials
company.
Recently, our president elect Donald Trump has
claimed that the Federal Reserve has kept the Federal
Funds rate too low. He has been outspoken in regards
to his dislike for the Federal Reserve’s dovish stance,
and has stated he intends on “normalizing” interest
EXECUTIVE SUMMARY
ECONOMIC OUTLOOK
3. 3 | P a g e
rates. It is evident that his victory has already
affected the 30-year Treasury Yield. We believe the
Fed Funds rate will increase 25-50 basis points in the
foreseeable future, which could make borrowing
slightly more expensive for Alcoa, however, we do
not project any substantial rate hikes in the short term
and therefore expect the nature of relatively low
interest rates to remain a positive for Alcoa.5
Source: CNBC.com
The chart above illustrates the 30-yr Treasury Yield performance within
the past month. It is clear to see the pop after Donald Trump’s victory.
INFRASTRUCTURE AND CONSTRUCION
Supplementary effects of the victory of Donald
Trump are the projected increases on infrastructure in
the U.S. He anticipates that spending will reach
upwards of $1 Trillion dollars. There is much reason
for increased infrastructural spending in the U.S. The
American Society of Civil Engineers gave a D+ rating
to the quality of U.S infrastructure. Alcoa looks to
become a beneficiary of this policy as aluminum
products are largely used during infrastructural
improvements.10
As seen in the following chart, infrastructure
spending has reached a 30-year low. According to the
American Society of Civil Engineers, it would cost
$3.6 Trillion to improve the country’s overall
infrastructure. Federal investment on infrastructure
has also declined to .05% of GDP. Originally, federal
investment was 1% of GDP.10
Source:BEA.gov
The chart above shows the recent decline in U.S. infrastructure
spending.
The same can be said for global infrastructure
spending. In 2014, the Eurozone spent 2.7% of GDP
on infrastructure, down from 3.6% in 2009. The UK
similarly decreased their spending to 2.7% from 3.4%
during that same period. To keep up with economic
growth, researchers estimates that a 0.4% investment
increase is needed between now and 2030.11
On the contrary, China, who accounts for over 50% of
global aluminum consumption, has been more keen to
infrastructure spending in recent years. On average,
countries worldwide spend approximately 3.5% of
their respective GDP annually. From 2008 to 2013,
China has spent roughly 8.8% of their GDP on
infrastructure. At this rate, China could afford to cut
back their infrastructural spending by 3.3 percentage
points and still meet their standards by 2030.
Furthermore, large economies such as Japan could
also cut back spending by 1.5% and remain on track
until 2030.11
This type of spending could be crucial
for Alcoa.
Other countries are still falling behind despite
significant efforts to ramp up infrastructure spending.
For example, India has spent 5.2% of their GDP on
infrastructure, which is well above the global average,
yet analysts estimate that they need to boost spending
by an additional 1.5% to meet demand between now
and 2030. Likewise, South Africa has invested about
4.7% of their GDP, but still remain 1.2% below
analyst estimates. If India, South Africa, and other
emerging markets boost their spending to meet
infrastructural standards, it will bode well for Alcoa.
4. 4 | P a g e
Source: WSJ.com
The chart above displays the recent downtrend in global infrastructural
spending among major economies.11
EXCHANGE RATES
The global nature of Alcoa’s operations exposes the
company to foreign currency exchange rate impacts.
Both Alcoa’s revenues and expenses can be affected
negatively or positively on an annual basis. The
changes in the valuation of the U.S. dollar versus
currencies that have impacts on Alcoa’s revenues and
operations include the Australian dollar, the Brazilian
real, and the Canadian dollar.21
Source: TradingEconomics.com
The chart above compares US dollar ETF (DXY), to Australian dollar,
Brazilian real, and Canadian dollar ETFS. The blue line represents the
USD ETF.7
Additionally, the Euro and Norwegian Kroner both
have the potential to affect Alcoa’s profitability.
Many significant input purchases such as raw
materials are bought in these currencies. Generally,
once these inputs are bought in foreign currencies,
they are then sold in U.S. dollars. Alcoa observes
short-term profitability gains when the U.S. dollar
strengthens, however, long-term earnings are
adversely affect by a stronger U.S dollar. As the U.S.
Dollar strengthens, the cost curve shifts downwards
for international smelting facilities, but Alcoa’s
domestic cost curve may not follow suit. With global
currencies weakening across the board, the U.S.
dollar continues to grow relative to other currencies.
With the victory of Donald Trump, we believe his
proposed trade policies will help continue to
strengthen the value of the U.S. Dollar.6
CAPITAL MARKETS OUTLOOK
As discussed previously, we believe interest rates will
be rising in the near future. Although this will pose as
a headwind for the vast majority of the market and the
materials sector due to its capital intensive nature,
other industries may view rising interest rates as
favorable conditions. Key beneficiaries of rising
interest rates will be financials. Big banks such as J.P.
Morgan and Wells Fargo are among those that will be
rewarded once the rate hike is installed.8
ALUMINUM INDUSTRY BASICS
Alcoa’s operations fall in the Aluminum sub-industry,
which falls under the umbrella of the Metals and
Mining Industry. The aluminum industry consists of
many segments that connect the supply chain. First,
Bauxite is mined and processed into aluminum oxide,
which is called alumina. The alumina is transported to
a plant where it undergoes a highly energy-intensive
process called smelting. The smelting process yields
raw aluminum, which undergoes a process called
rolling that forms it into a specified shape and size.21
Due to the large scope of this operation, companies
such as Alcoa gain an advantage by vertically
integrating all functions of the supply chain. This
allows them to be less sensitive to the price
fluctuations of the market price of aluminum by
giving them more cost and supply control.2
Alcoa’s vertical integration also provides it with
additional revenue streams. They sell bauxite,
alumina, and raw aluminum to other downstream
producers, and sell excess energy they produce to
nearby power companies.21
INDUSTRY OUTLOOK
5. 5 | P a g e
Aluminum is traded on London Metal Exchange
(LME). Not only does the LME provide a
marketplace for the purchase of aluminum, it also
controls price stability. The LME facilitates over 700
storage facilities across the world, which gives
aluminum producers a market to sell to during periods
of oversupply, and gives downstream users a
safeguard to purchase aluminum during periods of
extreme shortage. The LME aluminum price is
considered the global standard for aluminum prices.21
Energy is a large cost component of aluminum
production, representing 19% of Alcoa’s total
alumina refining production costs and 23% of its
aluminum production costs. Alcoa generates 14% of
the power used at its smelters and purchases the rest
under long-term supply contracts. Coal, hydroelectric
power, natural gas, and fuel oil make up the primary
energy inputs used for production. 21
INDUSTRY TRENDS
Higher energy costs geographically can have a large
impact on operations for aluminum companies. Over
the past 6 years, higher energy costs have
significantly reduced the amount of aluminum
produced in the United States (see graph below).25
Rising energy prices caused Alcoa to close 8 out of its
10 of smelting plants in the United States and focus
on its operations in Norway, Iceland, Canada and
Saudi Arabia where energy prices are much lower.21
Source: Factset.com
The chart above shows the US production of Aluminum from 2006-
2015.
In the past, alumina prices were determined as a
percentage of aluminum prices. Recently, alumina
producers have shifted to using a price index that
more accurately prices in raw inputs, demand, and the
overall market for alumina. As the graph below
shows, after bottoming out around $200/mt in
January, Alumina prices have rebounded to $270/mt.
Continued price growth should help the industry
moving forward.2
Source: MarketRealist.com
The transportation industry and the construction
industry are the two largest consumers of aluminum,
making up a respective 26% and 25% share of end
use. Upstream companies such as Norwegian Hydro,
RUSAL, and Alcoa have opened their own
downstream value-added divisions to produce either
finished or semi-finished aluminum products that can
be directly sold to end users. Interestingly, Alcoa will
split their upstream and downstream businesses on
November 1st
, 2016 in order to give each business
more flexibility and to allow the downstream business
to realize its higher growth potential.27
Source: Statista.com
The chart above illustrates industry demand for Aluminum products.
Two main components of the transportation industry
that use aluminum as a key input for their products
are the automotive and aerospace sub-industries. The
6. 6 | P a g e
performance of these industries are intricately linked
to the demand for aluminum. A recent trend in the
auto industry is the increase in the amount of
aluminum that is used per vehicle. In the past, steel
was the main component used in vehicles, however
producers are finding that using more aluminum and
less steel provides many benefits such as boosting
fuel economy, improving vehicle performance, and
reducing CO2
emissions. The chart below shows that
on average, less than 400 lbs. of aluminum is used per
vehicle, however analysists project that number to
grow to 547 lbs. by 2025.2
Source: MarketRealist.com
Unfortunately, not all aspects of the auto industry are
favorable. The seasonal annual adjusted rate for auto
sales (SAAR) is a rate that removes seasonal
variations from sales data in order to simplify sales
growth comparisons. Currently, the U.S. vehicle
SAAR sales are down -0.7% on a year over year
basis, with car sales down 11.8%. The silver lining is
that truck SAAR sales are up 7.5%, which is good for
aluminum demand as trucks require more aluminum
for production.24
We recognize that 2015 was a record
breaking year for U.S. auto sales, but we see the
industry plateauing. Although we do not anticipate
sales volume in the auto industry to be a source of
growth for aluminum demand, we believe the growth
in the amount of aluminum used per vehicle will still
provide Alcoa with substantial demand growth.
The aerospace industry is poised to remain a key
source of demand for the aluminum industry and
Alcoa. Over the next 20 years, passenger traffic is
projected to grow at a compound annual growth rate
of 4.5%, and freight growth is projected at a 4.0%
CAGR over the same time span. From 2015 to 2035,
Airbus projects the demand for new aircraft will reach
33,070 units, totaling $5.2 trillion. Also encouraging
is that passenger traffic is currently outperforming
global GDP growth. As the chart below shows, in
June 2016 passenger traffic was up 6.2% year-over-
year, which was well above global Real GDP growth
of 2.4%.28
We view the growth of the aerospace
industry as an integral part of Alcoa’s future.
Source: Airbus.com
China is the world’s leader in aluminum production
and consumption, filling their high demand with their
own domestic companies. Over the past decade,
Chinese companies have increased aluminum
exporting, which contributed to a global surplus and
caused the LME price of aluminum to fall. Over the
past year China increased their infrastructure
spending even further, spending $1.3 trillion over the
course of one year.20
As a result of the increased
domestic demand, Chinese companies reduced their
level of aluminum exports, which has helped stabilize
global supply and increase the LME price.33
Over the
next few years, we predict that infrastructure
spending in China will remain strong, which should
help keep supply levels stable and demand levels
strong. We project the annual aluminum industry
demand growth rate to be roughly 4%.2
COMPETITIVE ANALYSIS
Competitive analysis in the aluminum industry was
conducted by comparing the price to sales ratio of
7. 7 | P a g e
Alcoa’s top 5 competitors. At this time, several of our
peers had negative earnings which made it difficult to
accurately assess a relative price to earnings analysis.
Rio Tinto Alcan, a private division of the Rio Tinto
group, known as one of Alcoa’s primary competitors
was not included due to its multiple revenue streams.
Their metrics would not accurately portray the true
sales of their individual aluminum segment.
Additionally, as a private company, accurate
financials were not readily available.
In relation to Alcoa’s top 5 competitors, Alcoa holds
the highest market capitalization at 12.6 Bn closely
followed by Aluminum Corporation of China who
holds a market cap of 11.4 Bn. The remaining
competitors range from .5 Bn - 9.5 Bn. Sales are also
broadly dispersed as shown from the figure below.
Furthermore, Alcoa’s estimated price to sales ratio
falls right in line with its competitors, trading at .52
P/S. The median among the five companies was .67
which then gave Alcoa an implied value of $32.13.
This valuation falls right in line with our target price.
Source: Krause Fund Research 2016, FactSet25
The chart above displays Alcoa and its top 5 aluminum competitors. Several of
these companies are traded on exchanges outside the U.S., therefore their sales
and share prices have been adjusted to US dollars.
Given their 2 year returns, it is clear to see that Alcoa
and several of its competitors have experienced
significant negative returns. All but Aluminum
Corporation of China and Hindalco Industries have
seen positive returns. We believe this is due to their
geographical situations. Within the past two years
China has seen substantial GDP growth. In 2014 their
GDP growth rate reported upwards of 8% and
roughly 7% in 2015. China’s GDP growth has been
decreasing, although growth rates remain at healthy
levels coming in at 6.7%.14
India based Hindalco
industries has also become a beneficiary of domestic
growth. In 2014, India reported GDP growth rates
approximately 7.5% and 7% in 2015. India’s growth
has also tapered off, but still remains substantial at
6.7%.15
Source: Krause Fund Research 2016, FactSet25
The chart above shows the 2 year returns of Alcoa’s top 5 competitors.
Although Alcoa does not outperform its competitors
in these valuations, we believe the company holds key
competitive advantages that can spur further growth.
By splitting the company into upstream and
downstream segments on November 1st
, 2016, Alcoa
will be able to further capture the end market demand
of its downstream segment. These end markets
include the automotive and aerospace industries.
Additionally, Alcoa’s MicromillTM
technology, which
will be discussed in further detail, will appeal to
automakers as one of the best aluminum innovations
in recent years.
For the upstream segment, Alcoa will key in on
generating revenue growth through their bauxite
production. China, who accounts for roughly 50% of
the world’s aluminum consumption, is yet to be self-
sufficient in mining Bauxite. Their production levels
are projected to remain at high levels in the near
future which will allow Alcoa to capture this demand.
Moreover, the Indonesian government has placed a
ban on bauxite mining.16
China, who imported nearly
55 million metric tons of bauxite from Indonesia in
2013, must look elsewhere to obtain the bauxite they
need to produce alumina and consequently
aluminum.9
PRODUCTS AND MARKETS
Alcoa’s product line is segmented into 5 sections:
Alumina
Primary Metals
Global Rolled Products
Engineered Products and Solutions
Transportation and Construction Solution
COMPANY ANALYSIS
8. 8 | P a g e
Alcoa’s Alumina segment operations consist of
mining Bauxite which is refined into alumina. Alcoa
established a joint-venture with Alumina Ltd. named
AWAC in order to gain ownership of mines and
refineries in Australia. Alcoa has full ownership
rights in three Bauxite mines and has equity interest
in three others. In 2015 the company mined a total of
45.3 million metric tons of bauxite, making them the
world’s largest bauxite miner.24
Alcoa only sold
2mmt of Bauxite to third-party customers, but given
their strong position as the world’s largest miner, we
expect this to become an additional revenue stream in
the future. Below is a map of Alcoa’s mines, with the
largest located in Australia with an annual production
of 31.7mmt.24
Source: Fool.com17
Upon mining, bauxite is sent to processing plants for
refinement. Bauxite is expensive to physically
transfer, so it benefits them to have their refineries in
close proximity to their mines. Upon refinement,
Alcoa either sells the alumina to third-party customers
or sells it to their downstream operations at market
price. In 2015, the Alumina segment generated sales
of $5,142M, with $3,455M (67.2%) sold to third-
party customers and the remaining $1,687M (32.8%)
sold to Alcoa’s smelting division. Their percentage of
sales sold to its smelting segment has decreased in
each of the past three years (35.6% in 2014, 40.1% in
2013).24
This is due to management’s objective of
curtailing idle capacity. In 2016 they reduced their
total idle capacity by 58%, which management is
hopeful will lower their position on the cost curve
from the 23rd
percentile to the 21st
percentile.23
Below
is a map showing Alcoa’s alumina refining facilities.
Alcoa saves on transportation costs by positioning a
majority of their alumina refineries near their Bauxite
mines.21
Source: Fool.com17
Alcoa’s Primary Metals segment consists of the
smelting process that transforms alumina into
aluminum. As previously mentioned, smelting is a
highly energy and capital-intensive process. On
average, it takes Alcoa between 12,900 kwh - 17,000
kwh (kilowatts per hour) to smelt one metric tonne of
aluminum, compared to 200 kwh - 260 kwh to refine
one metric tonne of alumina.24
Once the aluminum is
produced it is either sold to customers and traders on
the LME (London Metals Exchange), or sold to
downstream segments at market price.23
The company’s Globally Rolled Products (GRPs)
represent Alcoa’s midstream operations. Globally
Rolled Products include sheet metal, which Alcoa
supplies to the automotive industry. Alcoa has
expanded several rolling mill factories in US as of
late. In 2015, Alcoa completed the expansion of their
Tennessee facility in order to produce and supply
aluminum sheet to automakers such as Ford, Fiat
Chrysler, and General Motors. In its Iowa-based
facility, Alcoa has grown their product line in the
aerospace and industrial market. Alcoa’s innovative
technology has resulted in high performance
aluminum which can be installed in wing ribs for
planes.24
A key distinction in Alcoa’s global rolled products is
its patented MicromillTM
process. This process gives
the aluminum a microstructure that makes 30%
lighter, 40% more formable, and 30% stronger than
conventional metal. It also allows a portion of the
production time to be reduced from 20 days to just 20
minutes.19
The technology has been applauded
throughout the industry and was recently recognized
as an R&D 100 Award winner, which is equivalent to
9. 9 | P a g e
the “Oscars of Invention.” It was also the main reason
Alcoa won the long-term supply contract with Ford.19
We believe this is a major competitive advantage for
the company that will allow it to continue to capture
the growing demand in the automotive and aerospace
industry.
Another portion of Alcoa’s downstream operations
stems from Engineered Products and Solutions. This
segment consists of titanium, fastening systems &
rings, forgings & extrusions, and power &
propulsions. These products are primarily produce
goods for commercial aerospace & transportation, and
power generation end markets. Over 70% of third-
party sales from this segment derive from the
aerospace market. Due to the European summer
slowdown, seasonal sales decrease during the third
quarter across all end markets. Within this segment,
Alcoa is also involved in oil & gas, industrial
products, automotive, and land & sea defense markets
through the production of forging and extrusion. In
order to attract more sales from the automotive
industry, Alcoa invested $22 million to manufacture
titanium, nickel, and additive parts to be used for
some of the world’s best-selling engines.
Additionally, in order to capture aerospace demand,
the company acquired Firth Rixson, TITAL, & RTI
International and has also expanded facilities in
Virginia and Indiana to further innovate and produce
improve aerospace parts for its customers.21
The remainder of the downstream operations comes
from Alcoa’s Transportation and Construction
Solutions products. Primary end markets for the
segment include commercial building & construction
and commercial transportation. Aluminum is mainly
used to produce structural and architectural parts as
well as aluminum wheels for commercial vehicles.
These are sold directly to consumers through
distributors. In Hungary, Alcoa has doubled its wheel
manufacturing capacity to produce stronger and eco-
friendly aluminum wheels.21
CORPORATE STRATEGY
The nature of Alcoa’s business leaves them highly
exposed to fluctuations in the price of aluminum.
Because the price of aluminum and the performance
of the company go hand in hand, Alcoa is more likely
to benefit and observe higher margins when
aluminum prices rise, resulting in higher profitability.
Year to date, the aluminum market has observed
favorable economic conditions; cash prices are up
roughly 14% since January.2
Source: LME.com
The chart above illustrates the 1-yr price performance of aluminum
This is a far cry from a year ago, when the LME price
sank to approximately $1440 per tonne. Last year’s
price fallout was the result of a supply glut caused by
Chinese exports flooding the market, in part due to a
government-issued subsidy benefit that, following a
complaint filed by the U.S. department of trade, has
since been ceased.34
Even before the price fallout,
Alcoa’s management recognized the need to take
action and reduce their exposure to extreme price
fluctuations. Their strategy is simple: lower their
position on their cost curves in order to improve their
margins.21
Energy Cost Reductions
In an effort to move from the 43rd
percentile of the
aluminum cost curve to the 38th
percentile, Alcoa has
closed 8 of the 10 existing smelting plants in the US,
where energy prices are relatively higher. The US
national industrial average price of electricity is
$0.0706/kWh, while Chinese smelters are paying
$0.050-0.055/kWh. Moving their operations
elsewhere has helped their margins. In 2013, energy
made up 26% of aluminum production costs, which
has been reduced to 23%. Alcoa should continue to
improve their margins as they implement capacity
cuts at cost-inefficient smelters.18
New Revenue Streams
As mentioned previously, Alcoa’s management has
placed a recent emphasis on selling bauxite. Having
sold only $71 million to third-part customers in 2015,
Alcoa already has secured contracts valued at $370
10. 10 | P a g e
million over the next two years. At 37%, bauxite sales
have a much higher EBITDA margin than alumina
(18.1%) and aluminum (4.8% combined). With the
industry shift towards using the new alumina price
index, the spotlight will be on bauxite to drive the
price. Alcoa is set to capitalize on their favorable
bauxite position.2
Breaking Up
On November 1st
, 2016, Alcoa will split into two
separate companies. The parent company will be
named Arconic (ARNC) and will consist of the
downstream segments that feature value-added
products, while the new upstream company will retain
the name Alcoa and focus on the mining, refining,
and smelting operations. Management decided that
although the vertical integration was an advantage,
the upstream division was holding back Arconic’s
potential for growth. With the split, Arconic will take
virtually all of the company’s $9 billion in debt,
which will ease the burden of the new upstream spin
off company.2
For the sake of our valuation, we
affirm that our projections and analysis were done as
if the company would not be splitting up, however we
recognize that the split will have potential benefits for
each new company.
LIFE CYCLE
Having been in existence for over a century, Alcoa is
a mature player in the materials industry. Since the
2008 financial crisis Alcoa’s market cap has been
volatile, ranging from $9.2 billion in 2012 to $19.2
billion in 2014. Alcoa’s current market cap stands at
$12.6 billion.24
This is a primary reason for the split
of the company, as Alcoa believes the value-added
segment has the potential for more growth, while the
focus of the upstream company is to cut costs and
focus on driving out third party sales of primary
metals.
FINANCIAL SUMMARY
Alcoa’s stock is currently priced at $21.44/share. It is
currently price near the bottom of its 52 week range
of $20.00 - $29.99. The stock’s forward P/E is 94.5.
The aluminum industry holds a significantly lower
forward P/E of 13.11. In Q1 and Q2 of 2016 Alcoa
beat earnings forecasts with net income of $151 M.
This was significantly down from the same period in
2015, but this can be partly attributed to Alcoa’s sale
of $1.2 billion worth of assets. This sale of assets has
helped Alcoa build up a significant amount of cash
($1.9 billion) as it prepares to reposition itself
following the upcoming split of the company into two
separate entities. Additionally, Alcoa missed analyst
estimates in Q3 by $0.03 after reporting $0.32 a
share. Despite the miss, Alcoa’s earnings per share
saw a 52% increase year over year.12, 13
MAJOR ACQUISITIONS
Since 2014, Alcoa has acquired three major
companies in order to grow their Engineered Products
segment, and more specifically their aerospace
division.
In 2014, Alcoa acquired Firth Rixson, a jet
turbine parts supplier, for $2,995M. The
acquisition has helped Alcoa secure 4 supplier
contracts with Boeing to produce aerospace
parts.29
In 2015, Alcoa acquired TITAL, a European
titanium producer with close ties to aerospace
manufacturers, for $204M.30
Also in 2015, Alcoa acquired RTI
International Metals for $1,500M. RTI is a
titanium and specialty metal producer that
specializes in aerospace products. With the
acquisition, Alcoa gained R&D that
specialized in finding 3D printing solutions
for their aerospace division.32
In 2016, they
announced an increase of $60M towards the
R&D division and secured 2 supplier contracts
with aerospace manufacturer Airbus.31
These acquisitions helped Alcoa gain a total of over
$10B in supplier agreements and helped position
Alcoa as a leader in aerospace manufacturing. Sales
for the Engineered Products segment grew 27% in
2015, and 6-months sales in 2016 were up 15% over
the same time period in the previous year.22,23
11. 11 | P a g e
KEY INVESTMENT POSITIVES & NEGATIVES
(SWOT ANALYSIS)
Strengths:
Global Presence
Alcoa operates in 30 countries and has over 200
operating locations worldwide. This helps Alcoa
distribute risk, encounters new avenues to generate
growth, and enrich the global Alcoa brand.25
MicromillTM
Technology
Alcoa’s award winning MicromillTM
technology has
shown to be a competitive advantage for Alcoa. It
should continue to help the company lock down
supplier contracts.
Diverse Revenue Streams
Alcoa generates revenue from 5 primary business
segments preventing overdependence on one or two
streams. The diversification of Alcoa’s operating
portfolio allows the company to minimize business
risk and diversify its customer base.25
Weaknesses:
Domestic Overdependence
In 2015, the US accounted for 55% of all Alcoa sales.
An overdependence on United States sales could be
of concern to Alcoa. U.S. downturns such a political,
economic, or climatic developments could
significantly destroy Alcoa’s operations. 25
Opportunities:
Global Aluminum Outlook
The global aluminum outlook has several positive
trends. As previously stated, in the US and Canada,
aluminum demand grew by 2% and the aluminum
demand in transportation spiked 4.6%.
Capturing Automotive Innovations
Analyst estimate that by 2020, 75% of all new pickup
trucks in the U.S., Mexico, and Canada will be
aluminum-bodied. By 2025, the overall aluminum
content in vehicles will increase by roughly 40%. As
automakers turn to aluminum to make their vehicles
lighter in order to increase fuel capacity, Alcoa is
well-positioned to capture this demand growth.
Positive Aerospace Outlook
By 2034, the total aircraft (both passenger aircrafts
and freighter crafts) market is estimated to grow to
$4.9 Trillion. We see Alcoa’s increase in aerospace
investment as a major strength of their downstream
operations. Their investments have secured major
supplier contracts and have already increased revenue
growth.
Acquisitions
The acquisitions of TITAL, RTI, and Firth Rixson
should help Alcoa make distinguished products to
better capture the automotive and aerospace
industries.
Threats:
Foreign Currency Fluctuations
Alcoa is vulnerable to increased expenses as a result
of foreign currency exchange rates. The appreciation
of the US Dollar over currencies such as the
Australian Dollar, British Pound, Euro, Brazilian Real
and others could incur additional costs to Alcoa as
well as additional capital expenditure costs in US
Dollars.
Aluminum Commodity Prices
Alcoa may be exposed to negative commodity prices
in times of economic downturns or overproduction
among global aluminum producers such as China. If
overproduction occurs, pricing pressure can drive
aluminum down hurting Alcoa’s margins.
After extensive research, we recommend a HOLD
rating on Alcoa. We have conducted discounted
cash flow (DCF) and economic profit (EP)
valuations which have rendered a stock price of
$34.42 indicating that Alcoa is currently
undervalued. Agreeably, our price-to-sales
VALUATION ANALYSIS
12. 12 | P a g e
relative valuation priced Alcoa at $34.11. Both
approaches indicate a current undervaluation of
Alcoa. On the contrary, our dividend discount
model (DDM) projected a price of just $11.72
indicating a significant overvaluation. The DDM,
however, was not as equally critical due to
Alcoa’s low dividend payout.
KEY ASSUMPTIONS
Revenue Decomposition
Alcoa Corporation’s sales are made up from 5
revenue streams: Alumina, Primary Metals,
Global Rolled Products, Engineered Products &
Solutions, and Transportation and Construction
Solutions.
Due to the significant amount of upstream
facility closures Alcoa’s has made as of
late, we forecast Alcoa’s Alumina
shipments to decrease by -14.0% in 2016,
however with substantial price growth of
25.0%, segment revenue should grow
7.5%. In the long-term horizon we see
shipments and price growth stabilizing.
We project long term segment revenue
growth of 4.5%.
Similarly, in 2016 we expect Primary
Metals shipments to decrease -13.0%, with
price growth of 9.0%. Overall segment
revenue should decrease by -5.2%, which
is still much better than the previous year’s
decrease of -17.8%. In the long-term, we
also see Primary Metals shipments and
price growth stabilizing, and project long
term segment revenue growth of 6.1%.
As a result of lower upstream metal
production, Global Rolled Products and
Transportation & Constructions Solutions
segment revenues are forecasted to
decrease in 2016 by -7.3% and -5.0%,
respectively. Beyond 2016, we expect
these segments to be high margin revenue
drivers, with long term continuing value
growth rates of 3.0% and 4.0%.
Due to strong supplier contracts with
Boeing and Airbus, despite the production
cuts to upstream segments we are
forecasting Engineered Products and
Solutions segment revenue growth of 5.5%
in 2016. Long term growth should be
stable, as we project continuing value
segment growth of 4.0%
In 2016, our model forecasts a decrease in overall
revenue of -0.46%, which should rebound in the
following year to growth of 8.44%. In the long
term, we forecast overall continuing value
revenue growth of 4.37%.
Cost of Goods Sold & SGA
In recent years, Alcoa’s management has taken
substantial measures to cut cost. In 2014 & 2015,
COGS were roughly 80% of Sales. During this
time, we saw the initial activities Alcoa took to
start their cost cutting plan. Management guidance
has been vocal about their aggressive stance to
further cut costs. 2016 going forward, we believe
COGS will drop to 79% of Sales.
Alcoa’s average historical SGA was 4.52% of
Sales. We forecasted a slight reduction and
brought the percentage down to 4.50%
Weighted Average Cost of Capital
We calculated Alcoa’s Weighted Average Cost of
Capital to be 7.39%. We first used the Capital
Asset Pricing Model (CAPM) to retrieve our Cost
of Equity. We used 2-year monthly raw beta from
Bloomberg to find our systematic risk. Our risk-
free rate was the 30-year Treasury yield taken
from Treasury.gov.7, 24
The after-tax cost of debt was arrived at by taking
our pre-tax cost of debt found by taking Alcoa’s
longest debt maturity yield on FINRA and
multiplying this by our marginal tax rate. Cost of
preferred stock Class A and Class B were
measured by taking Class A and B dividends and
Class A and B share prices, respectively.
For to find the weight of equity and preferred
shares, we calculate the market value of each by
taking the share price and multiplying by shares
outstanding. For the weight of debt, we added the
13. 13 | P a g e
book value of debt, which consisted of the PV of
operating leases, and the market value of debt.
Discounted Cash Flow & Economic Profit
The Discounted Cash Flow and Economic Profit
valuation both projected, after calendar
adjustments, a price of $34.42 for Alcoa. This
valuation implies a 19.8% increase from Alcoa’s
current stock price indicating that the company is
undervalued.
Relative Valuation
We chose to conduct a price to sales analysis as
opposed to a price to earnings analysis for two
reasons: In early October, Alcoa completed a 1-3
reverse stock split which skewed its forward P/E.
Alcoa’s price to earnings of 94.5 would now be
considered an outlier for the aluminum industry
average that sits around 13. In addition, several
companies have negative earnings making for
irrelevant price to earnings valuations.
In order to compute price to sales we first took the
number of shares outstanding over the projected
2016 Sales of each company to find sales per
share. We then took each company’s share price
over their respective sales per share to arrive at
their final price to sales ratio. Lastly, we took
Alcoa’s projected 2016 sales per share and
multiplied this by the competitor median. The
valuation calculated Alcoa’s price to be $30.65,
slightly lower than our DCF. Nonetheless, the
valuation indicated that Alcoa was also
undervalued.
We conducted several sensitivity analyzations to
better understand how our assumptions could
impact the price of Alcoa’s stock. We chose what
we thought we our most influential assumptions to
gauge Alcoa’s price behavior in reaction to
changes in these specific assumptions.
Gross Margin Vs Beta
We felt it necessary to include gross margin
because of managements guidance stating their
aggressive plan to cut costs in the near future.
Decreasing the gross margin by a mere 1.5%
almost doubled Alcoa’s price. As for beta, we
realized the impact WACC had on the price and
wanted to break out the WACC’s components to
shed light on each part’s impact. This analysis
yields a whopping range of $13.08 to $75.79.
PPE as % of Sales Vs Marginal Tax Rate
Property, Plant and Equipment was decided on to
echo possible changes in Alcoa’s long-term
assets. Due to Alcoa’s recent closures of smelting
and mining facilities, we wanted to see the impact
this would have on Alcoa’s price. The marginal
tax rate was analyzed in order to observe price
reactions to government regulations. This analysis
yielded a smaller range of $28.11 to $40.01
NOPLAT CV Growth Vs ROIC CV Growth
NOPLAT CV was measured to gauge how
EBITDA and taxes would affect Alcoa’s share
price. ROIC CV was tested to understand how the
difference between the ROIC CV and the WACC
would affect Alcoa’s economic profit and
consequently, its share price. This analysis
yielded a range of $28.81 to $71.42.
Risk Free Rate Vs Equity Risk Premium
The interest rates are one of the largest drivers for
Alcoa, and therefore we felt it necessary to
understand the impacts of the risk free rate and the
equity risk premium. It was clear to see that rising
interest rate would negatively impact Alcoa. This
analysis yielded a range of $22.93 to $55.22.
Cost of Debt Vs. SG&A % of Sales
Alcoa management has places a lot of emphasis
on reducing SG&A, and therefore we felt it
necessary to understand the impact of it with
respect to our cost of debt. We found that at
current levels, a 0.25% decrease in SG&A costs
boosts our stock price by approximately 7%,
while a 0.32% decrease in the current cost of debt
boosts stock price approximately 4%. This
analysis yielded a range of $23.38 to $47.35.
SENSITIVITY ANALYSIS
14. 14 | P a g e
Important Disclaimer
This report was created by students enrolled in the Security
Analysis (6F:112) class at the University of Iowa. The report
was originally created to offer an internal investment
recommendation for the University of Iowa Krause Fund and
its advisory board. The report also provides potential
employers and other interested parties an example of the
students’ skills, knowledge and abilities. Members of the
Krause Fund are not registered investment advisors, brokers
or officially licensed financial professionals. The investment
advice contained in this report does not represent an offer or
solicitation to buy or sell any of the securities mentioned.
Unless otherwise noted, facts and figures included in this
report are from publicly available sources. This report is not
a complete compilation of data, and its accuracy is not
guaranteed. From time to time, the University of Iowa, its
faculty, staff, students, or the Krause Fund may hold a
financial interest in the companies mentioned in this report.
15. 15 | P a g e
References:
1
Pyles, Brad W., and Andrew S. Teufel. Fisher Investments on
Materials. Hoboken, NJ: John Wiley & Sons, 2009. Print.
2
O'Hara, Mark. "Has Alcoa's Split Lived Up to the Hype?"
Market Realist. N.p., 08 Nov. 2016. Web.
3
Lovelace, Berkeley. "Alcoa Sinks after Earnings, Revenue
Fall Short of Expectations." CNBC. N.p., 11 Oct. 2016. Web.
15 Nov. 2016.
4
"United States GDP Growth Rate | 1947-2016 | Data | Chart |
Calendar." N.p., n.d. Web. 12 Nov. 2016.
5
Ip, Greg. "Does Donald Trump Spell an End to Fed's Low-
Rate Era? - WSJ - Http://www.wsj.com/articles/does-donald-
trump-spell-an-end-to-feds-low-rate-era-1478775604."N.p., 10
Nov. 2016. Web. 15 Nov. 2016.
6
Choudhury, Saheli. "Dollar Rises After Donald Trump
Clinches Victory; Mexican Peso Plummets." CNBC.com. N.p.,
09 Nov. 2016. Web.
6
"United States Dollar | 1967-2016 | Data | Chart | Calendar |
Forecast." United States Dollar | 1967-2016 | Data | Chart |
Calendar | Forecast. N.p., n.d. Web. 15 Nov. 2016.
7
"U.S. 30 Year Treasury." U.S. 30 Year Treasury - US30Y -
Stock Quotes. N.p., n.d. Web. 15 Nov. 2016.
8
Reynolds, Ben. "4 High-Quality Financial Stocks That Will
Benefit From Rising Interest Rates." TheStreet. N.p., 20 May
2016. Web. 15 Nov. 2016.
9
"Alcoa: Looking Past The Results." Seeking Alpha. N.p., 16
Oct. 2016. Web. 15 Nov. 2016.
10
Pianin, Eric. "As Roads Crumble, Infrastructure Spending
Hits a 30-Year Low." The Fiscal Times. N.p., 25 Feb. 2016.
Web. 15 Nov. 2016.
11
Harrison, David. "The World Needs to Boost Infrastructure
Spending, but Many Countries Are Cutting Back." WSJ.
Wsj.com, 15 June 2016. Web. 15 Nov. 2016.
12
"Alcoa Corp (AA) Stock Analysis - GuruFocus.com."
GuruFocus.com. N.p., n.d. Web. 15 Nov. 2016.
13
"Alcoa Corp." AA Stock Quote - Alcoa Corp. Stock Price
Today (AA:NYSE) - MarketWatch. N.p., n.d. Web. 15 Nov.
2016.
14
"China GDP Growth Rate | 2010-2016 | Data | Chart |
Calendar | Forecast." China GDP Growth Rate | 2010-2016 |
Data | Chart | Calendar | Forecast. N.p., n.d. Web. 15 Nov.
2016.
15
"India GDP Annual Growth Rate | 1951-2016 | Data | Chart |
Calendar." Trading Economics. N.p., n.d. Web. 15 Nov. 2016.
16
Rusmana, Yoga. "Indonesia Likely to Keep Ban on Nickel
Ore And Bauxite Exports." Bloomberg.com. N.p., 12 Oct.
2016. Web. 12 Nov. 2016.
17
Hall, Jason. "How Will a Trump Presidency Affect Alcoa
Corporation?" The Motley Fool. N.p., 1970. Web. 15 Nov.
2016.
18
Burns, Stuart. "Power Costs in the Production of Primary
Aluminum - Steel, Aluminum, Copper, Stainless, Rare Earth,
Metal Prices, Forecasting | MetalMiner." Steel Aluminum
Copper Stainless Rare Earth Metal Prices Forecasting
MetalMiner. N.p., 24 Nov. 2015. Web. 12 Nov. 2016.
19
Figueroa, Patricia. "Arconic’s Breakthrough Micromill™
Technology Wins Prestigious 2016 R&D 100 Award."
Business Wire. N.p., 10 Nov. 2016. Web.
20
Pi, Xiaoqing. "China Trumps Trump When It Comes to
Infrastructure." Bloomberg.com. Bloomberg, 13 Nov. 2016.
Web. 13 Nov. 2016.
27
President, BCG Senior Vice. "Global Aluminum Demand
and Supply Growth Rates 2015 | Forecast." Statista. N.p., n.d.
Web. 15 Nov. 2016.
28
"Global Market Forecast 2016-2035 | Airbus, a Leading
Aircraft Manufacturer." Airbus. N.p., n.d. Web. 15 Nov. 2016.
29
“Alcoa Acquires Firth Rixson, Grows Global Aerospace
Portfolio”. Alcoa Newsroom. Alcoa Corp., 20 Nov. 2014.
Web.
30
"Alcoa Completes Acquisition of TITAL." Alcoa Online
Newsroom. 3 Mar. 2015. Web.
31
"Alcoa Signs Contract with Airbus for High-Tech, Multi-
Material Fastening Systems." Alcoa Online Newsroom. N.p., 5
Oct. 2015. Web.
32
"Alcoa Completes Acquisition of RTI International Metals,
Growing Multi-Material Aerospace Portfolio." Alcoa Online
Newsroom. N.p., 23 July 2015. Web.
33
Mark O'Hara. "How Market Dynamics Impacted Alcoa and
Arconic." 8 Nov. 2016. Market Realist.
34
"China Ends 'Export Subsidies" But Aluminum Rebate
Remains.” MetalMiner. 19 Apr. 2016. Web.
Additional Sources
21
Alcoa 10-K, 2015
22
Alcoa 10-Q, Q2 2016
23
Acloa 10-Q, Q3 2016
24
Bloomberg Terminal
25
FactSet
26
ThomsonOne
17. Alcoa Inc.
Key Assumptions of Valuation Model
Ticker Symbol AA
Current Share Price $28.72
Current Model Date 10/31/2016
Common Shares Outstanding 438459934
Fiscal Year End Dec. 31
WACC 7.39%
Pre‐Tax Cost of Debt 4.315%
Market Value of Debt 9146045606
Beta 1.716
Risk‐Free Rate 2.86%
Equity Risk Premium 5%
CV Growth of NOPLAT 4.32%
Current Dividend Yield 1.3%
Marginal Tax Rate 35%
Intrinsic Price 34.42$
ROIC CV 8.29%
Cost of Equity 11.44%
27. Alcoa Inc.
Weighted Average Cost of Capital (WACC) Estimation
Risk‐Free Rate 2.86%
Risk Premium 5.00%
Beta 1.716
Cost of Equity 11.44%
Cost of Debt 4.315%
Marginal Tax Rate 35%
After‐Tax Cost of Debt 2.80%
Cost of Preferred Stock
Class A Shares Outstanding 546,024
Preferred Dividends ‐ Class A 3.75
Class A Share Price 90.4
Cost of Preferred ‐ Class A 4.15%
Class B Shares Outstanding 2500000
Preferred Dividends ‐ Class B 2.687
Class B Share Price 27.71
Cost of Preferred ‐ Class B 9.70%
Total Common Shares Outstanding 438459934
Common Share Price $28.72
Total Equity 12592569304
Book Value Debt 810408
Market Value Debt 9146045606
Total Debt 9146856014
Total Preferred ‐ Class A 49360569.6
Total Preferred ‐ Class B 69275000
Total Enterprise Value 21858060888
Weight of Equity 57.6%
Weight of Debt 41.8%
Weight of Preferred ‐ Class A 0.2%
Weight of Preferred ‐ Class B 0.3%
WACC 7.39%
CAPM
WACC
Weights
29. Present Value of Operating Lease Obligations (2015) Present Value of Operating Lease Obligations (2014) Present Value of Operating Lease Obligations (2013)
Operating Operating Operating
Fiscal Years Ending Dec. 31 Leases Fiscal Years Ending Dec. 31 Leases #REF! Leases
2016 243000 2015 205000 2014 198000
2017 168000 2016 172000 2015 165000
2018 130000 2017 131000 2016 135000
2019 100000 2018 101000 2017 103000
2020 74000 2019 79000 2018 80000
Thereafter 138000 Thereafter 165000 Thereafter 244000
Total Minimum Payments 853000 Total Minimum Payments 853000 Total Minimum Payments 925000
Less: Interest 101592 Less: Interest 108576 Less: Interest 131418
PV of Minimum Payments 751408 PV of Minimum Payments 744424 PV of Minimum Payments 793582
Capitalization of Operating Leases Capitalization of Operating Leases Capitalization of Operating Leases
Pre‐Tax Cost of Debt 4.32% Pre‐Tax Cost of Debt 4.32% Pre‐Tax Cost of Debt 4.32%
Number Years Implied by Year 6 Payment 1.9 Number Years Implied by Year 6 Payment 2.1 Number Years Implied by Year 6 Payment 3.1
Lease PV Lease Lease PV Lease Lease PV Lease
Year Commitment Payment Year Commitment Payment Year Commitment Payment
1 243000 232948.3 1 205000 196520.2 1 198000 189809.7
2 168000 154388.8 2 172000 158064.7 2 165000 151631.8
3 130000 114525.7 3 131000 115406.7 3 135000 118930.6
4 100000 84452.6 4 101000 85297.1 4 103000 86986.2
5 74000 59909.8 5 79000 63957.8 5 80000 64767.4
6 & beyond 74000 105182.8 6 & beyond 79000 125177.3 6 & beyond 80000 181456.2
PV of Minimum Payments 751408.0 PV of Minimum Payments 744423.8 PV of Minimum Payments 793581.9
30. Alcoa Inc.
Relative Valuation Models
Ticker Company Price # of Shares Market Cap 2016E 2017E 2016E 2017E P/S 16 P/S 17
ACH Aluminum Corp of China LTD $2.90 3,944,000,000 11,437,600,000 $17,184,920,000 $17,732,000,000 4.36 4.50 0.67 0.65
HNDL Hindalco Industries $2.34 2,065,200,000 4,832,568,000 $15,613,180,000 $16,294,830,000 7.56 7.89 0.31 0.30
NHYDY Norsk Hydro $4.57 2,069,000,000 9,455,330,000 $9,845,910,000 $10,219,380,000 4.76 4.94 0.96 0.93
486 UC Rusal $0.36 15,193,000,000 5,469,480,000 $7,742,580,000 $7,842,550,000 0.51 0.52 0.71 0.70
CSTM Constellium A $5.15 105,500,000 543,325,000 $5,252,000,000 $5,601,600,000 49.78 53.10 0.10 0.10
Median 0.67 0.65
AA Alcoa Inc. $28.72 437,624,652 12,568,580,013 $22,430,946,300 $24,323,045,894 51.3 55.6 0.56 0.52
Implied Value:
P/S (EPS16) 34.11$
P/S (EPS17) 35.85$
Sales Sales Per Share
31. Effects of ESOP Exercise and Share Repurchases on Common Stock Balance Sheet Account and Number of Shares Outstanding
Number of Options Outstanding (shares): 33,000
Average Time to Maturity (years): 6.08
Expected Annual Number of Options Exercised: 5,428
Current Average Strike Price: 11.91$
Cost of Equity: 11.44%
Current Stock Price: $28.72
2016E 2017E 2018E 2019E 2020E 2021E 2022E 2023E 2024E
Increase in Shares Outstanding: 5,428 5,428 5,428 5,428 5,428 5,428 434
Average Strike Price: 11.91$ 11.91$ 11.91$ 11.91$ 11.91$ 11.91$ 11.91$ 11.91$ 11.91$
Increase in Common Stock Account: 64,643 64,643 64,643 64,643 64,643 64,643 5,171 ‐ ‐
Change in Treasury Stock 0 0 0 0 0 0 0 0 0
Expected Price of Repurchased Shares: 28.72$ 32.00$ 35.67$ 39.75$ 44.29$ 49.36$ 55.00$ 61.29$ 68.30$
Number of Shares Repurchased: ‐ ‐ ‐ ‐ ‐ ‐ ‐ ‐ ‐
Shares Outstanding (beginning of the year) 436,720 442,148 447,575 453,003 458,431 463,858 469,286 469,720 469,720
Plus: Shares Issued Through ESOP 5,428 5,428 5,428 5,428 5,428 5,428 434 0 0
Less: Shares Repurchased in Treasury ‐ ‐ ‐ ‐ ‐ ‐ ‐ ‐ ‐
Shares Outstanding (end of the year) 442,148 447,575 453,003 458,431 463,858 469,286 469,720 469,720 469,720
32. VALUATION OF OPTIONS GRANTED IN ESOP
Ticker Symbol AA
Current Stock Price $28.72
Risk Free Rate 2.86%
Current Dividend Yield 1.30%
Annualized St. Dev. of Stock Returns 38.80%
Average Average B‐S Value
Range of Number Exercise Remaining Option of Options
Outstanding Options of Shares Price Life (yrs) Price Granted
Range 1 33,000 11.91 6.08 17.69$ 583,833$
Range 2
Range 3
Range 4 ‐$
Range 5 ‐$
Range 6 ‐$
Range 7 ‐$
Range 8 ‐$
Range 9 ‐$
Range 10 ‐$
Range 11 ‐$
Range 12 ‐$
Range 13 ‐$
Range 14
Total 33,000 11.91$ 6.08 19.73$ 583,833$