Download as PDF, PPTX


The document outlines the customer journey mapping process, focusing on understanding customer experiences and optimizing interactions across various touchpoints. It includes insights into the stages of the customer journey, elements for effective mapping, and tools to enhance stakeholder engagement. Additionally, it highlights the importance of performance indicators and customer satisfaction metrics for continuous improvement.
Introduction to the Shopper Journey Analysis conducted by the company. Discusses the scope and purpose.
Outlines various stages in customer journey mapping such as understanding purpose, gathering information, and analyzing journey stages and channels.
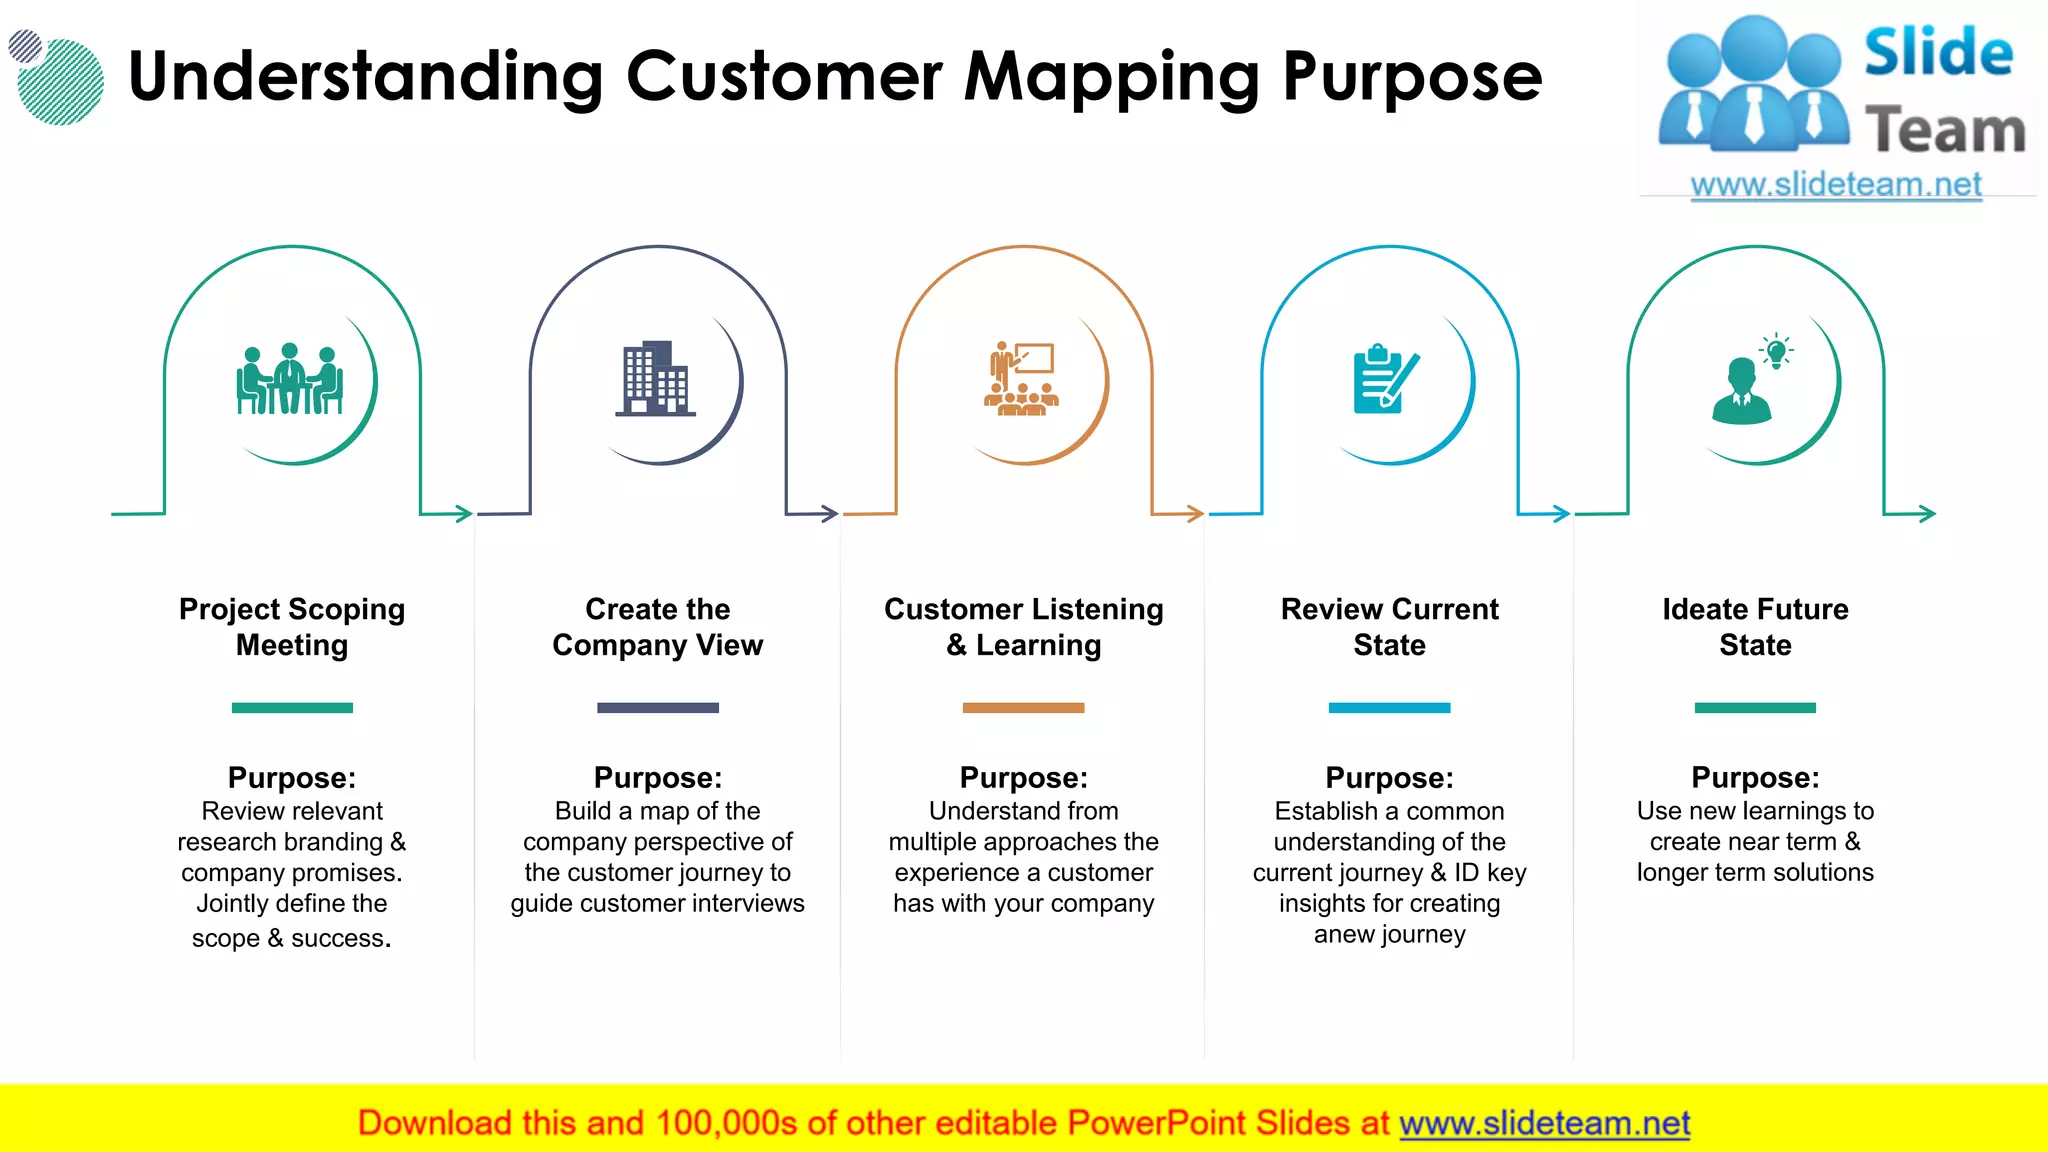
Details the objectives behind customer mapping including project scoping, understanding customer experiences, and creating future solutions.
Highlights the objectives, needs, feelings, and barriers customers face during the journey, emphasizing personalized engagement.
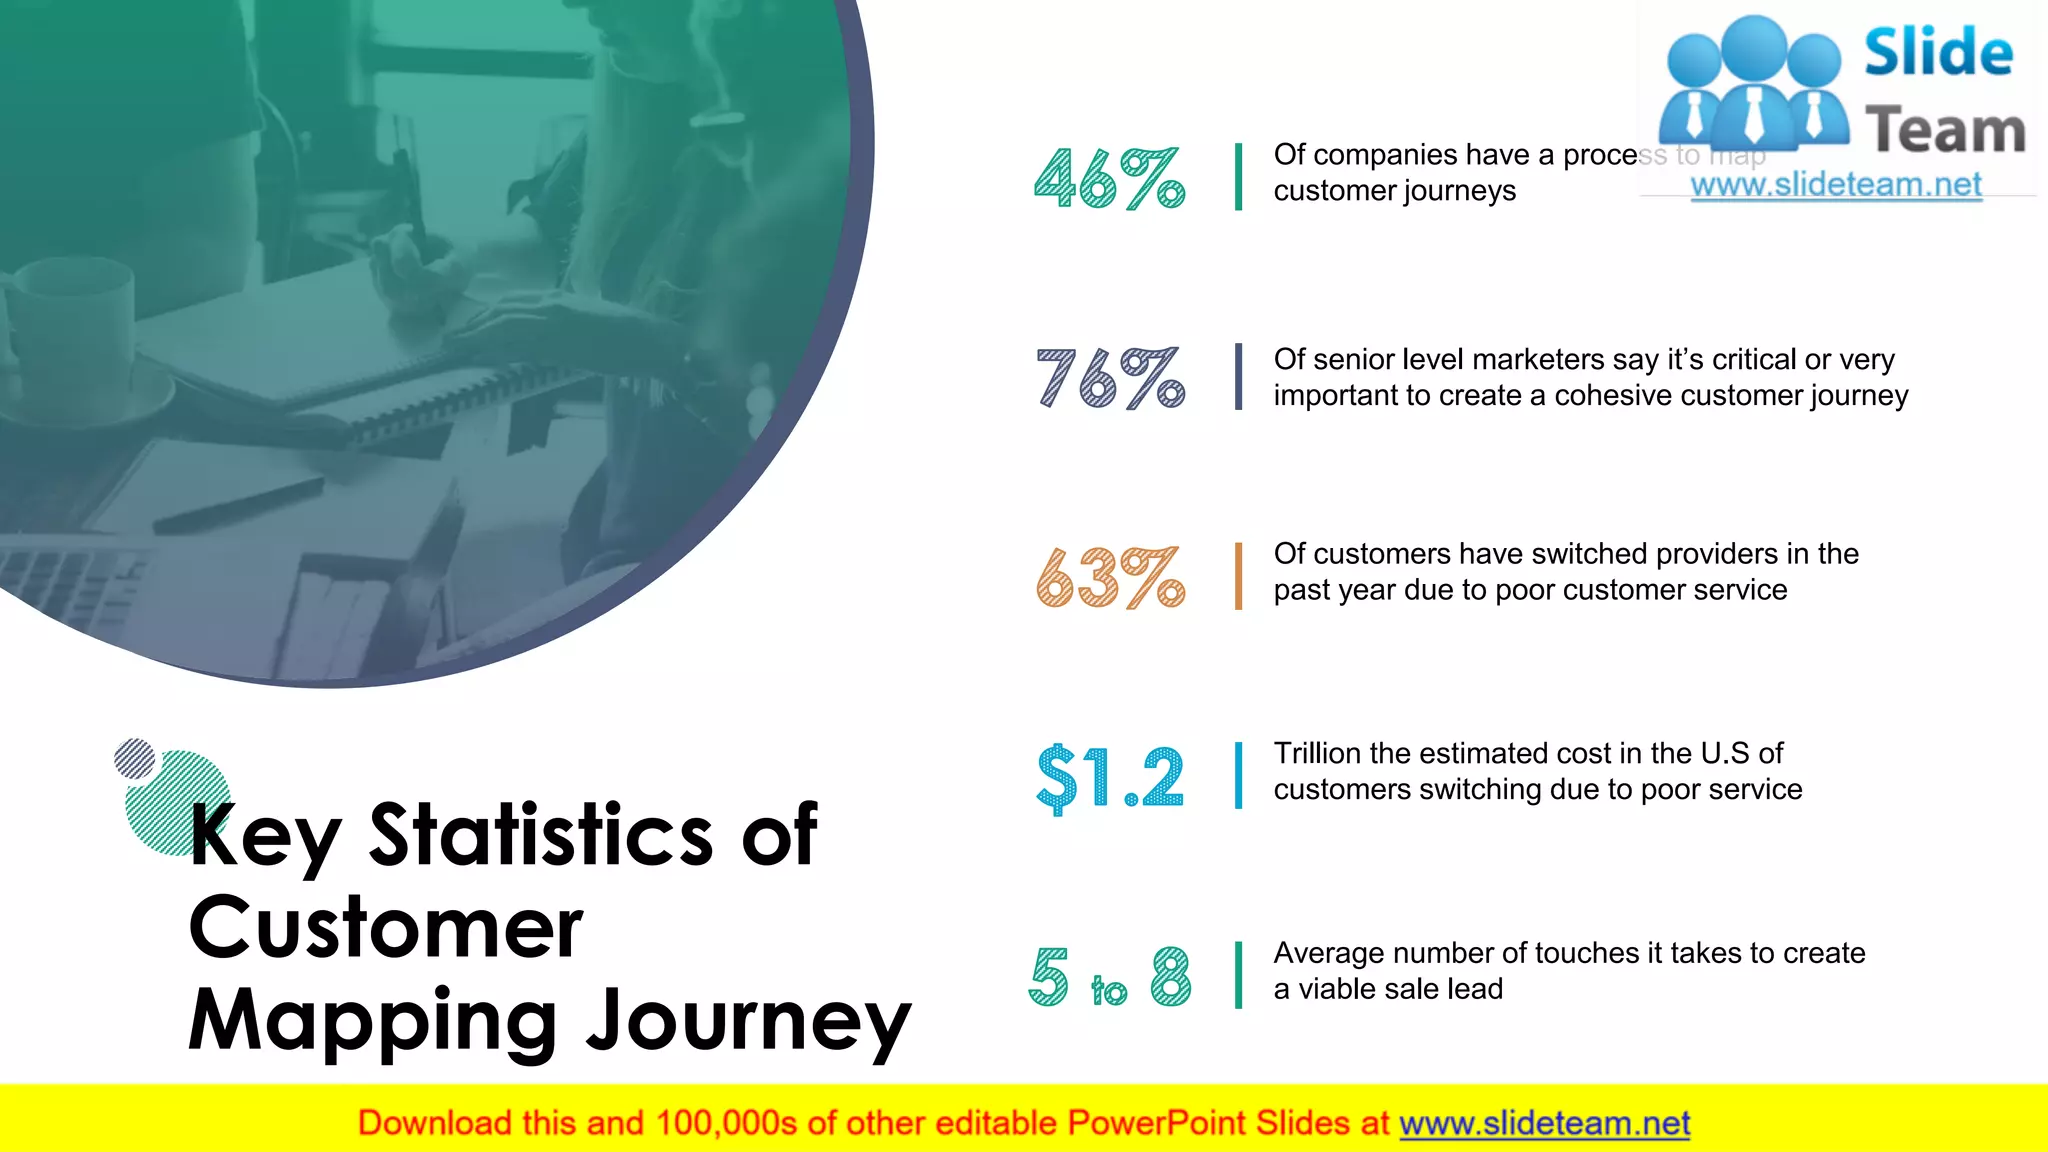
Presents key statistics about customer journey mapping, indicating its importance for businesses and impact of customer service.
Identifies essential elements in mapping customer journeys like customer thoughts, actions, feelings, and results from research.
Outlines critical steps in planning customer journey maps from planning and data gathering to analysis and continuous improvement.
Lists necessary information customers require at different journey phases such as pre-trigger, consideration, purchase, etc.
Describes the customer journey cycle from need generation to post-usage loyalty and the interactions involved.
Analyzes customer interactions at different stages like awareness, conversion, and loyalty, along with time frames for each stage.
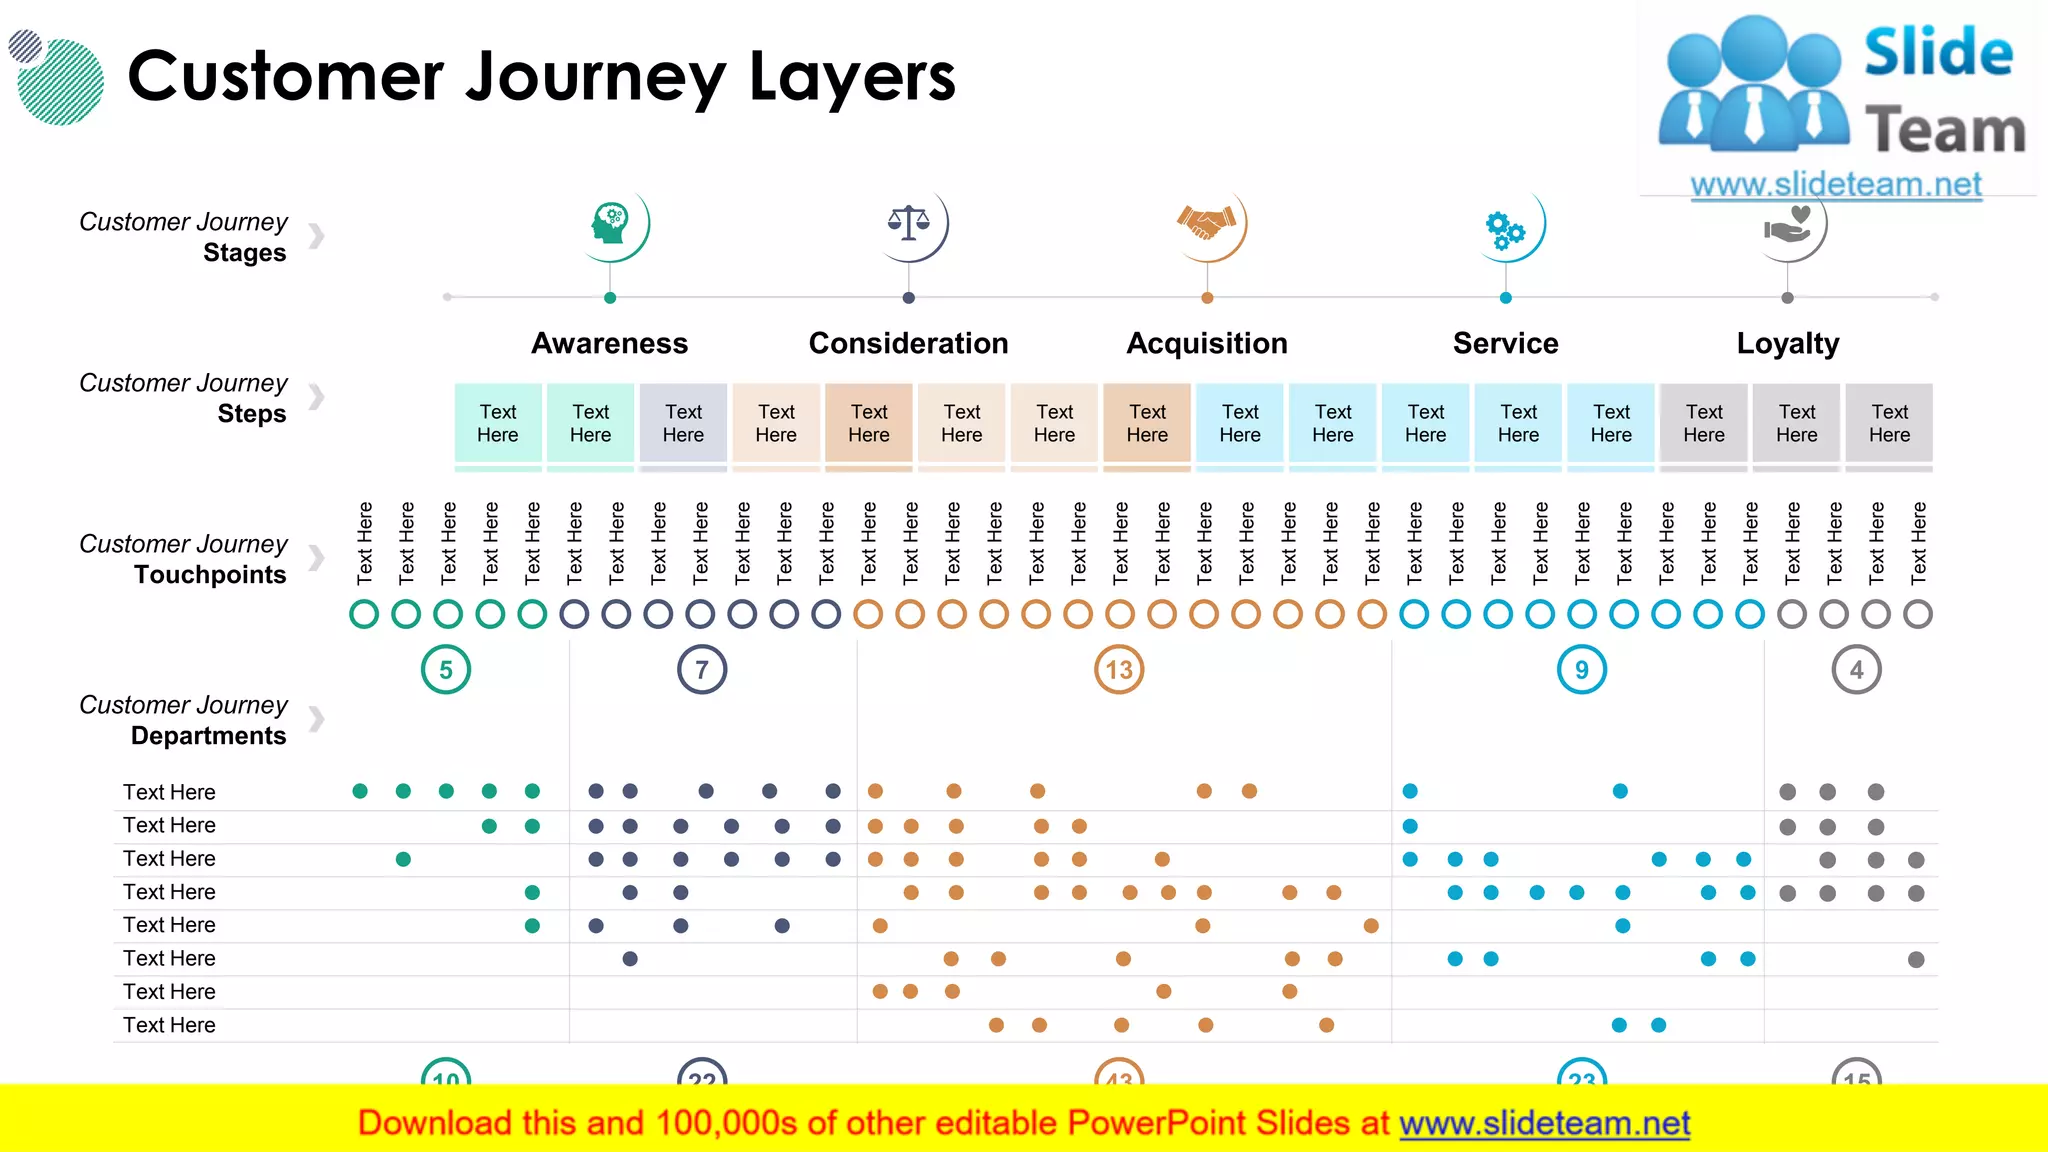
Explores different layers involved in the customer journey, including awareness, acquisition, and service.
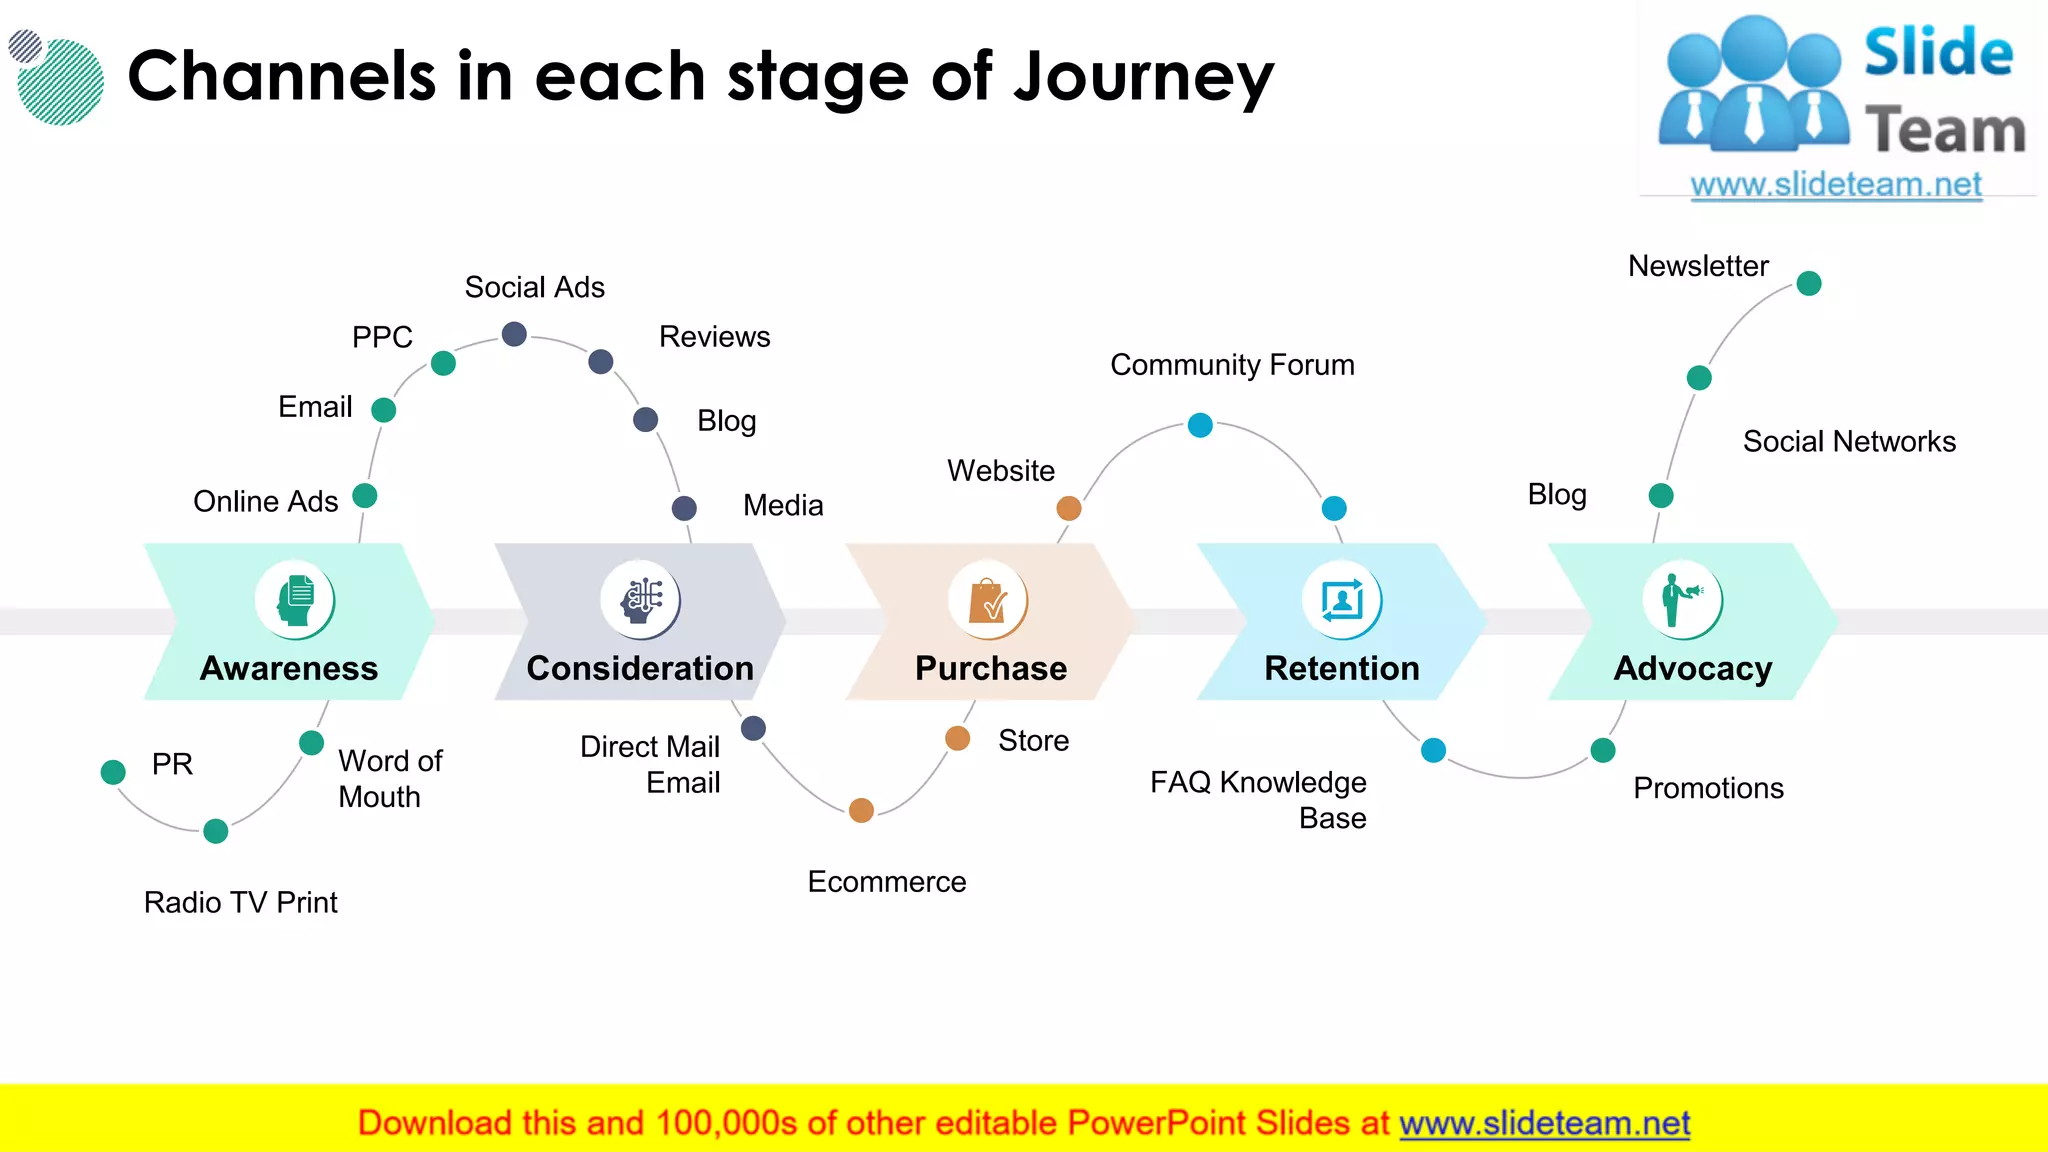
Discusses various channels used in different stages of the customer journey such as online, email, and social media.
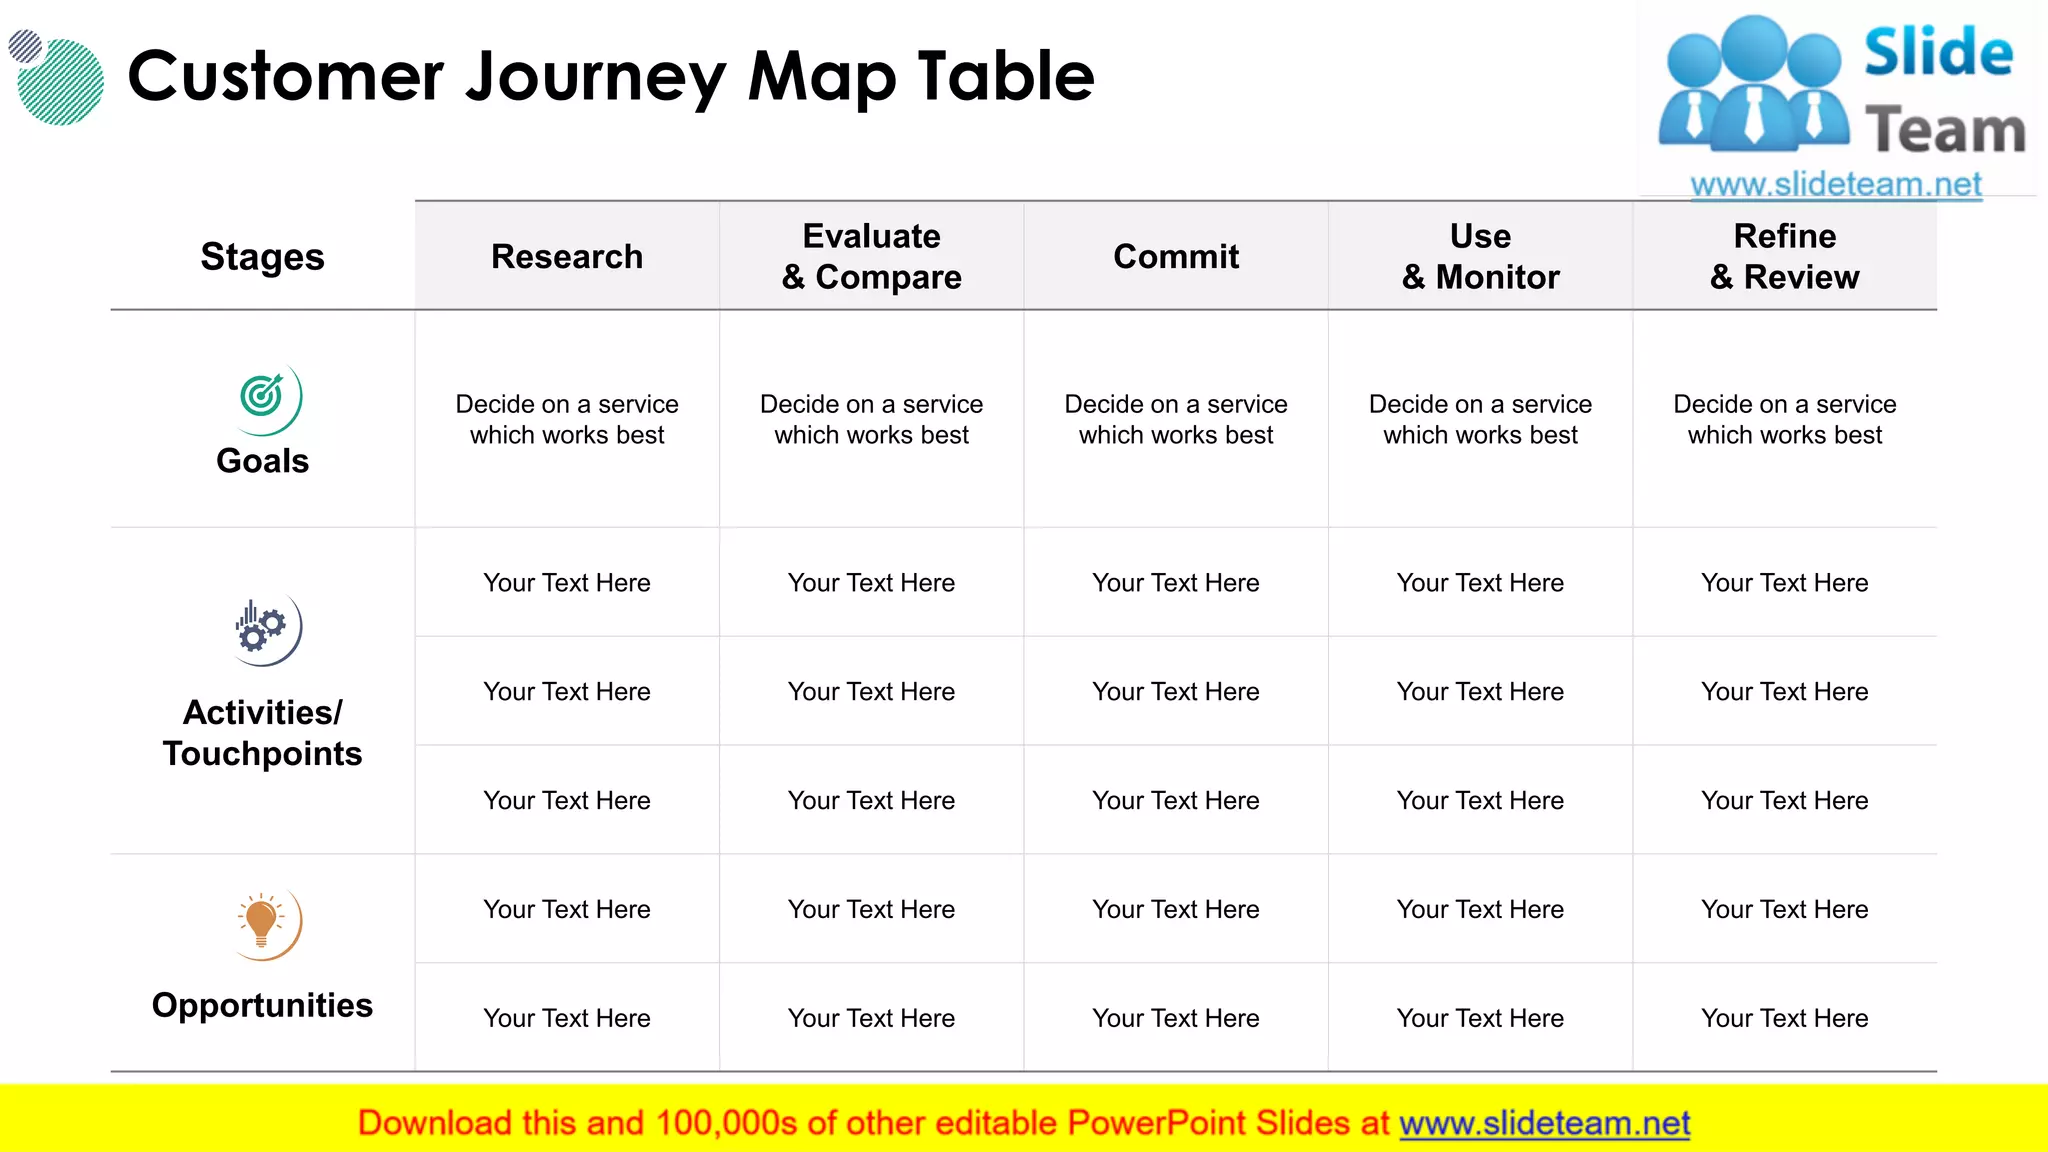
Illustrates touchpoints and activities in the customer journey and their respective opportunities for improvement.
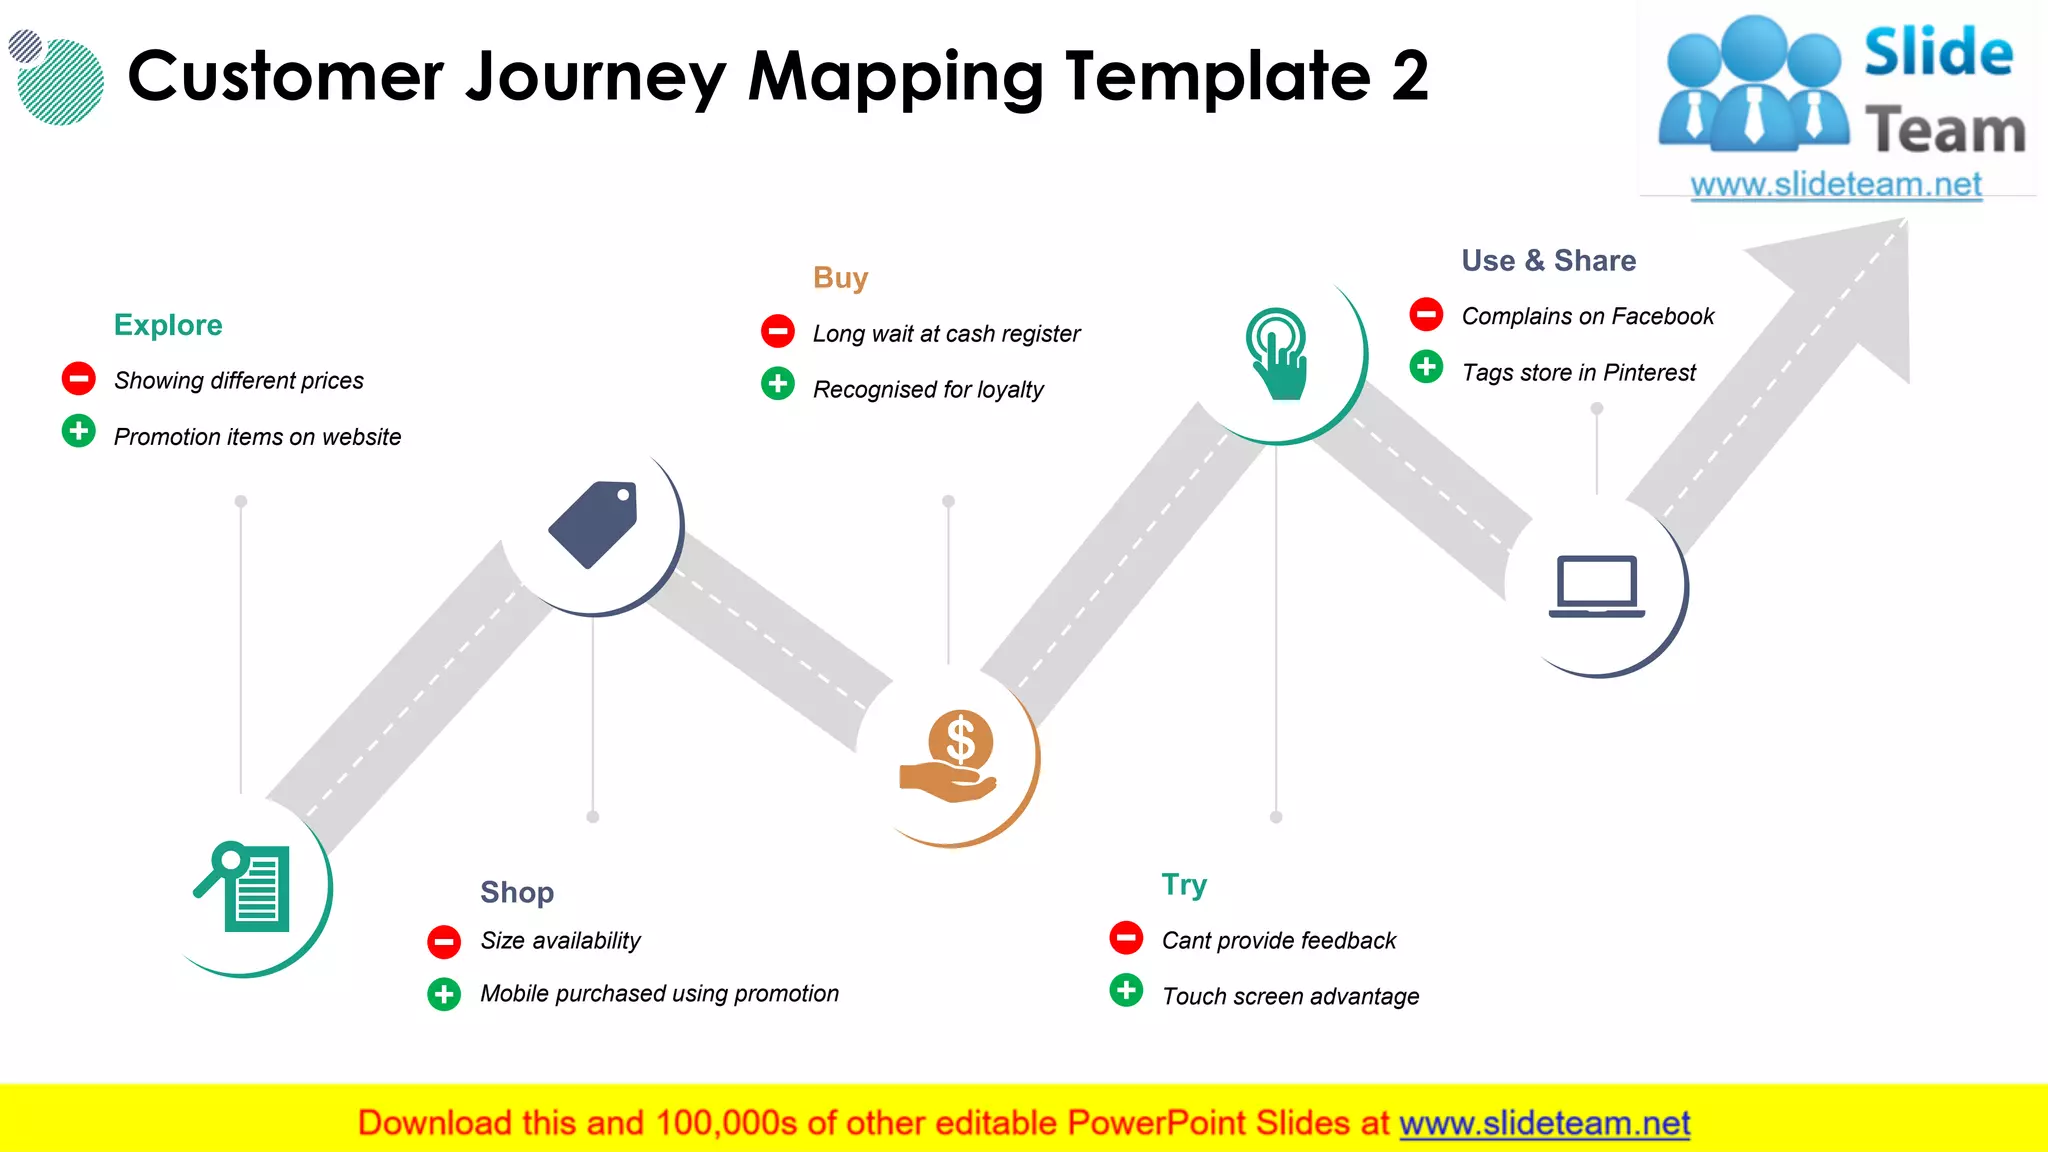
Demonstrates various touchpoints throughout the customer journey and the importance of customer interaction.
Provides templates for mapping customer journey touchpoints and processes across various stages.
Another customer journey mapping template exemplifying customer experiences at different touchpoints.
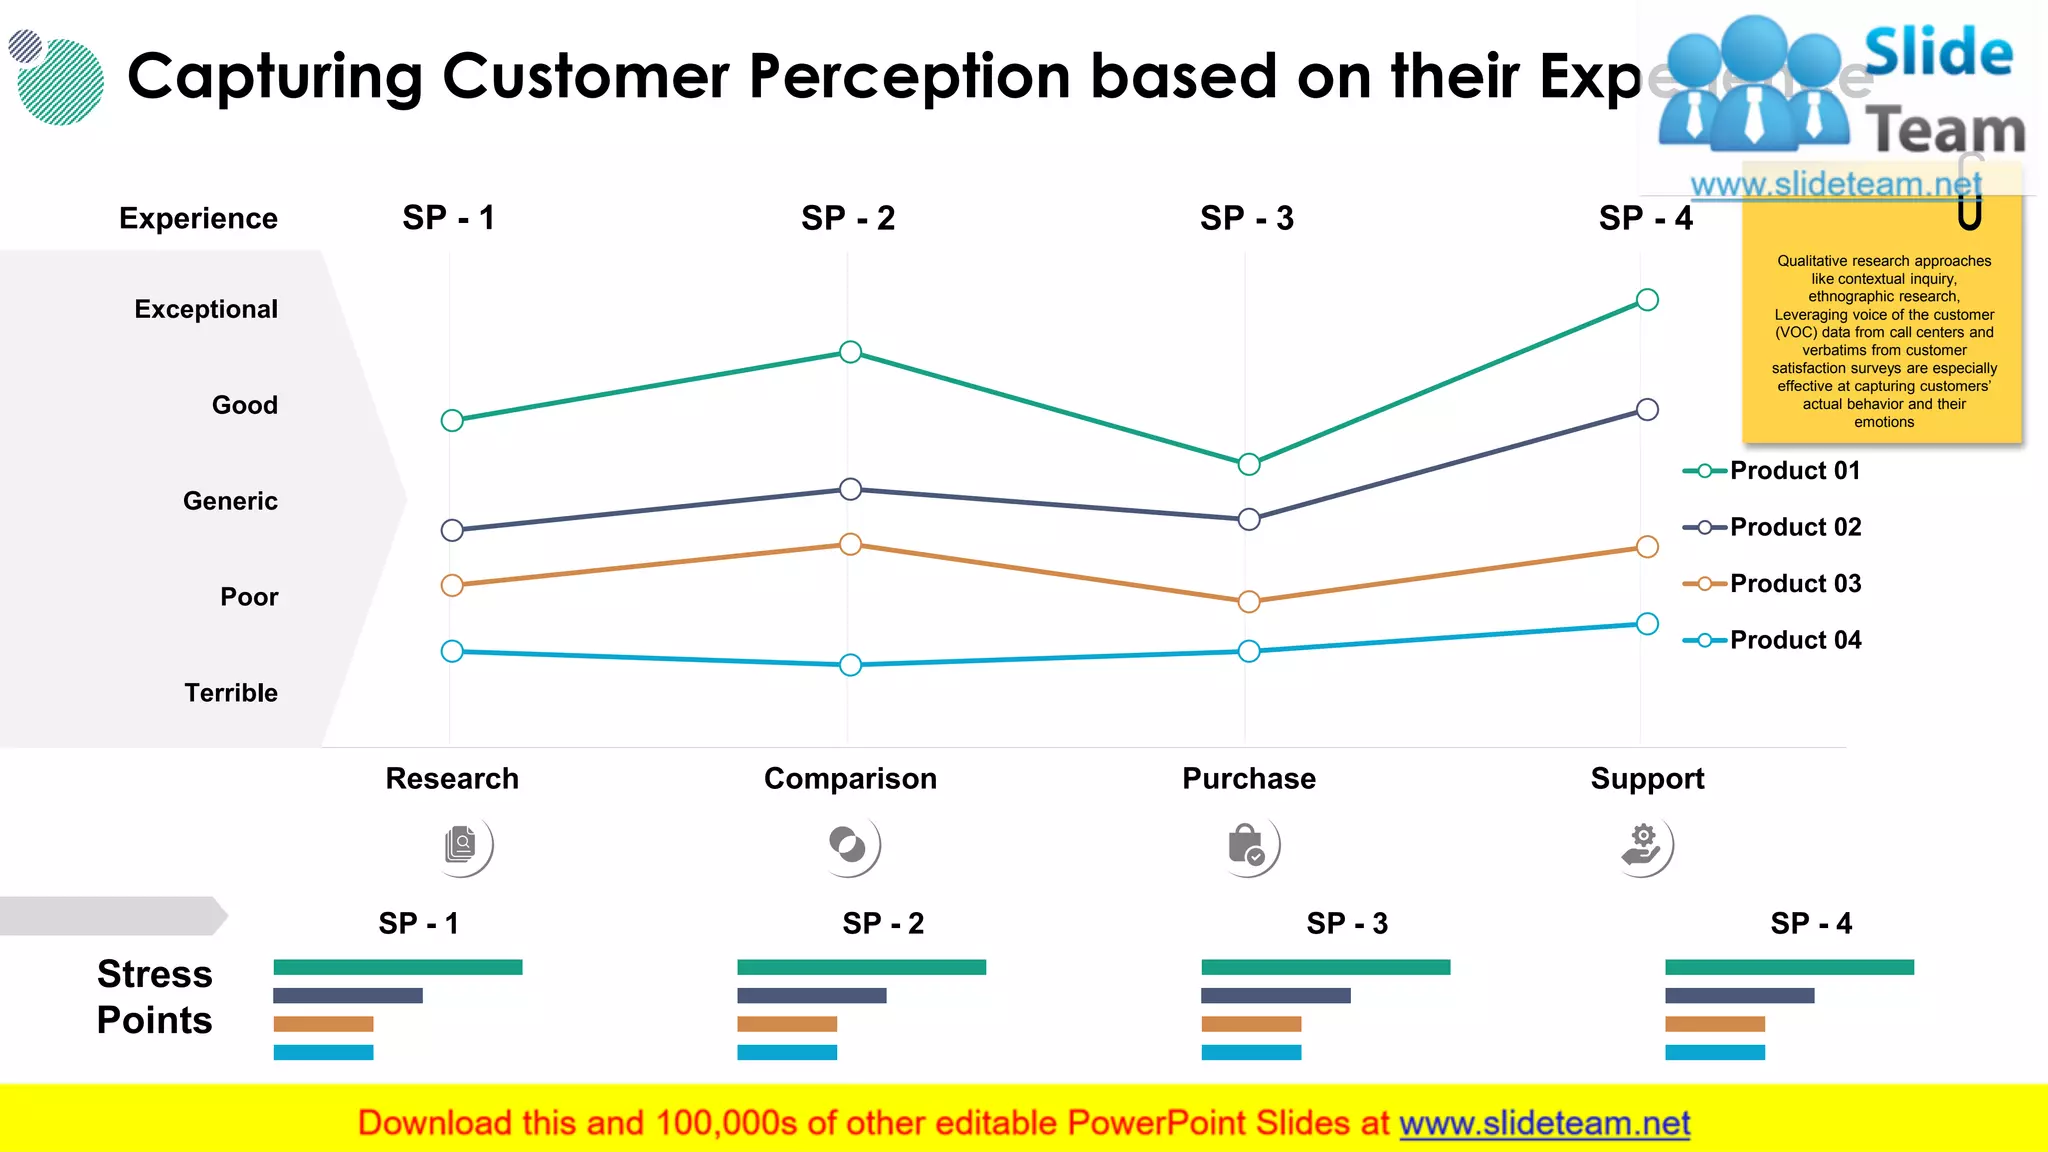
Explains qualitative techniques to capture customer perceptions and experiences, emphasizing voice of the customer data.
Evaluates customer experiences across touchpoints over time, assessing gaps and improvements.
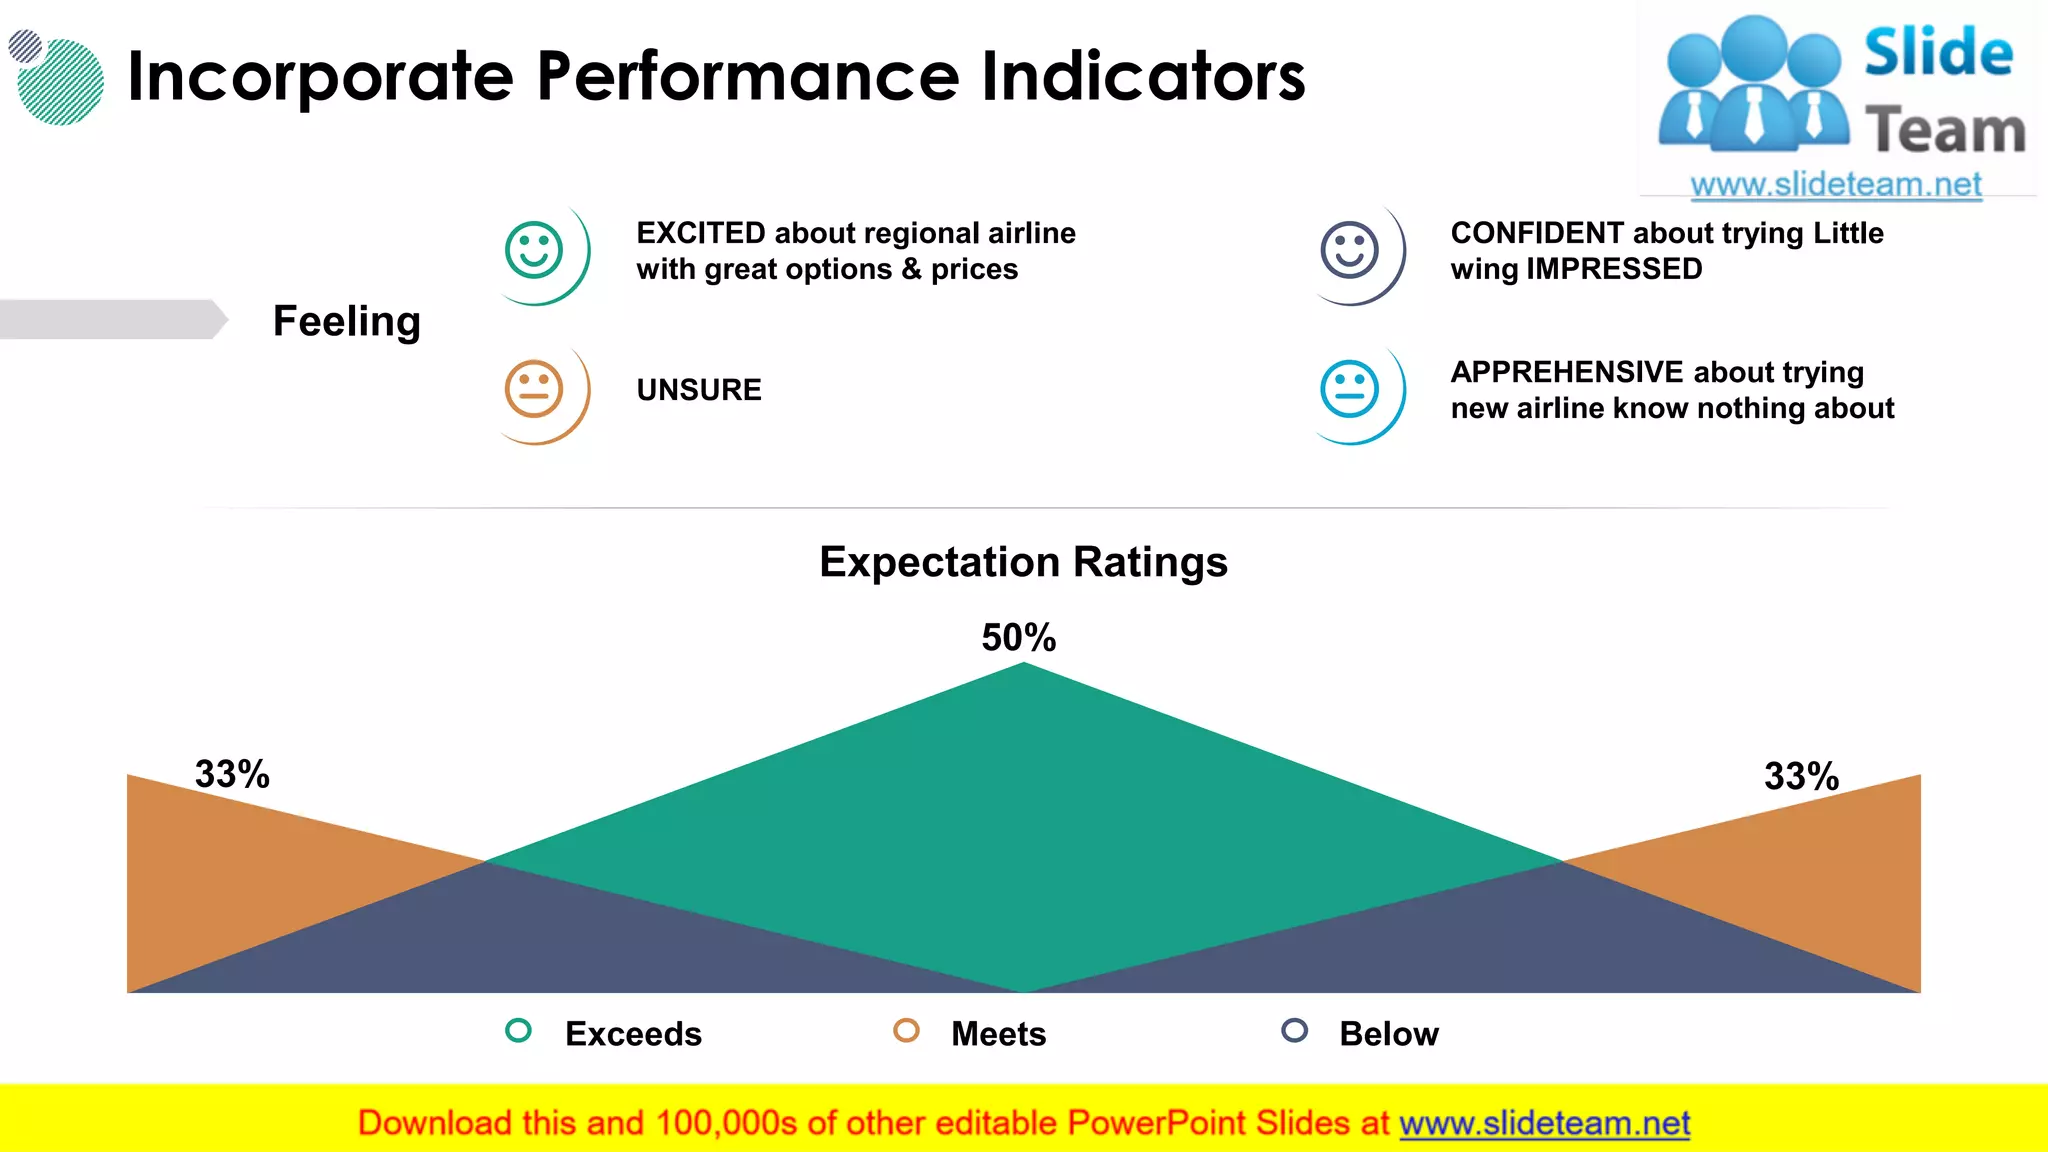
Incorporates performance indicators to evaluate customer experiences and feelings towards services.
Focuses on enhancing stakeholder understanding and engagement using customer journey map narratives.
Illustrates the detailed steps in the customer journey including attracting, serving, and gaining feedback.
Examples depicting customer journey map processes from navigation to resolution.
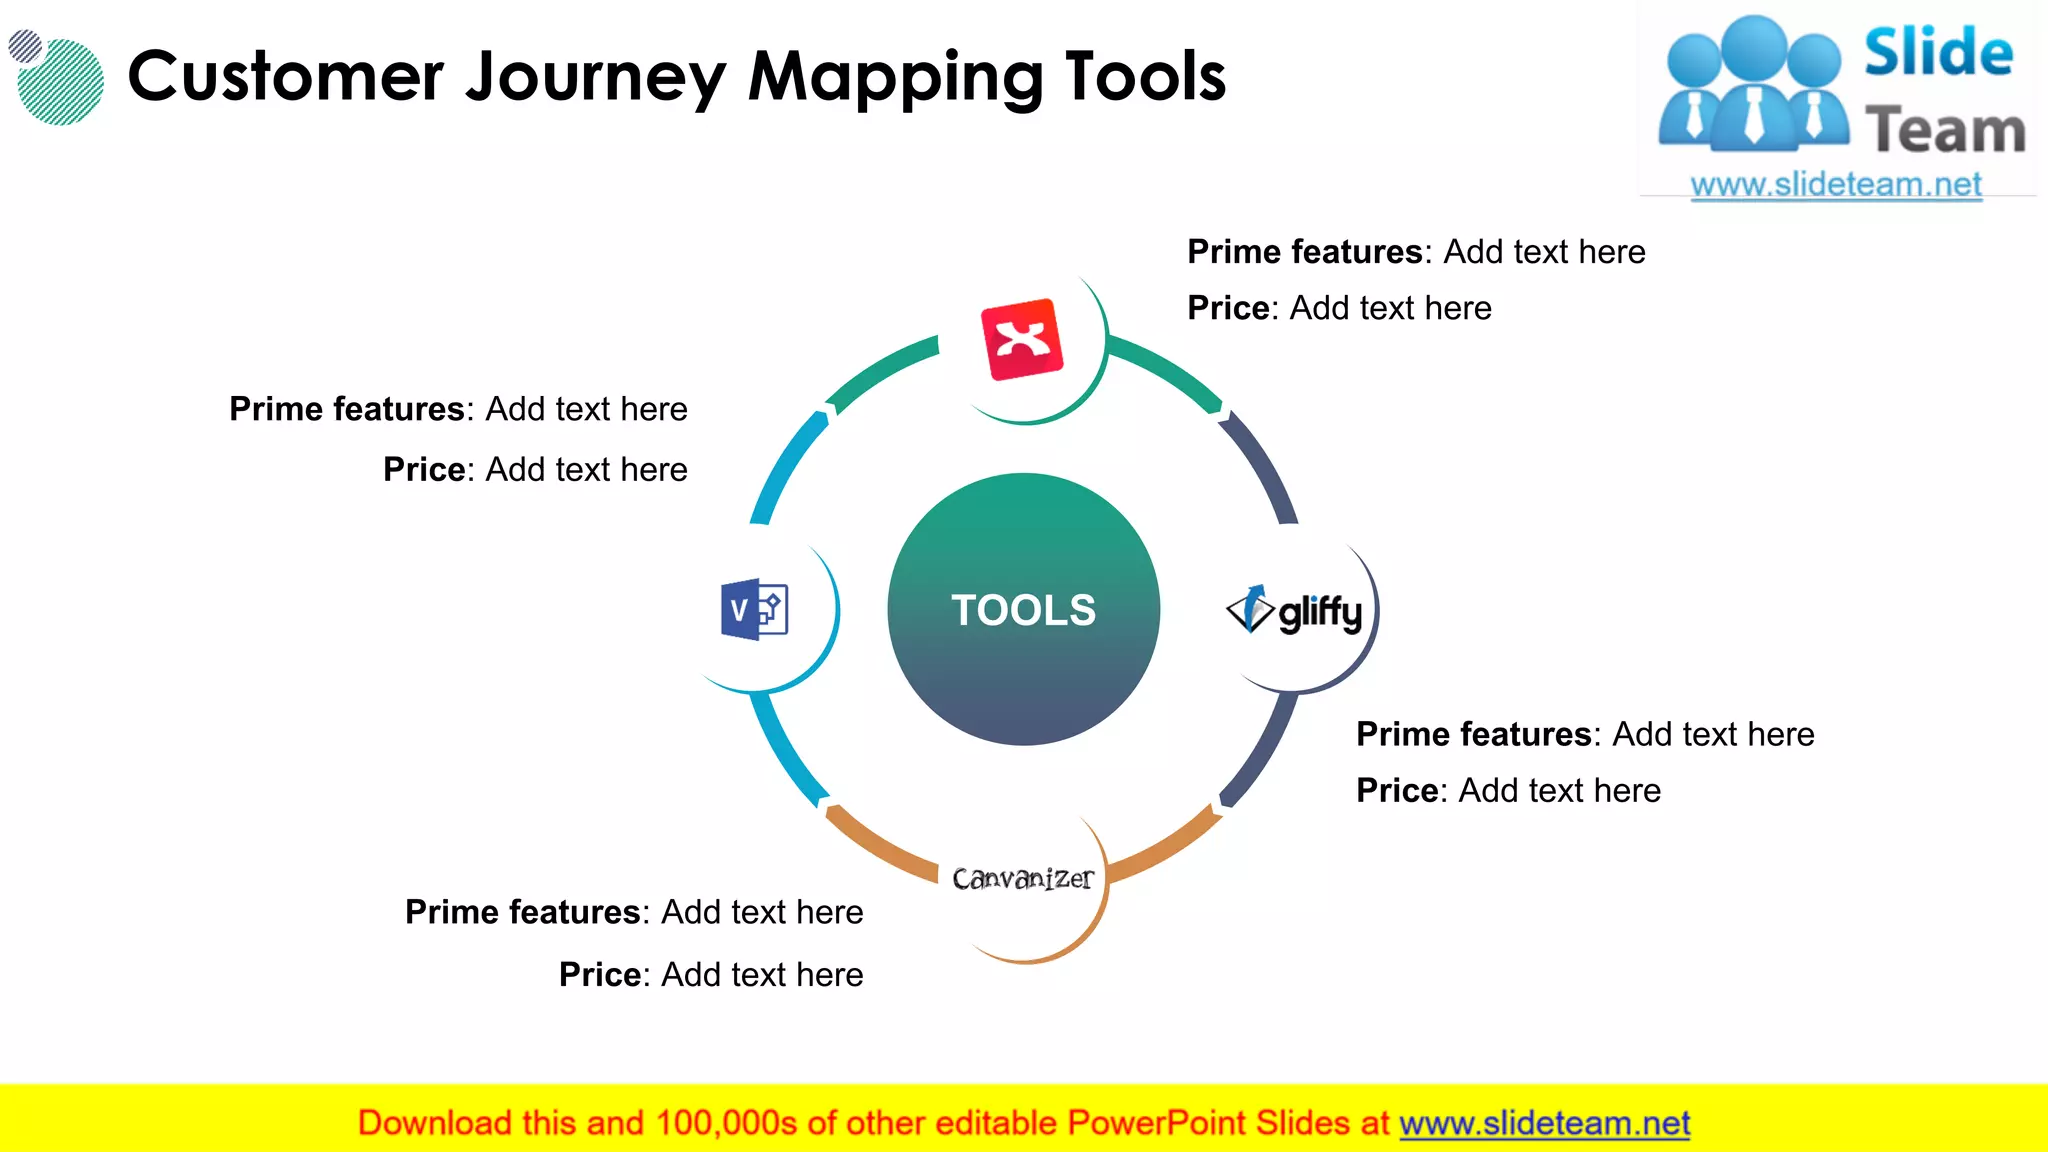
Lists various tools available for creating customer journey maps with a focus on features and pricing.
Discusses customer satisfaction metrics such as average reply time, handle time, and efficiency ratings.
Icons related to the shopper journey analysis presented.
Indicates a break before continuing with the presentation.
Mentions availability of additional slides.
Presentation of a donut pie chart linked to data.
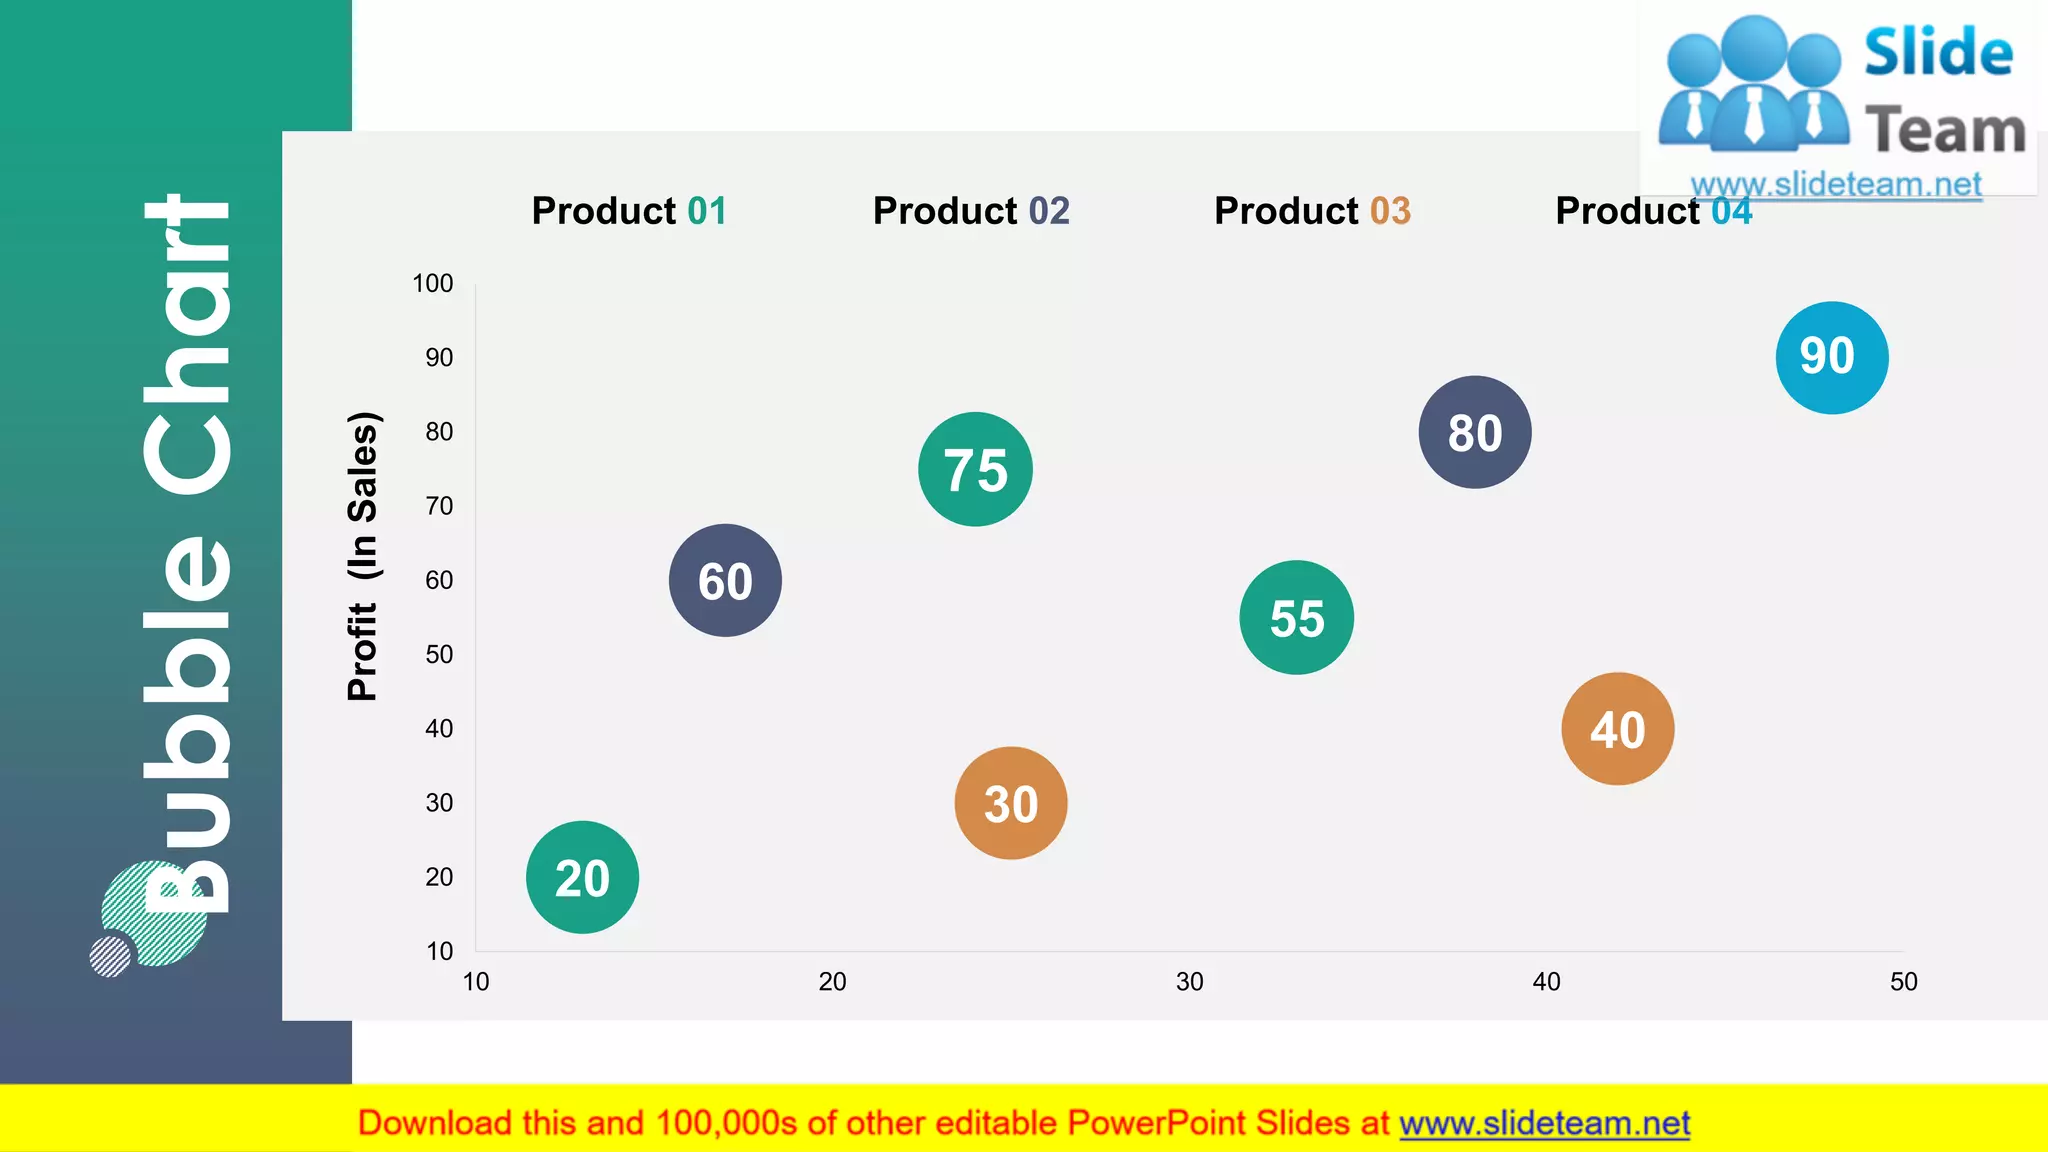
Display of a bubble chart visualizing profit and sales data.
Outlines company mission, vision, and goals.
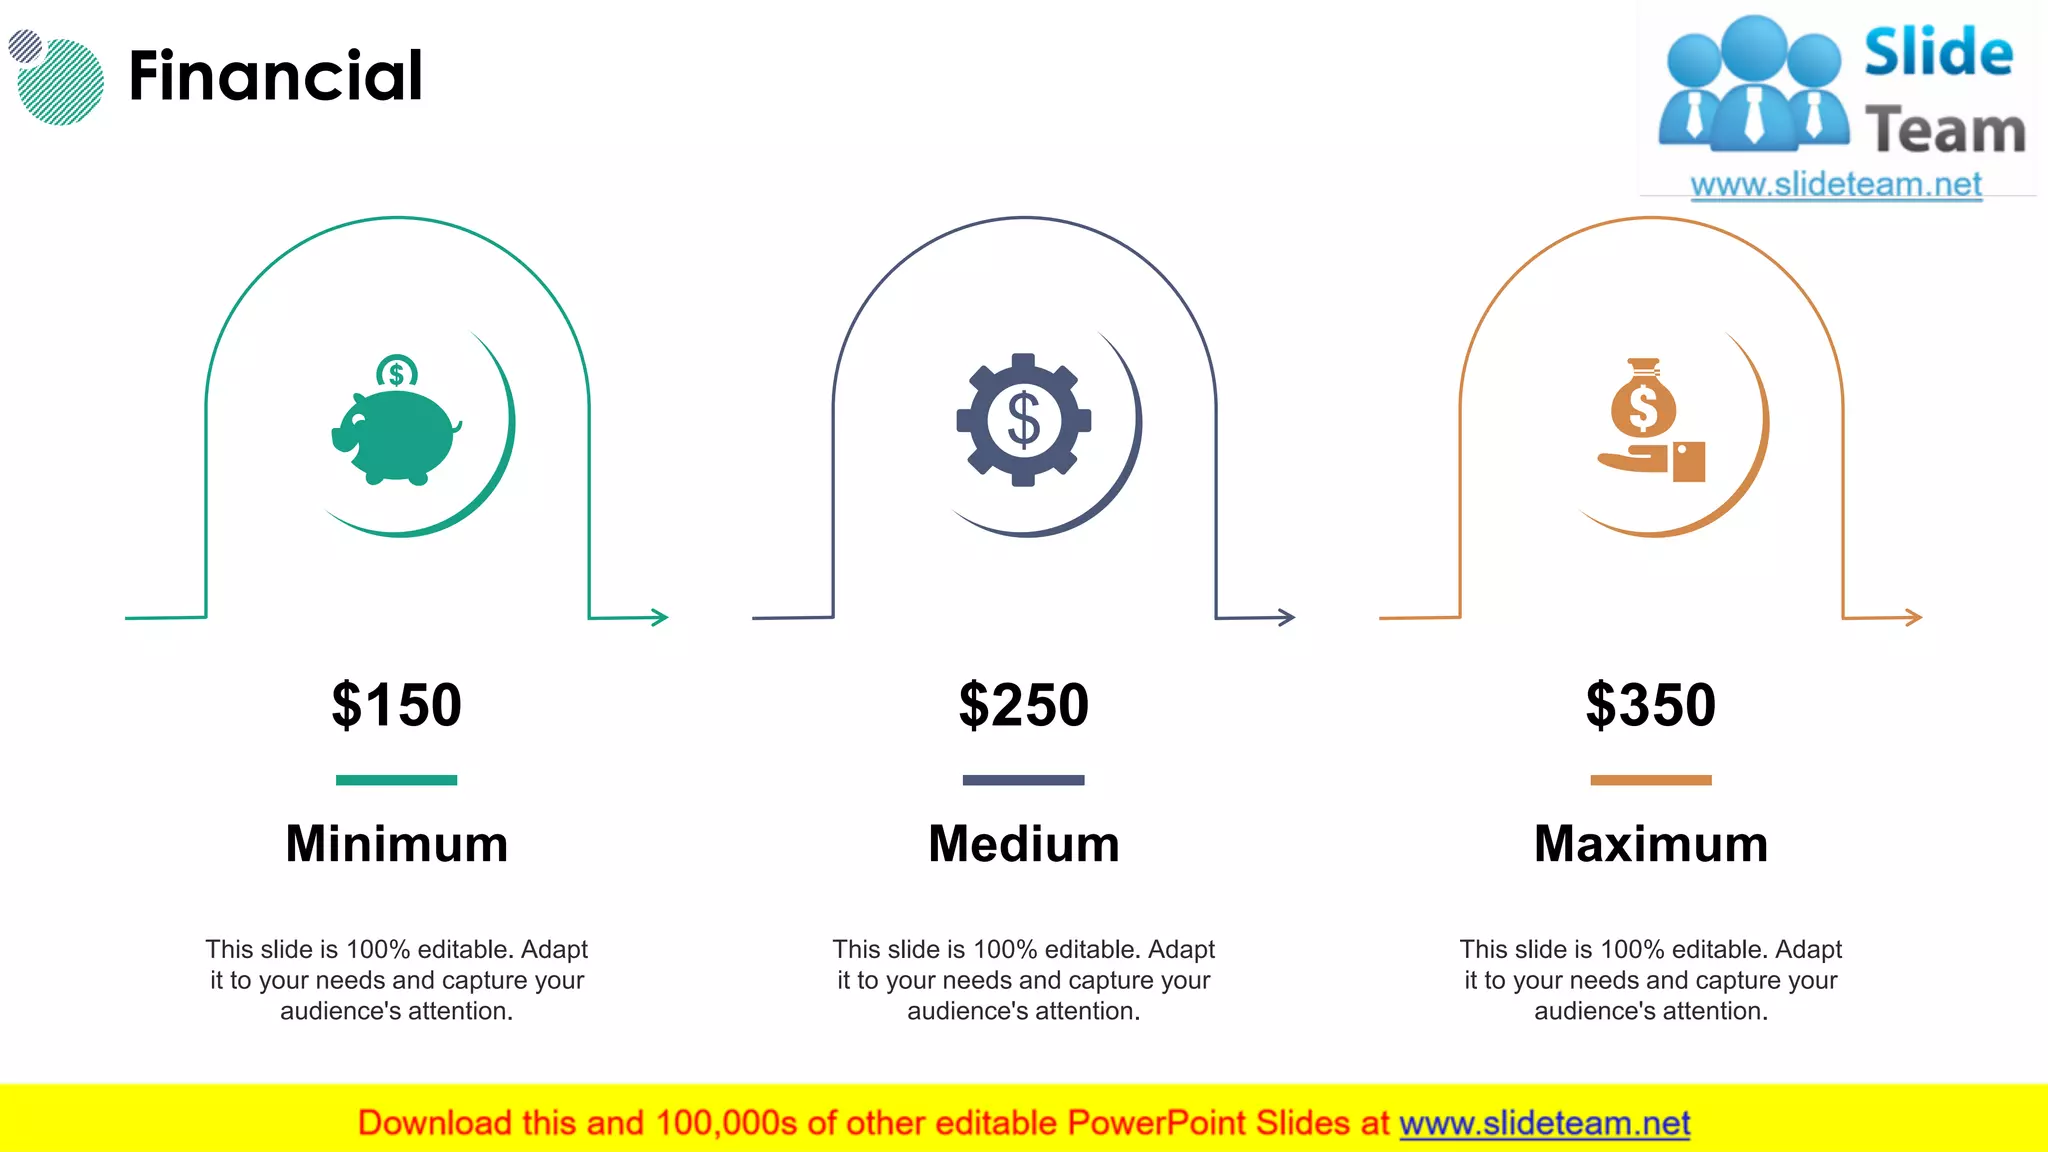
Breakdown of financial metrics including minimum, medium, and maximum values.
Introduction to team members and their designations.
Emphasizes the editability of various presentation components.
A motivational quote by Albert Einstein to resonate with the audience.
Encourages creativity and idea generation among audience members.
Imagery representing focus, clarity, or examination.
Concludes the presentation with gratitude and provides contact information.


![CleanMyMac X v5.2.8 Crack for MacOS Full Version [Latest] pptx](https://cdn.slidesharecdn.com/ss_thumbnails/softwareoverview-251207194121-a81f0142-thumbnail.jpg?width=640&height=640&fit=bounds)
![AnyTrans for iOS 8.9.14.20251127 With Crack for MacOS [Latest] pptx](https://cdn.slidesharecdn.com/ss_thumbnails/softwareoverview-251207190907-2316965f-thumbnail.jpg?width=640&height=640&fit=bounds)

![WinRAR Crack 7.13 Final Mac Keygen 2026 Download [Latest] Software.pptx](https://cdn.slidesharecdn.com/ss_thumbnails/software-251207185858-eb450678-thumbnail.jpg?width=640&height=640&fit=bounds)


![Chapter4_Initiation_of_Sediment_Motion_v2[1].pptx](https://cdn.slidesharecdn.com/ss_thumbnails/chapter4initiationofsedimentmotionv21-251208223747-f94ef163-thumbnail.jpg?width=640&height=640&fit=bounds)

