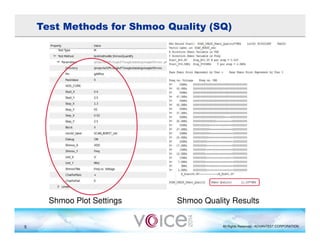
This document discusses quantifying shmoo plot results by defining a metric called Shmoo Quality (SQ). SQ is defined as the area of the pass region in a shmoo plot. Quantifying SQ allows direct comparison of shmoo plots and trend analysis of SQ over time or process variations. An example is given where SQ is calculated for shmoo plots of three golden devices before and after changes, demonstrating up to 163% improved SQ. Quantifying shmoo results provides benefits for product and test engineering.