Download to read offline
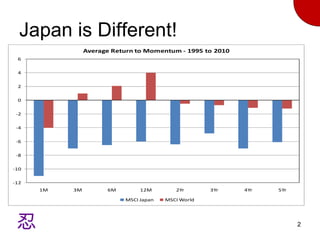
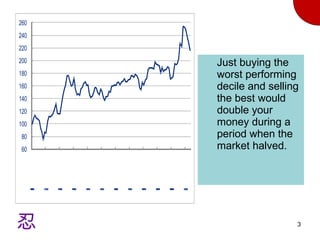
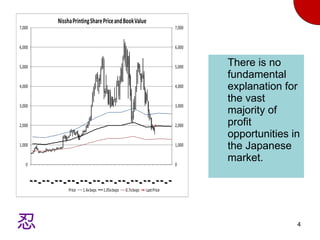
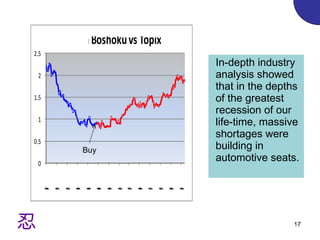
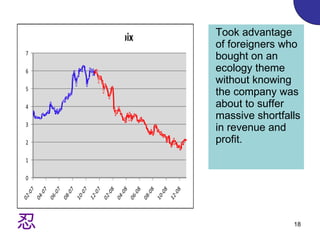
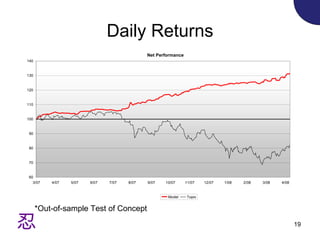
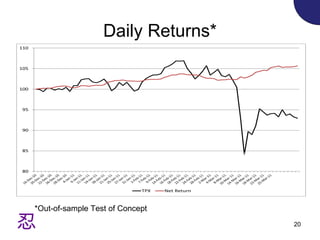

The document discusses an investment strategy for the Japanese equity market called "Guerilla Warfare". Some key points: - Momentum investing in Japan by buying the worst performing stocks and shorting the best could double returns during periods when the overall market was halving. - The strategy focuses on quantitative, technical, and fundamental research to choose stocks rather than relying on a single methodology. - Risk is controlled by limiting position sizes and industry exposures. Real-time attribution is used to analyze returns. - The strategy aims to take advantage of situations where the market misprices stocks by not fully understanding businesses or accounting issues.


