Download to read offline

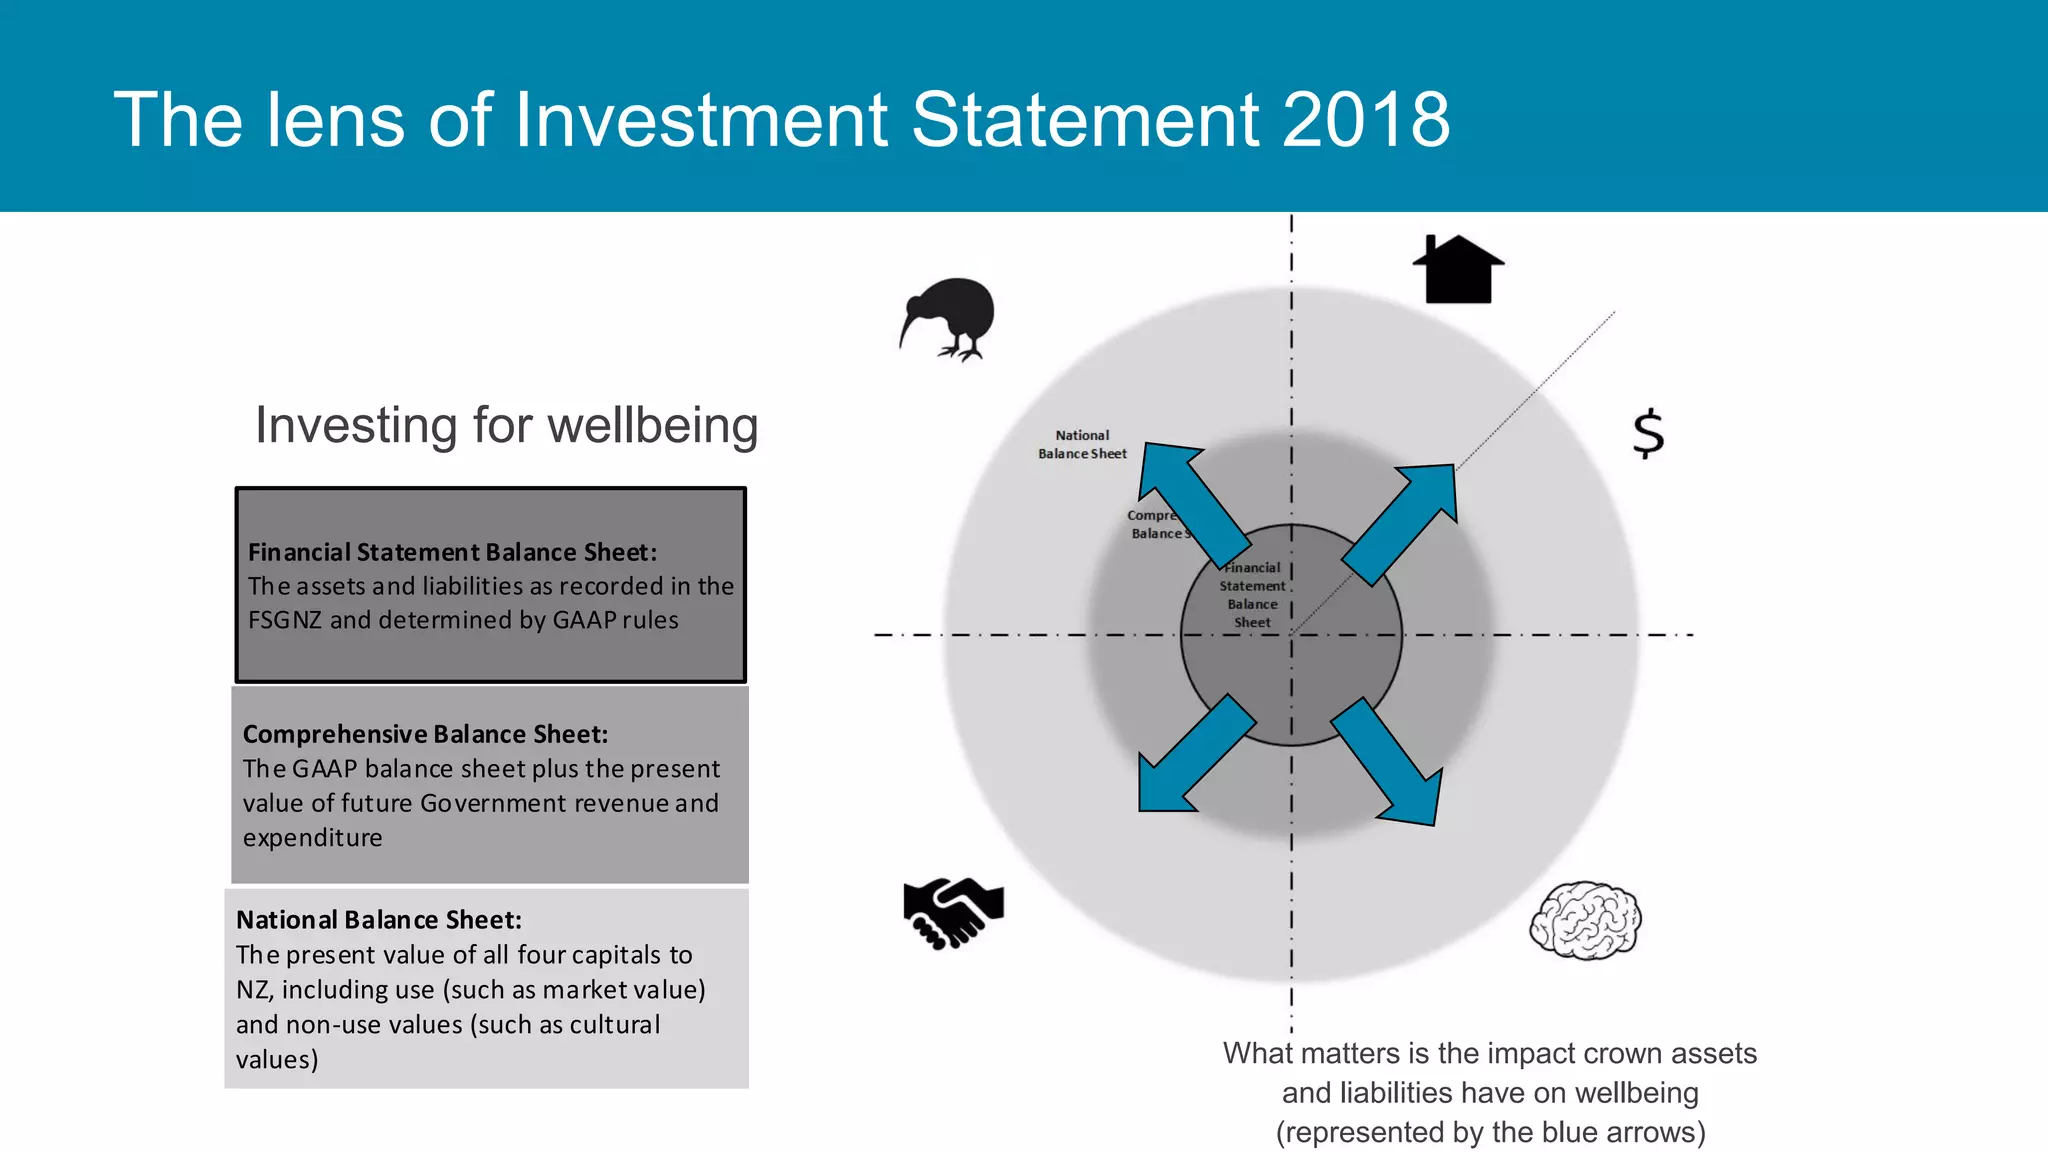
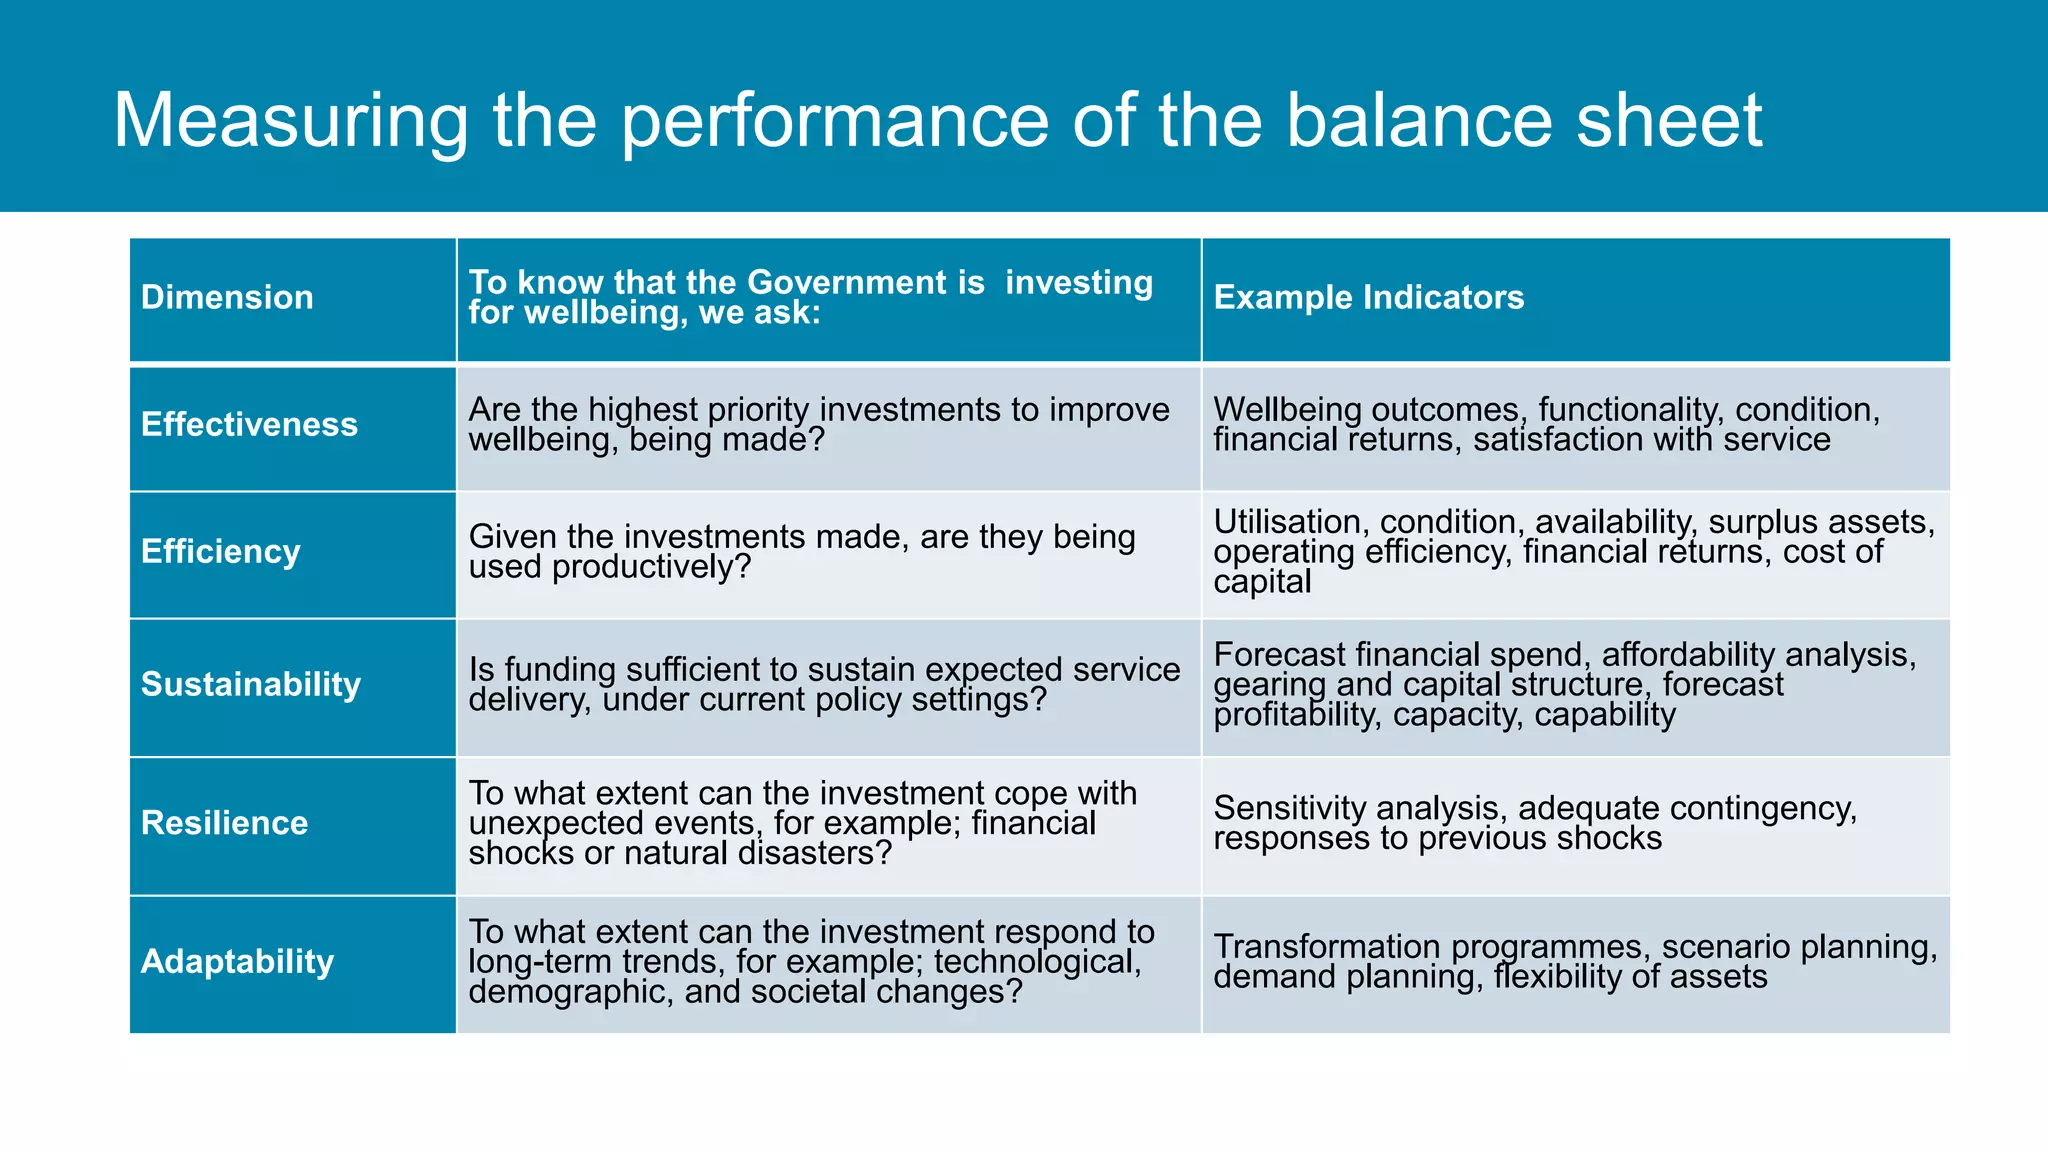


The New Zealand Treasury's investment statement outlines the importance of balance sheet management to enhance living standards for New Zealanders by ensuring transparency over taxpayer investments. It explores the health of four capitals—natural, social, financial, and commercial—in relation to investment effectiveness, efficiency, sustainability, resilience, and adaptability within the justice sector. The document highlights the current challenges, such as rising prison populations and ageing infrastructure, while emphasizing the integration of modern technology and innovative practices to improve overall sector performance.


