Next- generation sequencing (NGS) was performed on 45 serum RNA samples using the Illumina HiScanSQ platform. The goal of this study was to determine serum miRNA profiles for use as novel diagnostic and prognostic biomarkers for the presence of NAFLD, NASH and advanced fibrosis.
Escorts Service Kumaraswamy Layout ☎ 7737669865☎ Book Your One night Stand (B...
Serum microRNA biomarkers for prognosis of nonalcoholic fatty liver disease
1. James E. Nelson1, Ed Sendler2, Stephen A. Krawetz2, Kris V. Kowdley1
1 Liver Center of Excellence, Digestive Disease and Benaroya Research Institutes at Virginia Mason Medical Center, Seattle WA
2 Department of Obstetrics and Gynecology, Center for Molecular Medicine and Genetics, Wayne State University School of Medicine, Detroit, MI.
We have performed RNA-seq on 45 serum RNA samples using the
Illumina HiScanSQ platform. The following comparisons were determined
for serum miRNA levels: A) Healthy non-diabetic persons (n=22) vs
patients with NAFLD (n=23), B) Patients with a definitive NASH diagnosis
(n=12) vs combined healthy non-diabetic persons and NAFLD patients
without a definitive diagnosis of NASH (ie., not NASH or borderline
NASH, n=33), C) Patients with a diagnosis of bridging fibrosis (stage
3;n=7) vs combined healthy, non-diabetic persons, and NAFLD patients
with a fibrosis score of 0-2 (n=38), according to the NASH CRN criteria.
RNA was isolated using the miRNeasy kit (Qiagen). The TruSeq Small
RNA Sample Prep Kit (Illumina) was used for cDNA library construction.
Samples were then pooled and purified using gel electrophoresis based
size-fractionation. Sequence alignment, differential expression (DE)
analysis and bioinformatics were performed using the Genomatix
Software Suite. Potential biomarker panels for the presence of NAFLD,
NASH and bridging fibrosis were identified among highly DE miRNAs
using logistic regression modeling followed by diagnostic accuracy
testing.
SERUM miRNA BIOMARKERS FOR THE PROGNOSIS
OF NONALCOHOLIC FATTY LIVER DISEASE
NAFLD affects one of every three adults and 10% of children and has
emerged as a major risk factor (independent of obesity) for diabetes and
cardiovascular disease. Reliable and clinically relevant noninvasive
biomarkers are lacking for NAFLD. Serum miRNAs have many requisite
features of noninvasive biomarkers and would allow clinicians to closely
monitor the course of NAFLD progression, through repeated testing,
while alleviating the need for dangerous liver biopsies.
The goal of this study was to determine serum miRNA profiles for use as
novel diagnostic and prognostic biomarkers for the presence of NAFLD,
NASH and advanced fibrosis.
Table 1. Differentially expressed (DE) serum miRNAs
Diagnosis Prevalence
Up
regulated
miRs,
n(%)
Down
regulated
miRs,
n(%)
Log2 fold
change
(range) Adj. P value (range)
NAFLD 50% 43 (34%) 85 (66%) -6.9 to 12.4 0.046 to 7.2e-34
Definitive
NASH 26% 10 (36%) 18 (64%) -5.6 to 5.1 0.048 to 9.4e-5
Bridging
Fibrosis 15% 2 (25%) 6 (75%) -5.5 to 4.2 0.026 to .00026
Table 2. Top 5 pathways regulated by DE miRs in serum of
NAFLD vs healthy subjects
Pathway
DE miRs/total
known miRs in
pathway, (%) P value miRs DE in this study
mTOR 8/16 (50%) 0.002
miR218-1, miR19a, miR221, miR100, miR223,
miR125b1, miR99a, let7a
Interleukin 6 6/12 (50%) 0.003
miR19a, let7a, miR19b1, miR301a, miR155,
miR181a1
NFΚB 12/39 (31%) 0.004
miR218-1, miR125a, miR19a, let7a, let7g,
miR146b, miR221, miR125b, miR155, miR29a,
miR181a, miR181b
JAK/STAT 7/18 (39%) 0.008
miR96, let7a, let7c, miR124-1, miR301a,
miR125b, miR155,
Toll-like
receptor
5/9 (56%) 0.018 let7e, miR223, miR155, miR181a1, miR146b
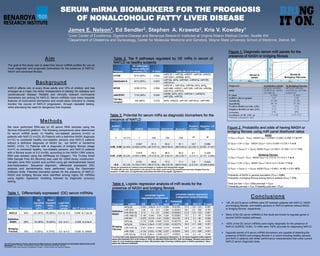
Table 4. Logistic regression analysis of miR levels for the
presence of NASH and bridging fibrosis
univariate logistic
regression (continuous)
univariate logistic regression
(categorical using threshold)
Diagnosis miRNA OR 95% CI
P
value
Reference
value* OR 95% CI P value
Definitive
NASH
let7g-5p 0.003 5.6e-5 – 0.17 0.002 <0.018% 21.0 3.6 – 123 0.001
miR-4530 3.94 1.6 – 10.0 0.004 >0.0034% 58.0 6.0 – 558 <0.001
miR-3614-3p 2.13 1.3 – 3.5 0.003 >0.0024% 21.0 3.6 – 123 0.001
miR-146b-5p 0.146 0.040 – 0.54 0.004 <0.0058% 10.3 2.1 – 49 0.004
miR-941 0.075 0.014 – 0.41 0.003 <0.012% 10.3 2.1 – 49 0.004
Bridging
Fibrosis
let7a-5p 0.133 0.028 – 0.640 0.012 <0.0077% 6.4 1.2 – 34 0.030
let7g-5p 6.8e-4 2.8e-6 – 0.167 0.009 <0.0037% 34.0 4.7 – 248 0.001
miR-3184-3p 0.021 8.5e-4 – 0.534 0.019 <0.049% 34.0 4.7 – 248 0.001
miR-1246 0.134 0.022 – 0.799 0.027 <0.005% 34.0 4.7 – 248 0.001
miR-423-5p 0.018 6.9e-4 – 0.495 0.017 <0.065% 13.8 2.3. – 81 0.004
*% of the total reads detected; binary classification for categorical regression; ie., for down regulated miRs subjects
below this threshold (33% of all values or 15/45, for definitive NASH and 20%, 9/45, for bridging fibrosis) were given a
value of 1 and remaining subjects a 0 value. OR predicts odds of having condition given a relative expression value
below the reference threshold.
Probability of NASH in general population (Ppre) = 0.9%
Probability of bridging fibrosis among NAFLD patients (Ppre) = 17%
Odds pre-test = Opre; Odds post-test = Opost
Probability pre-test = Ppre; Probability post-test = Ppost
NASH
1) Opre = Ppre/(1- Ppre): NASH Opre = 0.009/(1-0.009) =0.009 = 1 in 111
2) Opost = LR+ x Opre: NASH Opost = 13.9 x 0.009 = 0.125 = 1 in 8
3) Ppost = Opost/ (1 + Opost): NASH Ppost = 0.125/(1 +0.125) = 0.11= 11%
Bridging Fibrosis
1) Opre = Ppre/(1- Ppre): NASH Opre = 0.17/(1-0.17) =0.2 = 1 in 5
2) Opost = LR+ x Opre: NASH Opost = 32.4 x 0.2 = 6.48 = 7 in 8
3) Ppost = Opost/ (1 + Opost): NASH Ppost = 6.48/(1 +6.48) = 0.87= 87%
Figure 2. Probability and odds of having NASH or
bridging fibrosis using miR panel likelihood ratios
Figure 1. Diagnostic serum miR panels for the
presence of NASH or bridging fibrosis
Table 3. Potential for serum miRs as diagnostic biomarkers for the
presence of NAFLD
AUROC
range No. (%)* AUROC Sensitivity Specificity Accuracy
Positive
LR test
Negative LR
test
1 12 (11) 1 100 100 100 ∞ ∞
0.90 - 0.99 44 (40)
0.947
(0.924-0.970)
91.3
(87.0-91.3)
95.4
(90.9-95.4)
91.1
(88.9-93.3)
18.7
(9.3-20.1)
0.096
(0.091- 0.147)
0.80 - 0.89 29 (26)
0.870
(0.844-0.888)
78.3
(78.3-82.6)
86.4
(81.8-90.91)
84.4
(80.0-86.7)
6.1
(4.3-9.1)
0.239
(0.191- 0.266)
<0.8 20 (18)
0.761
(0.743-0.791)
69.6
(65.2-73.9)
77.3
(68.2-81.8)
71.1
(68.9-75.6)
2.9
(2.2-3.6)
0.444
(0.345-0.464)
Values are presented as numbers and percentages or medians and interquartile ranges
*18 miRs with too few data points in one group or the other could not be log transformed and were dropped from the
analysis; 5 miRs were not significantly associated with NAFLD by logistic regression
This work was funded by a Pioneer Award from the Wilske Center for Translational Research at Virginia Mason Medical Center to JEN
Disclosures: Kris V. Kowdley –Grant/Research Support: BMS, Merck/Schering Plough, Intercept,
Pharmasett, Abbott, Ikaria, Mochida, Zymogenetics, Conatus. All other authors have nothing to disclose.
128, 28 and 8 serum miRNAs were DE between patients with NAFLD, NASH
and bridging fibrosis, and healthy persons or NAFLD patients without NASH
or bridging fibrosis, respectively.
Many of the DE serum miRNAs in this study are known to regulate genes in
several NASH-related pathways.
>50% of the DE serum miRNAs were highly diagnostic for the presence of
NAFLD (AUROC >0.90). 12 miRs were 100% accurate for diagnosing NAFLD.
Separate panels of 5 serum miRNA biomarkers are capable of detecting the
presence of NASH and bridging fibrosis in a cohort including healthy persons
and NAFLD patients with better performance characteristics than other current
NAFLD serum diagnostic tests.