1. The Housing Report
Tucson Metro | May 2016
14
Apr-
14
Apr-
14
May-
14
May-
14
Jun-
14
Jun-
14
Jul-
14
Jul-
14
Aug-
14
Aug-
14
Sep-
14
Sep-
14
Oct-
14
Oct-
14
Nov-
14
Nov-
14
Dec-
14
Dec-
15
Jan-
15
Jan-
15
Feb-
15
Feb-
15
Mar-
15
Mar-
15
Apr-
15
Apr-
15
May-
15
May-
15
Jun-
15
Jun-
15
Jul-
15
Jul-
15
Aug-
15
Aug-
15
Sep-
15
Sep-
15
Oct-
15
Oct-
15
Nov-
15
Nov-
15
Dec-
15
Dec-
16
Jan-
16
Jan-
16
Feb-
16
Feb-
16
Mar-
16
Mar-
16
Apr-
16
Apr-
Properties Under ContractClosed Transactions
Months of InventoryActive Listings
MonthsofInventory
ActiveListings
0
500
1000
1500
2000
2500
0.0
2.0
4.0
6.0
8.0
10.0
12.0
0
1000
2000
3000
4000
5000
6000
7000
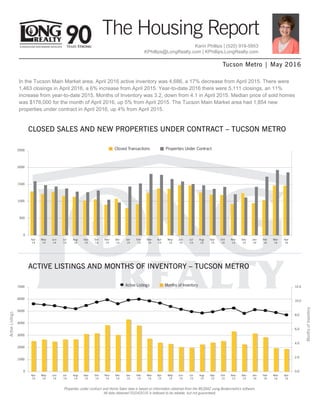
CLOSED SALES AND NEW PROPERTIES UNDER CONTRACT – TUCSON METRO
ACTIVE LISTINGS AND MONTHS OF INVENTORY – TUCSON METRO
Properties under contract and Home Sales data is based on information obtained from the MLSSAZ using Brokermetrics software.
All data obtained 05/04/2016 is believed to be reliable, but not guaranteed.
In the Tucson Main Market area, April 2016 active inventory was 4,686, a 17% decrease from April 2015. There were
1,463 closings in April 2016, a 6% increase from April 2015. Year-to-date 2016 there were 5,111 closings, an 11%
increase from year-to-date 2015. Months of Inventory was 3.2, down from 4.1 in April 2015. Median price of sold homes
was $176,000 for the month of April 2016, up 5% from April 2015. The Tucson Main Market area had 1,854 new
properties under contract in April 2016, up 4% from April 2015.
Karin Phillips | (520) 918-5953
KPhillips@LongRealty.com | KPhillips.LongRealty.com
2. The Housing Report
Tucson Metro | May 2016
DISTRESSED VS. NON-
DISTRESSED SALES –
TUCSON METRO
The percentage of property sales that are
distressed, meaning bank owned or short sales,
for the current year as compared to the same time
period last year. A lower percentage of distressed
sales can lead to improving market conditions.
Distressed sales and market performance data is based on information obtained from the MLSSAZ on 05/04/2016. Information is believed to be reliable, but not guaranteed.
30 YEAR FIXED MORTGAGE RATEMONTHLY PAYMENT ON A
MEDIAN PRICED HOME –
TUCSON METRO
Year Median Price Int. Rate MO. Payment
2006 $217,500 6.140% $1,257.48
2015 $167,325 3.875% $747.48
2016 $176,000 3.625% $762.52
Source: Residential median sales prices. Data obtained 05/04/2016 from MLSSAZ using
Brokermetrics software. Monthly payments based on a 5% down payment on a median
priced home. All data obtained is believed to be reliable, but not guaranteed.
Source: Bankrate.com
05/2011 11/2012 05/2014 10/2015
5.0
4.5
4.0
3.5
3.0
2.5
2.0
MEDIAN SOLD PRICE AND MEDIAN LISTED PRICE – TUCSON
13%
87%
11%
89%
14
Apr-
14
May-
14
Jun-
14
Jul-
14
Aug-
14
Sep-
14
Oct-
14
Nov-
14
Dec- Mar-
1515
Jan-
15
Feb- Apr-
15
May-
15
Jun-
15
Jul-
15
Aug-
15
Sep-
15
Oct-
15
Nov-
15
Dec-
15
Jan-
16
Feb-
16
Mar-
16
Apr-
16
-
50,000
100,000
150,000
200,000
250,000
Median List PriceMedian Sale Price
Karin Phillips | (520) 918-5953
KPhillips@LongRealty.com | KPhillips.LongRealty.com
3. The Housing Report
Tucson Metro | May 2016
Statistics based on information obtained from MLSSAZ and using Brokermetrics software on 05/04/2016.
3 month trend in months of inventory is the average of closed sales and active listing data from 02/01/2016 - 04/30/2016. Information is believed to be reliable, but not guaranteed.
$1 - 49,999
$50,000 - 74,999
$75,000 - 99,999
$100,000 - 124,999
$125,000 - 149,999
$150,000 - 174,999
$175,000 - 199,999
$200,000 - 224,999
$225,000 - 249,999
$250,000 - 274,999
$275,000 - 299,999
$300,000 - 349,999
$350,000 - 399,999
$400,000 - 499,999
$500,000 - 599,999
$600,000 - 699,999
$700,000 - 799,999
$800,000 - 899,999
$900,000 - 999,999
$1,000,000 - and over
TOTAL
87 42 49 37 42 33 39 2.2 2.4 Seller
154 44 52 53 45 69 51 3.0 3.0 Seller
249 88 83 69 61 71 84 3.0 3.5 Seller
243 85 110 116 107 146 134 1.8 2.1 Seller
401 110 181 127 163 214 192 2.1 2.3 Seller
365 125 157 132 154 208 210 1.7 2.1 Seller
409 94 149 100 120 180 167 2.4 2.8 Seller
244 73 91 71 75 120 88 2.8 2.7 Seller
316 47 75 52 74 120 89 3.6 3.4 Seller
238 45 68 39 51 74 78 3.1 3.7 Seller
251 37 50 29 28 46 55 4.6 5.9 Balanced
321 50 64 57 60 75 88 3.6 4.5 Slightly Seller
290 36 56 32 34 52 54 5.4 6.2 Balanced
332 26 46 40 24 43 65 5.1 8.1 Slightly Buyer
245 15 29 26 21 32 26 9.4 9.1 Buyer
131 9 13 9 9 13 17 7.7 10.2 Buyer
93 4 5 6 7 10 5 18.6 12.0 Buyer
79 4 2 4 4 6 2 39.5 20.3 Buyer
57 3 2 3 2 3 8 7.1 12.5 Buyer
181 4 5 8 4 7 11 16.5 24.9 Buyer
4,686 941 1,287 1,010 1,085 1,522 1,463 3.2 3.6 Seller
MARKET CONDITIONS BY PRICE BAND – TUCSON METRO
Active
Listings
Last 6 Months
Closed Sales
Nov-15 Dec-15 Jan-16 Feb-16 Mar-16 Apr-16
Seller’s Market Slight Seller’s Market Balanced Market Slight Buyer’s Market Buyer’s Market
Current
Months of
Inventory
Last 3 Month
Trend Months
of Inventory
Market
Conditions
Karin Phillips | (520) 918-5953
KPhillips@LongRealty.com | KPhillips.LongRealty.com
4. The Housing Report
Tucson Metro | May 2016
The Tucson Metro Housing Report is comprised of data for residential properties in MLSSAZ for the Tucson Metro area. Real Estate
remains very localized and market conditions can vary greatly by not only geographic area but also by price range. Please feel free to
contact me for a more in-depth analysis.
MARKET SHARE –
TUCSON METRO
Long Realty leads the market
in successful real estate sales.
Data Obtained 05/04/2016 from
MLSSAZ using BrokerMetrics software
for all closed residential sales volume
between 05/01/2015 – 04/30/2016
rounded to the nearest tenth of one
percent and deemed to be correct.
85739
8575585658
85742
85653
85743
85745
85713
85701
85719
85716
85705
85741
85704
85737
85718
85712
85750
85749
85715
857488571085711
85730
85707
85747
85706
85756
85714
85746
85757
85735
85614 85622 85629 85641
85708
85706
This heat map represents the
percentage of change in Tucson
metro median sales prices from
February 2015-April 2015 to
February 2016-April 2016 by
zip code.
Percentage of Change
CHANGE IN
MEDIAN SALES
PRICE BY ZIP CODE
FEB 2015-APR 2015 TO
FEB 2016-APR 2016
These statistics are based on information obtained from the MLSSAZ and GVARMLS on 05/04/2016. Information is believed to be reliable, but not guaranteed.
13.5%
9.1%
8.1%
5.9%
3.0%
Long Realty Company
Tierra Antigua Realty
Homesmart Advantage Group
Keller Williams Southern Arizona
Coldwell Banker Residential Brokerage
32.3%
Realty Executives Tucson Elite
Karin Phillips | (520) 918-5953
KPhillips@LongRealty.com | KPhillips.LongRealty.com