- The gold miners index (HUI) and gold mining ETFs (GDX, GDXJ) saw brief rallies but have resumed their downtrend, following a similar pattern from 2013.
- Gold stocks have underperformed gold significantly, which preceded major declines in 2008, 2012, and 2013. This bearish divergence implies further downside for gold stocks.
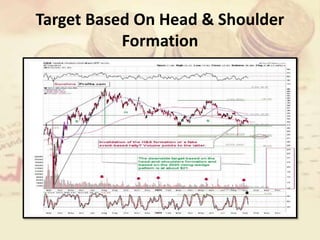
- The HUI completed a head-and-shoulders pattern, and its break below the neckline is a bearish signal consistent with analog years 2000, 2012-2013 where declines followed the "invalidation". This points to gold stocks bottoming near 2020 lows or testing 2016 lows.
- Spikes in trading volume for G