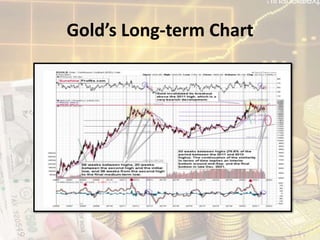
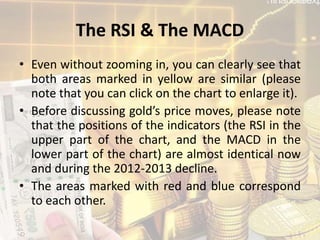
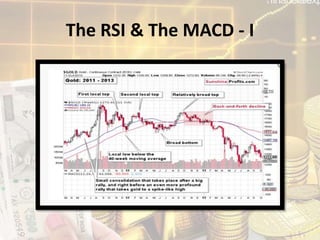
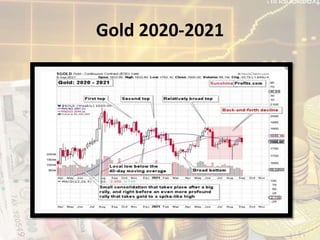
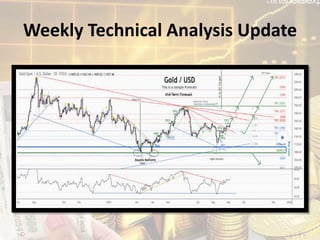
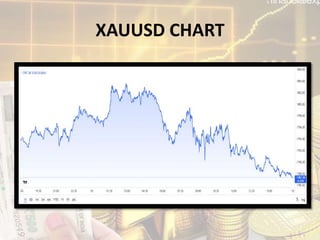
The document discusses gold's price movements in 2013 and draws an analogy to its movements in 2020-2021. It notes that gold's long-term chart and technical indicators like the RSI and MACD are in nearly identical positions now as in 2012-2013, suggesting gold may follow a similar pattern of declines. This includes a small consolidation, rally to a high, then declining in stages until a large drop between April-June 2013. The document argues gold appears primed to experience one more brief correction before truly sliding in price, mirroring its behavior in 2013.