Download to read offline


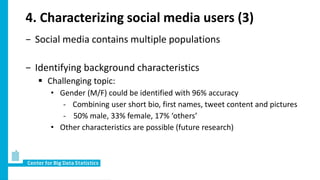
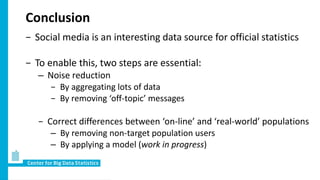

Social media produces vast amounts of user data that could potentially be used for official statistics. However, most individual social media messages are "noisy" and not directly relevant. Researchers at CBS are developing methods to filter relevant messages from different social media platforms about topics like sentiment, social tensions, and migration intentions. They are also working to characterize social media users and account for differences from the general population in order to use these sources to produce new real-time indicators.


