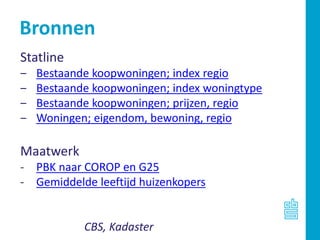
The SlideShare 101 is a quick start guide if you want to walk through the main features that the platform offers. This will keep getting updated as new features are launched.
The SlideShare 101 replaces the earlier "SlideShare Quick Tour".
The SlideShare 101 is a quick start guide if you want to walk through the main features that the platform offers. This will keep getting updated as new features are launched.
The SlideShare 101 replaces the earlier "SlideShare Quick Tour".
1) Plants need sunlight, water, air, and soil to grow. They take in water and nutrients through their roots and transport them throughout the plant.
2) Plants have different parts including flowers, leaves, roots, and stems. They produce fruits and vegetables that humans can eat such as apples, carrots, celery, and lettuce.
3) Plants are living things that grow, reproduce through seeds, and eventually die. Common plants include trees, bushes, and grass.
An immersive workshop at General Assembly, SF. I typically teach this workshop at General Assembly, San Francisco. To see a list of my upcoming classes, visit https://generalassemb.ly/instructors/seth-familian/4813
I also teach this workshop as a private lunch-and-learn or half-day immersive session for corporate clients. To learn more about pricing and availability, please contact me at http://familian1.com
SlideShare now has a player specifically designed for infographics. Upload your infographics now and see them take off! Need advice on creating infographics? This presentation includes tips for producing stand-out infographics. Read more about the new SlideShare infographics player here: http://wp.me/p24NNG-2ay
This infographic was designed by Column Five: http://columnfivemedia.com/
No need to wonder how the best on SlideShare do it. The Masters of SlideShare provides storytelling, design, customization and promotion tips from 13 experts of the form. Learn what it takes to master this type of content marketing yourself.
This document provides tips to avoid common mistakes in PowerPoint presentation design. It identifies the top 5 mistakes as including putting too much information on slides, not using enough visuals, using poor quality or unreadable visuals, having messy slides with poor spacing and alignment, and not properly preparing and practicing the presentation. The document encourages presenters to use fewer words per slide, high quality images and charts, consistent formatting, and to spend significant time crafting an engaging narrative and rehearsing their presentation. It emphasizes that an attractive design is not as important as being an effective storyteller.
10 Ways to Win at SlideShare SEO & Presentation OptimizationOneupweb
Thank you, SlideShare, for teaching us that PowerPoint presentations don't have to be a total bore. But in order to tap SlideShare's 60 million global users, you must optimize. Here are 10 quick tips to make your next presentation highly engaging, shareable and well worth the effort.
For more content marketing tips: http://www.oneupweb.com/blog/
This document provides tips for getting more engagement from content published on SlideShare. It recommends beginning with a clear content marketing strategy that identifies target audiences. Content should be optimized for SlideShare by using compelling visuals, headlines, and calls to action. Analytics and search engine optimization techniques can help increase views and shares. SlideShare features like lead generation and access settings help maximize results.
A Guide to SlideShare Analytics - Excerpts from Hubspot's Step by Step Guide ...SlideShare
This document provides a summary of the analytics available through SlideShare for monitoring the performance of presentations. It outlines the key metrics that can be viewed such as total views, actions, and traffic sources over different time periods. The analytics help users identify topics and presentation styles that resonate best with audiences based on view and engagement numbers. They also allow users to calculate important metrics like view-to-contact conversion rates. Regular review of the analytics insights helps users improve future presentations and marketing strategies.
How to Become a Thought Leader in Your NicheLeslie Samuel
Are bloggers thought leaders? Here are some tips on how you can become one. Provide great value, put awesome content out there on a regular basis, and help others.
Each month, join us as we highlight and discuss hot topics ranging from the future of higher education to wearable technology, best productivity hacks and secrets to hiring top talent. Upload your SlideShares, and share your expertise with the world!
Not sure what to share on SlideShare?
SlideShares that inform, inspire and educate attract the most views. Beyond that, ideas for what you can upload are limitless. We’ve selected a few popular examples to get your creative juices flowing.
How to Make Awesome SlideShares: Tips & TricksSlideShare
Turbocharge your online presence with SlideShare. We provide the best tips and tricks for succeeding on SlideShare. Get ideas for what to upload, tips for designing your deck and more.
SlideShare is a global platform for sharing presentations, infographics, videos and documents. It has over 18 million pieces of professional content uploaded by experts like Eric Schmidt and Guy Kawasaki. The document provides tips for setting up an account on SlideShare, uploading content, optimizing it for searchability, and sharing it on social media to build an audience and reputation as a subject matter expert.
The document discusses two use cases for electricity smart meter data in Estonia. It describes how Statistics Estonia received hourly electricity consumption data from all households with smart meters installed by the electricity grid operator Elering. They used this data to analyze average household electricity consumption patterns and also developed a method to identify vacant dwellings based on abnormal electricity usage patterns. The analysis of smart meter data provided new insights but also challenges regarding linking the meter data to other statistical registers and addressing data quality issues.
This document summarizes a presentation about analyzing and structuring web data to measure the internet economy. It defines the internet economy as online stores, online services, and businesses with websites. Data from 2.5 million Dutch websites was merged with official economic records. Results showed the internet economy accounts for over 1 million businesses and makes up a large portion of the Dutch economy, especially in certain regions. Younger businesses are overrepresented in the internet economy. Future plans include improving methods using machine learning and expanding the study internationally.
The document summarizes a study measuring the size and importance of the internet economy in the Netherlands using big data. The study defines different categories of internet-related businesses and merges the data with official statistics. It finds that 975,000 Dutch businesses have a website, 438,000 are online stores, and 68,000 are online services or internet-related IT companies. The distribution of internet businesses and their contribution varies regionally. The study aims to improve the methods to better measure the growing internet economy over time.
Social media produces vast amounts of user data that could potentially be used for official statistics. However, most individual social media messages are "noisy" and not directly relevant. Researchers at CBS are developing methods to filter relevant messages from different social media platforms about topics like sentiment, social tensions, and migration intentions. They are also working to characterize social media users and account for differences from the general population in order to use these sources to produce new real-time indicators.
The document discusses the importance of basing digital policy on facts. It notes some current issues with insight into the digital economy including limited forecasting ability and difficulties customizing or extrapolating insights. It also outlines some policy challenges around balancing security and privacy with economic growth, and ensuring regulation is future proof and all groups can benefit from digital progress.
Real time position and report data from ships can be used to improve port related decisions. The document discusses using Automatic Identification System (AIS) data and other datasets like port manifests and customs records to analyze areas like port congestion, unloading times, and route management. It provides details on AIS data collection and encoding/decoding messages to represent vessel movements and analyze ship traffic and routes at UK ports as a test case.
This document discusses mobility and transport analytics using big data sources. It describes various data sources like road sensor data, AIS data from ships, camera data, and public transport data that can provide insights. It then outlines how these data are used by different actors like municipalities, provinces, and companies to analyze pollution, risks, infrastructure effectiveness and accessibility. Specific applications mentioned include using sensor and AIS data for traffic and transport monitoring, and analyzing personal mobility patterns and transshipment points using open data. The document concludes noting the potential of big data to simulate and measure mobility and transport at a detailed temporal and regional level.
The document discusses using big data and new technologies to improve transport planning and operations. It provides examples of collecting lifelogging data through wearable sensors to analyze travel behavior, crowdsourced bicyclist data to evaluate infrastructure investments, and using various data sources to examine links between transport and labor market outcomes. The document emphasizes that transport systems need to be re-evaluated in some areas to better match changing job locations and needs of workers.
This document discusses measuring the energy transition through increased use of sensor data. It notes the need for more regional data on renewable energy potential, supply and demand to inform policy. Sensors can provide data on energy consumption, grid demand, solar irradiance and aerial images. This data can help create smarter grids with higher efficiency and stability by better balancing supply and demand. It also discusses how different parties have interests in both short-term balancing and long-term infrastructure planning. The document explores using sensor data like smart meters and satellite imagery to estimate solar power production and monitor the energy transition's effects on areas like CO2 emissions and economic activity.
The Center for Big Data Statistics (CBDS) explores new data sources using state-of-the-art methodology in collaboration with partners to provide timely information on social phenomena. Over the next year, the CBDS will focus on developing products related to health, the labor market, energy transition, mobility, safety, housing, and economic indicators while ensuring ethical data access and privacy. The CBDS will also conduct research, provide training, and share results and experiences with partners.
This document discusses how data from new sources is fueling the datafication of society and how official statistics are adapting to incorporate these new data sources. It notes that a city of 1 million people will generate over 200 million gigabytes of data per day by 2020, with much of it coming from smart buildings, factories, vehicles and other IoT devices. It then outlines three ways official statistics are beginning to use new data sources: 1) basing statistics directly on new sources like social media and sensor data, 2) using new sources to improve existing statistics, and 3) answering more complex policy questions by leveraging large, diverse new data sources.
This document discusses smart farming and precision dairy farming using sensor data. It describes a project called Smart Dairy Farming 1 that aims to support dairy farmers in caring for individual cows using sensor data to improve health and productivity. An "InfoBroker" concept is introduced as an open platform where sensor and other data from different sources can be shared anonymously between data producers and consumers like farmers, advisors and the government. Examples of sensor data collected from Dutch dairy farms are provided. The document emphasizes starting small with pilots and experiments while thinking big about how sensor data could improve agriculture statistics and analytics over time through multi-stakeholder collaboration.
34. Bronnen
Statline
‒ Bestaande koopwoningen; index regio
‒ Bestaande koopwoningen; index woningtype
‒ Bestaande koopwoningen; prijzen, regio
‒ Woningen; eigendom, bewoning, regio
Maatwerk
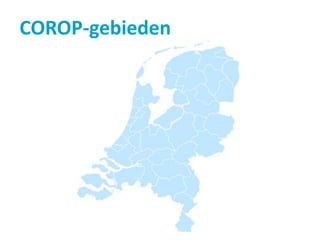
- PBK naar COROP en G25
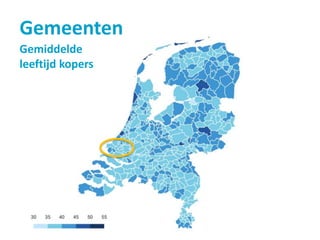
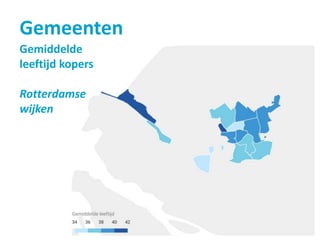
- Gemiddelde leeftijd huizenkopers
CBS, Kadaster
35. Farley Ishaak
ff.ishaak@cbs.nl
070 – 337 5426
Contact:
Het CBS beschikt over een schat aan statistische gegevens, die
gratis beschikbaar zijn op www.cbs.nl en StatLine.
Maar soms is dit niet genoeg.
In dat geval kun je het CBS inschakelen via
woningmarktsymposium@cbs.nl
Editor's Notes
CBS is bereikbaar voor verschillende doelgroepen. Alle contactinformatie is via de website van CBS te vinden.