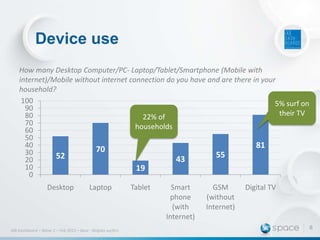
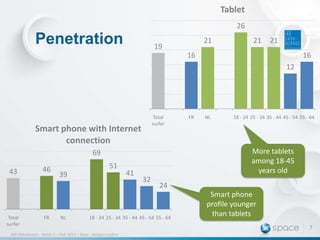
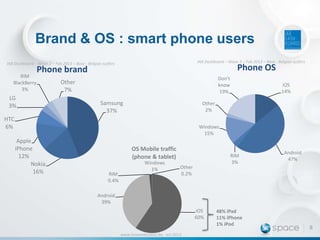
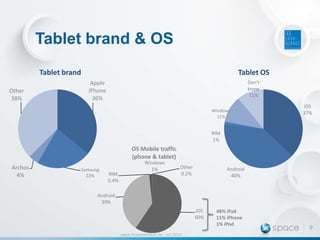
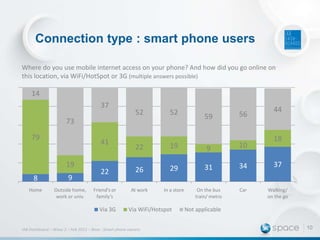
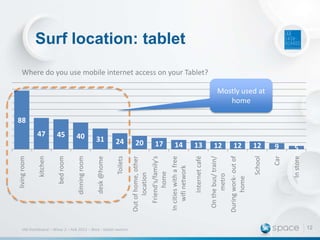
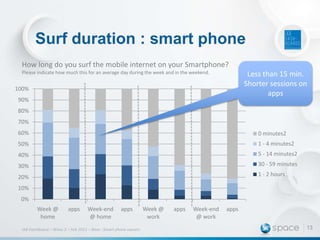
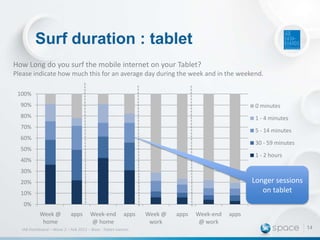
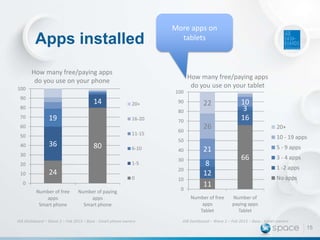
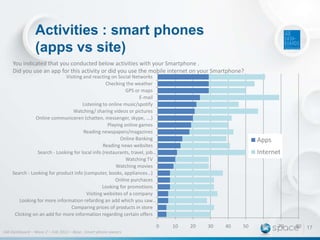
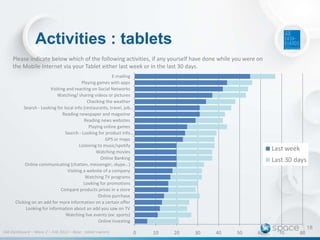
This document summarizes survey results on consumer digital device and internet usage in Belgium in 2013. The surveys found that 81% of households have desktop computers, 70% have laptops, 55% have smartphones, and 43% have tablets. Tablet ownership was highest among ages 18-45, while smartphone ownership was younger. Android was the most popular smartphone and tablet operating system. WiFi was more commonly used than 3G for smartphone internet access. Tablets saw most use at home, while smartphone use was more varied. Smartphone sessions tended to be shorter than tablet sessions. More apps were installed on tablets than smartphones. Both devices were commonly used for social media, maps, email, videos and music.
5. Methodology
•
•
•
•
1049 online questionnaires
Representative of Belgian surfers
Feb 2013
Institute : Nielsen
• Completed questionnaire
•
•
•
•
•
Equipment (incl. mobile & digital TV)
Frequency & duration (incl. mobile & dig TV)
Location (incl. mobile)
Activities & app use (incl. QR Code)
Cookies & privacy
5
6. Device use
How many Desktop Computer/PC- Laptop/Tablet/Smartphone (Mobile with
internet)/Mobile without internet connection do you have and are there in your
household?
100
5% surf on
90
their TV
80
22% of
70
households
60
50
40
81
70
30
55
52
43
20
10
19
0
Desktop
Laptop
IAB Dashboard – Wave 2 – Feb 2013 – Base : Belgian surfers
Tablet
Smart
phone
(with
Internet)
GSM
(without
Internet)
Digital TV
6
7. Tablet
26
Penetration
21
19
21
21
16
16
12
Total
surfer
Smart phone with Internet
connection
Total
surfer
46
FR
51
39
NL
41
32
18 - 24 25 - 34 35 - 44 45 - 54 55 - 64
24
18 - 24 25 - 34 35 - 44 45 - 54 55 - 64
IAB Dahsboard – Wave 2 – Feb 2013 – Base : Belgian surfers
NL
More tablets
among 18-45
years old
69
43
FR
Smart phone
profile younger
than tablets
7
8. Brand & OS : smart phone users
IAB Dashboard – Wave 2 – Feb 2013 – Base : Belgian surfers
RIM
BlackBerry
3%
Phone OS
Phone brand
LG
3%
Don't
know
19%
Other
7%
Samsung
37%
iOS
14%
Other
2%
HTC
6%
Windows
15%
Apple
iPhone
12%
Nokia
16%
OS Mobile traffic
(phone & tablet)
RIM
0.4%
Windows
1%
RIM
3%
Other
0.2%
Android
47%
Android
39%
iOS
60%
www.howwebrowse.be, oct 2013
48% iPad
11% iPhone
1% iPod
8
9. Tablet brand & OS
Tablet brand
Other
38%
Tablet OS
Don't
know
11%
Apple
iPhone
36%
Windows
11%
iOS
37%
RIM
1%
OS Mobile traffic
(phone & tablet)
Archos
4%
Samsung
22%
RIM
0.4%
Windows
1%
Other
0.2%
Android
40%
Android
39%
iOS
60%
www.howwebrowse.be, oct 2013
48% iPad
11% iPhone
1% iPod
9
10. Connection type : smart phone users
Where do you use mobile internet access on your phone? And how did you go online on
this location, via WiFi/HotSpot or 3G (multiple answers possible)
14
37
52
52
73
79
41
19
8
9
Home
Outside home,
work or univ.
59
56
44
18
22
19
9
10
22
26
29
31
34
37
Friend’s or
family’s
At work
In a store
On the bus
train/ metro
Car
Walking/
on the go
Via 3G
Via WiFi/Hotspot
IAB Dashboard – Wave 2 – Feb 2013 – Base : Smart phone owners
Not applicable
10
11. 40
24
20
17
14
13
12
12
12
9
5
Out of home, other
location
Friend's/family's
home
In cities with a free
wifi network
Internet café
On the bus/ train/
metro
During work- out of
home
School
Car
In store
31
Toilets
desk @home
45
dinning room
47
bed room
kitchen
living room
Surf location: tablet
Where do you use mobile internet access on your Tablet?
Mostly used at
home
88
IAB Dashboard – Wave 2 – Feb 2013 – Base : tablet owners
12
12. Surf duration : smart phone
How long do you surf the mobile internet on your Smartphone?
Please indicate how much this for an average day during the week and in the weekend.
Less than 15 min.
Shorter sessions on
apps
100%
90%
80%
70%
60%
0 minutes2
50%
1 - 4 minutes2
40%
5 - 14 minutes2
30%
30 - 59 minutes
20%
1 - 2 hours
10%
0%
Week @
home
apps
Week-end
@ home
apps
IAB Dashboard – Wave 2 – Feb 2013 – Base : Smart phone owners
Week @
work
apps
Week-end
@ work
apps
13
13. Surf duration : tablet
How Long do you surf the mobile internet on your Tablet?
Please indicate how much this for an average day during the week and in the weekend.
100%
90%
0 minutes
80%
1 - 4 minutes
70%
5 - 14 minutes
60%
30 - 59 minutes
50%
1 - 2 hours
40%
30%
Longer sessions
on tablet
20%
10%
0%
Week @
home
apps
Week-end
@ home
apps
IAB Dashboard – Wave 2 – Feb 2013 – Base : Tablet owners
Week @
work
apps
Week-end
@ work
apps
14
14. Apps installed
More apps on
tablets
How many free/paying apps
do you use on your phone
How many free/paying apps
do you use on your tablet
100
100
90
14
80
70
20+
19
16-20
11-15
50
36
80
6-10
1-5
20
60
40
30
20
24
0
0
Number of free
apps
Smart phone
70
10
3
16
26
20+
10 - 19 apps
50
30
10
22
80
60
40
90
Number of paying
apps
Smart phone
IAB Dashboard – Wave 2 – Feb 2013 – Base : Smart phone owners
10
0
5 - 9 apps
21
8
12
11
Number of free
apps
Tablet
66
3 - 4 apps
1 -2 apps
No apps
Number of
paying apps
Tablet
IAB Dashboard – Wave 2 – Feb 2013 – Base : tablet owners
15
15. Activities : smart phones
(apps vs site)
You indicated that you conducted below activities with your Smartphone .
Did you use an app for this activity or did you use the mobile internet on your Smartphone?
Visiting and reacting on Social Networks
Checking the weather
GPS or maps
E-mail
Listening to online music/spotify
Watching/ sharing videos or pictures
Online communiceren (chatten, messenger, skype, ….)
Playing online games
Reading newspapers/magazines
Online Banking
Reading news websites
Search - Looking for local info (restaurants, travel, job…
Watching TV
Watching movies
Search - Looking for product info (computer, books, appliances…)
Online purchaces
Looking for promotions
Visiting websites of a company
Looking for more information refarding an add which you saw…
Comparing prices of products in store
Clicking on an add for more information regarding certain offers
0
IAB Dashboard – Wave 2 – Feb 2013 – Base : Smart phone owners
Apps
Internet
10
20
30
40
50
60
70
80 17
16. Activities : tablets
Please indicate below which of the following activities, if any yourself have done while you were on
the Mobile Internet via your Tablet either last week or in the last 30 days.
E-mailing
Playing games with apps
Visiting and reacting on Social Networks
Watching/ sharing videos or pictures
Checking the weather
Search - Looking for local info (restaurants, travel, job…
Reading newspaper and magazine
Reading news websites
Playing online games
Search - Looking for product info…
GPS or maps
Listening to music/spotify
Watching movies
Online Banking
Online communicating (chatten, messenger, skype…)
Visiting a website of a company
Watching TV programs
Looking for promotions
Compare products prices in a store
Online purchase
Clicking on an add for more information on a certain offer
Looking for information about an add you saw on TV
Watching live events (ex: sports)
Online investing
IAB Dashboard – Wave 2 – Feb 2013 – Base : tablet owners
0
Last week
Last 30 days
10
20
30
40
50
60
70
80
18