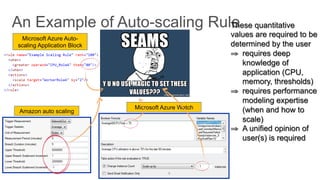
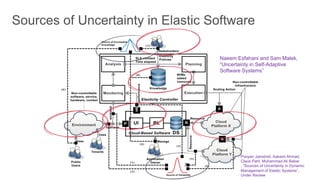
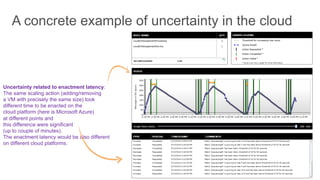
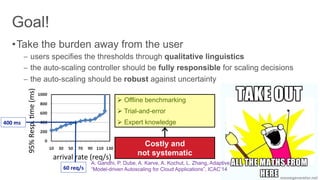
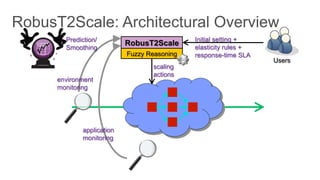
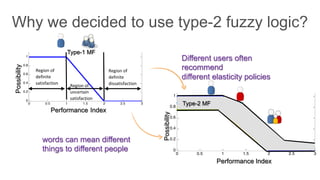
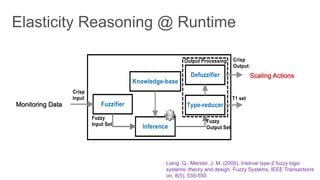
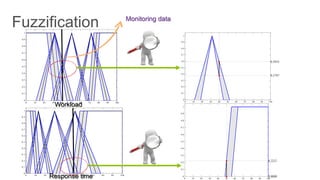
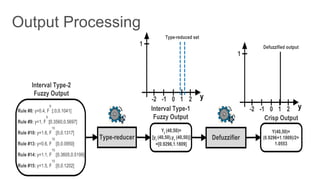
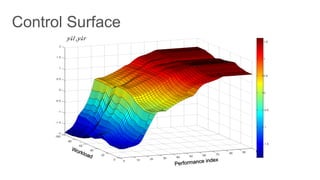
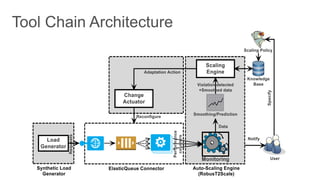
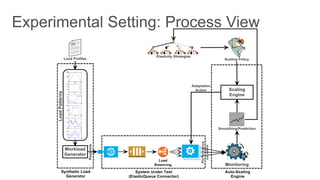
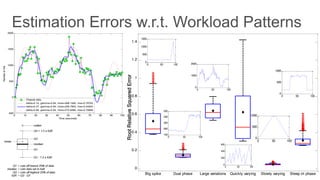
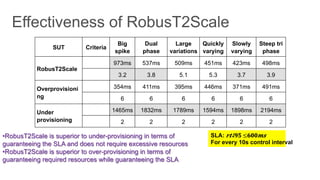
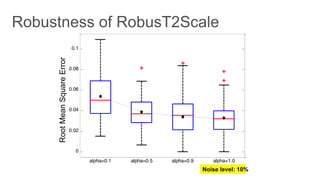
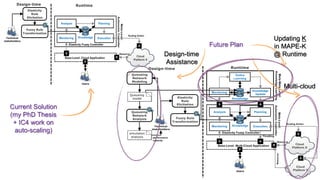
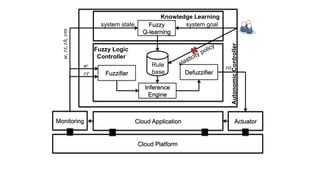
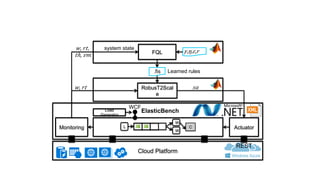
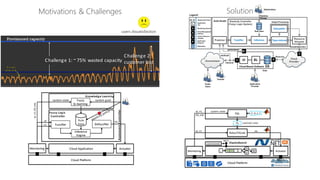
Self-Learning Cloud Controllers
Pooyan Jamshidi, Amir Sharifloo, Claus Pahl,
Andreas Metzger, Giovani Estrada
IC4, Dublin City University, Ireland
University of Duisburg-Essen, Germany
Intel, Ireland
pooyan.jamshidi@computing.dcu.ie
Invited presentation at
UFC, Brazil, Fortaleza
~50% = wasted hardware
Actual
traffic
Typical weekly traffic to Web-based applications (e.g., Amazon.com)
Problem 1: ~75% wasted capacity
Actual
demand
Problem 2:
customer lost
Traffic in an unexpected burst in requests (e.g. end of year
traffic to Amazon.com)
Really like this??
Auto-scaling enables you to realize this ideal on-demand provisioning
Time	
  
Demand	
  
?	
  
Enacting change in the
Cloud resources are not
real-time
Capacity we can provision
with Auto-Scaling
A realistic figure of dynamic provisioning
0 50 100
0
500
1000
1500
0 50 100
100
200
300
400
500
0 50 100
0
1000
2000
0 50 100
0
200
400
600
These quantitative
values are required to be
determined by the user
⇒  requires deep
knowledge of
application (CPU,
memory, thresholds)
⇒  requires performance
modeling expertise
(when and how to
scale)
⇒  A unified opinion of
user(s) is required
Amazon auto scaling
Microsoft Azure Watch
9	
  
Microsoft Azure Auto-
scaling Application Block
Naeem Esfahani and Sam Malek,
“Uncertainty in Self-Adaptive
Software Systems”
Pooyan Jamshidi, Aakash Ahmad,
Claus Pahl, Muhammad Ali Babar
, “Sources of Uncertainty in Dynamic
Management of Elastic Systems”,
Under Review
Uncertainty related to enactment latency:
The same scaling action (adding/removing
a VM with precisely the same size) took
different time to be enacted on the
cloud platform (here is Microsoft Azure)
at different points and
this difference were significant
(up to couple of minutes).
The enactment latency would be also different
on different cloud platforms.
Ø Offline benchmarking
Ø Trial-and-error
Ø Expert knowledge
Costly and
not systematic
A. Gandhi, P. Dube, A. Karve, A. Kochut, L. Zhang, Adaptive,
“Model-driven Autoscaling for Cloud Applications”, ICAC’14
arrival	
  rate	
  (req/s)	
  
95%	
  Resp.	
  :me	
  (ms)	
  
400	
  ms	
  	
  
60	
  req/s	
  
RobusT2Scale
Initial setting +
elasticity rules +
response-time SLA
environment
monitoring
application
monitoring
scaling
actions
Fuzzy Reasoning
Users
Prediction/
Smoothing
  	
   	
  0 0.5 1 1.5 2 2.5 3
0
0.2
0.4
0.6
0.8
1
1.2
1.4
1.6
1.8
2
Region	
  of	
  
definite	
  
satisfaction	
  
Region	
  of	
  
definite	
  
dissatisfaction	
  Region	
  of	
  
uncertain	
  
satisfaction	
  
Performance Index
Possibility
Performance Index
Possibility
words can mean different
things to different people
Different users often
recommend
different elasticity policies
0 0.5 1 1.5 2 2.5 3
0
0.2
0.4
0.6
0.8
1
1.2
1.4
1.6
1.8
2
Type-2 MF
Type-1 MF
Workload
Response time
0 10 20 30 40 50 60 70 80 90 100
0
0.1
0.2
0.3
0.4
0.5
0.6
0.7
0.8
0.9
1
x2
uMembershipgrade
0 10 20 30 40 50 60 70 80 90 100
0
0.1
0.2
0.3
0.4
0.5
0.6
0.7
0.8
0.9
1
uMembershipgrade
=>
=>
UMF
LMF
Embedded
FOU
mean
sd
Rule	
  
(𝒍)	
  
Antecedents	
   Consequent	
  
𝒄 𝒂𝒗𝒈
𝒍 	
  
Workload	
  
Response-­‐
time	
  
Normal	
  
(-­‐2)	
  
Effort	
  
(-­‐1)	
  
Medium	
  
Effort	
  
(0)	
  
High	
  
Effort	
  
(+1)	
  
Maximum	
  
Effort	
  (+2)	
  
1	
   Very	
  low	
   Instantaneous	
   7	
   2	
   1	
   0	
   0	
   -­‐1.6	
  
2	
   Very	
  low	
   Fast	
   5	
   4	
   1	
   0	
   0	
   -­‐1.4	
  
3	
   Very	
  low	
   Medium	
   0	
   2	
   6	
   2	
   0	
   0	
  
4	
   Very	
  low	
   Slow	
   0	
   0	
   4	
   6	
   0	
   0.6	
  
5	
   Very	
  low	
   Very	
  slow	
   0	
   0	
   0	
   6	
   4	
   1.4	
  
6	
   Low	
   Instantaneous	
   5	
   3	
   2	
   0	
   0	
   -­‐1.3	
  
7	
   Low	
   Fast	
   2	
   7	
   1	
   0	
   0	
   -­‐1.1	
  
8	
   Low	
   Medium	
   0	
   1	
   5	
   3	
   1	
   0.4	
  
9	
   Low	
   Slow	
   0	
   0	
   1	
   8	
   1	
   1	
  
10	
   Low	
   Very	
  slow	
   0	
   0	
   0	
   4	
   6	
   1.6	
  
11	
   Medium	
   Instantaneous	
   6	
   4	
   0	
   0	
   0	
   -­‐1.6	
  
12	
   Medium	
   Fast	
   2	
   5	
   3	
   0	
   0	
   -­‐0.9	
  
13	
   Medium	
   Medium	
   0	
   0	
   5	
   4	
   1	
   0.6	
  
14	
   Medium	
   Slow	
   0	
   0	
   1	
   7	
   2	
   1.1	
  
15	
   Medium	
   Very	
  slow	
   0	
   0	
   1	
   3	
   6	
   1.5	
  
16	
   High	
   Instantaneous	
   8	
   2	
   0	
   0	
   0	
   -­‐1.8	
  
17	
   High	
   Fast	
   4	
   6	
   0	
   0	
   0	
   -­‐1.4	
  
18	
   High	
   Medium	
   0	
   1	
   5	
   3	
   1	
   0.4	
  
19	
   High	
   Slow	
   0	
   0	
   1	
   7	
   2	
   1.1	
  
20	
   High	
   Very	
  slow	
   0	
   0	
   0	
   6	
   4	
   1.4	
  
21	
   Very	
  high	
   Instantaneous	
   9	
   1	
   0	
   0	
   0	
   -­‐1.9	
  
22	
   Very	
  high	
   Fast	
   3	
   6	
   1	
   0	
   0	
   -­‐1.2	
  
23	
   Very	
  high	
   Medium	
   0	
   1	
   4	
   4	
   1	
   0.5	
  
24	
   Very	
  high	
   Slow	
   0	
   0	
   1	
   8	
   1	
   1	
  
25	
   Very	
  high	
   Very	
  slow	
   0	
   0	
   0	
   4	
   6	
   1.6	
  
Rule
()	
  
Antecedents	
   Consequent	
  
Work
load	
  
Respons
e
-time	
  
-2	
   -1	
   0 +1	
   +2	
  
12	
   Medium	
   Fast	
   2	
   5	
   3 0	
   0	
   -0.9	
  
10 experts’ responses
​ 𝑅↑𝑙 : IF (the workload (​ 𝑥↓1 ) is ​​ 𝐹 ↓​ 𝑖↓1  , AND the response-
time (​ 𝑥↓2 ) is ​​ 𝐺 ↓​ 𝑖↓2  ), THEN (add/remove ​ 𝑐↓𝑎𝑣𝑔↑𝑙 
instances).
​ 𝑐↓𝑎𝑣𝑔↑𝑙 =​∑ 𝑢=1↑​ 𝑁↓𝑙 ▒​ 𝑤↓𝑢↑𝑙 × 𝐶 /∑𝑢=1↑​ 𝑁↓
Goal: pre-computations of costly calculations to
make a runtime efficient elasticity reasoning based on
fuzzy inference
Liang, Q., Mendel, J. M. (2000). Interval type-2 fuzzy logic
systems: theory and design. Fuzzy Systems, IEEE Transactions
on, 8(5), 535-550.
Scaling Actions
Monitoring Data
0 10 20 30 40 50 60 70 80 90 100
0
0.1
0.2
0.3
0.4
0.5
0.6
0.7
0.8
0.9
1
0.5954
0.3797
𝑀
0 10 20 30 40 50 60 70 80 90 100
0
0.1
0.2
0.3
0.4
0.5
0.6
0.7
0.8
0.9
1
0.2212
0.0000
0 10 20 30 40 50 60 70 80 90 100
0
0.1
0.2
0.3
0.4
0.5
0.6
0.7
0.8
0.9
1
x2
u
0 10 20 30 40 50 60 70 80 90 100
0
0.1
0.2
0.3
0.4
0.5
0.6
0.7
0.8
0.9
1
u Monitoring data
Workload
Response time
0 10 20 30 40 50 60 70 80 90 100
0
0.1
0.2
0.3
0.4
0.5
0.6
0.7
0.8
0.9
1
0.5954
0.3797
0 10 20 30 40 50 60 70 80 90 100
0
0.1
0.2
0.3
0.4
0.5
0.6
0.7
0.8
0.9
1
0.9568
0.9377
Performance index
​ 𝑦↓𝑙 ,​ 𝑦↓𝑟 
0 50 100
0
500
1000
1500
0 50 100
100
200
300
400
500
0 50 100
0
1000
2000
0 50 100
0
200
400
600
0 50 100
0
500
1000
0 50 100
0
500
1000
0 10 20 30 40 50 60 70 80 90 100
-500
0
500
1000
1500
2000
Time (seconds)
Numberofhits
Original data
betta=0.10, gamma=0.94, rmse=308.1565, rrse=0.79703
betta=0.27, gamma=0.94, rmse=209.7852, rrse=0.54504
betta=0.80, gamma=0.94, rmse=272.6285, rrse=0.70858
0
0.2
0.4
0.6
0.8
1
1.2
1.4
Big spike Dual phase Large variations Quickly varying Slowly varying Steep tri phase
0 50 100
0
500
1000
1500
0 50 100
100
200
300
400
500
0 50 100
0
1000
2000
0 50 100
0
200
400
600
0 50 100
0
500
1000
0 50 100
0
500
1000
RootRelativeSquaredError
SUT Criteria
Big
spike
Dual
phase
Large
variations
Quickly
varying
Slowly
varying
Steep tri
phase
RobusT2Scale
973ms 537ms 509ms 451ms 423ms 498ms
3.2 3.8 5.1 5.3 3.7 3.9
Overprovisioni
ng
354ms 411ms 395ms 446ms 371ms 491ms
6 6 6 6 6 6
Under
provisioning
1465ms 1832ms 1789ms 1594ms 1898ms 2194ms
2 2 2 2 2 2
SLA: ​ 𝒓 𝒕↓ 𝟗𝟓 ≤𝟔𝟎𝟎 𝒎𝒔
For every 10s control interval
• RobusT2Scale is superior to under-provisioning in terms of
guaranteeing the SLA and does not require excessive resources
• RobusT2Scale is superior to over-provisioning in terms of
guaranteeing required resources while guaranteeing the SLA
0
0.02
0.04
0.06
0.08
0.1
alpha=0.1 alpha=0.5 alpha=0.9 alpha=1.0
RootMeanSquareError
Noise level: 10%
Self-Learning Controller
Current Solution
(my PhD Thesis
+ IC4 work on
auto-scaling)
Future Plan
Updating K
in MAPE-K
@ RuntimeDesign-time
Assistance
Multi-cloud
Fuzzifier
Inference
Engine
Defuzzifier
Rule
base
Fuzzy
Q-learning
Cloud ApplicationMonitoring Actuator
Cloud Platform
Fuzzy Logic
Controller
Knowledge Learning
AutonomicController
𝑟𝑡
𝑤𝑤,  𝑟𝑡,  𝑡ℎ,  𝑣𝑚 𝑠𝑎
system state system goal
RobusT2Scal
e
Learned rules
FQL
Monitoring Actuator
Cloud Platform
.fis
L
W
W
ElasticBench
𝑤,   𝑟𝑡
𝑤,   𝑟𝑡,  
   𝑡ℎ,   𝑣𝑚
𝑠𝑎
Load
Generator
C
system state
WCF
REST
𝛾, 𝜂, 𝜀, 𝑟
Cloud Platform (PaaS)On-Premise
P:
Worker
Role
L: Web
Role
P:
Worker
Role
P:
Worker
Role
Cache
M:
Worker
Role
Results
:
Storag
e
Blackboard
: Storage
LG:
Console
Auto-scaling
Logic (controller)
Policy Enforcer
1112
10
LB:
Load
Balance
r
Queue
Actuator
Monitoring
0
0.2
0.4
0.6
0.8
1
1.2
0
4
12
15
21
26
33
39
47
53
60
68
76
83
90
95
103
110
118
124
130
136
145
152
159
166
171
179
185
193
200
206
214
218
219
228
236
242
249
255
263
267
271
275
283
290
295
303
307
314
320
S1 S2 S3 S4 S5
0
0.5
1
1.5
2
2.5
0 50 100 150 200 250 300 350
q(9,5)
0
0.02
0.04
0.06
0.08
0.1
0.12
0.14
0.16
0.18
0.2
0 50 100 150 200 250 300 350
q(7,5)
-0.4
-0.2
0
0.2
0.4
0.6
0.8
1
1.2
0 50 100 150 200 250 300 350
q(9,3)
-0.2
-0.1
0
0.1
0.2
0.3
0.4
0.5
0 50 100 150 200 250 300 350
q(3,3)
0
1
2
3
4
5
6
7
8
0 1000 2000 3000 4000 5000 6000 7000 8000 9000 10000
1
2
3
4
Challenge	
  1:	
  ~75%	
  wasted	
  capacity
A c t u a l  
d e m a n d
Challenge	
  2:	
  
customer	
  lost
Fuzzifier
Inference	
  
Engine
Defuzzifier
Rule	
  
base
Fuzzy
Q-­‐learning
Cloud	
  ApplicationMonitoring Actuator
Cloud	
  Platform
Fuzzy	
  Logic	
  
Controller
Knowledge	
  Learning
Autonomic	
  Controller
𝑟𝑡
𝑤
𝑤,𝑟𝑡,𝑡ℎ,𝑣𝑚
𝑠𝑎
system	
  state system	
  goal
RobusT2Scale
Learned	
  rules
FQL
Monitoring Actuator
Cloud	
  Platform
.fis
L
W
W
ElasticBench
𝑤, 𝑟𝑡
𝑤, 𝑟𝑡,  
  𝑡ℎ, 𝑣𝑚
𝑠𝑎
Load	
  Generator
C
system	
  state
WCF
REST
𝛾, 𝜂, 𝜀, 𝑟
http://computing.dcu.ie/~pjamshidi/PDF/SEAMS2014.pdf
More
Details?
=>
http://www.slideshare.net/pooyanjamshidi/
Slides?
=>
Thank you!
Aakash AhmadClaus Pahl Soodeh Farokhi Amir Sharifloo Armin Balalaie
https://github.com/pooyanjamshidi
Code?
=>
Hamed Jamshidi
Nabor Mendonca
Brian CarrollReza Teimourzadegan

Self learning cloud controllers

  • 1.
    Self-Learning Cloud Controllers PooyanJamshidi, Amir Sharifloo, Claus Pahl, Andreas Metzger, Giovani Estrada IC4, Dublin City University, Ireland University of Duisburg-Essen, Germany Intel, Ireland pooyan.jamshidi@computing.dcu.ie Invited presentation at UFC, Brazil, Fortaleza
  • 2.
    ~50% = wastedhardware Actual traffic Typical weekly traffic to Web-based applications (e.g., Amazon.com)
  • 3.
    Problem 1: ~75%wasted capacity Actual demand Problem 2: customer lost Traffic in an unexpected burst in requests (e.g. end of year traffic to Amazon.com)
  • 4.
    Really like this?? Auto-scalingenables you to realize this ideal on-demand provisioning Time   Demand   ?   Enacting change in the Cloud resources are not real-time
  • 5.
    Capacity we canprovision with Auto-Scaling A realistic figure of dynamic provisioning
  • 7.
    0 50 100 0 500 1000 1500 050 100 100 200 300 400 500 0 50 100 0 1000 2000 0 50 100 0 200 400 600
  • 9.
    These quantitative values arerequired to be determined by the user ⇒  requires deep knowledge of application (CPU, memory, thresholds) ⇒  requires performance modeling expertise (when and how to scale) ⇒  A unified opinion of user(s) is required Amazon auto scaling Microsoft Azure Watch 9   Microsoft Azure Auto- scaling Application Block
  • 11.
    Naeem Esfahani andSam Malek, “Uncertainty in Self-Adaptive Software Systems” Pooyan Jamshidi, Aakash Ahmad, Claus Pahl, Muhammad Ali Babar , “Sources of Uncertainty in Dynamic Management of Elastic Systems”, Under Review
  • 12.
    Uncertainty related toenactment latency: The same scaling action (adding/removing a VM with precisely the same size) took different time to be enacted on the cloud platform (here is Microsoft Azure) at different points and this difference were significant (up to couple of minutes). The enactment latency would be also different on different cloud platforms.
  • 13.
    Ø Offline benchmarking Ø Trial-and-error Ø Expert knowledge Costlyand not systematic A. Gandhi, P. Dube, A. Karve, A. Kochut, L. Zhang, Adaptive, “Model-driven Autoscaling for Cloud Applications”, ICAC’14 arrival  rate  (req/s)   95%  Resp.  :me  (ms)   400  ms     60  req/s  
  • 14.
    RobusT2Scale Initial setting + elasticityrules + response-time SLA environment monitoring application monitoring scaling actions Fuzzy Reasoning Users Prediction/ Smoothing
  • 16.
         0 0.5 1 1.5 2 2.5 3 0 0.2 0.4 0.6 0.8 1 1.2 1.4 1.6 1.8 2 Region  of   definite   satisfaction   Region  of   definite   dissatisfaction  Region  of   uncertain   satisfaction   Performance Index Possibility Performance Index Possibility words can mean different things to different people Different users often recommend different elasticity policies 0 0.5 1 1.5 2 2.5 3 0 0.2 0.4 0.6 0.8 1 1.2 1.4 1.6 1.8 2 Type-2 MF Type-1 MF
  • 18.
    Workload Response time 0 1020 30 40 50 60 70 80 90 100 0 0.1 0.2 0.3 0.4 0.5 0.6 0.7 0.8 0.9 1 x2 uMembershipgrade 0 10 20 30 40 50 60 70 80 90 100 0 0.1 0.2 0.3 0.4 0.5 0.6 0.7 0.8 0.9 1 uMembershipgrade => => UMF LMF Embedded FOU mean sd
  • 19.
    Rule   (𝒍)   Antecedents   Consequent   𝒄 𝒂𝒗𝒈 𝒍   Workload   Response-­‐ time   Normal   (-­‐2)   Effort   (-­‐1)   Medium   Effort   (0)   High   Effort   (+1)   Maximum   Effort  (+2)   1   Very  low   Instantaneous   7   2   1   0   0   -­‐1.6   2   Very  low   Fast   5   4   1   0   0   -­‐1.4   3   Very  low   Medium   0   2   6   2   0   0   4   Very  low   Slow   0   0   4   6   0   0.6   5   Very  low   Very  slow   0   0   0   6   4   1.4   6   Low   Instantaneous   5   3   2   0   0   -­‐1.3   7   Low   Fast   2   7   1   0   0   -­‐1.1   8   Low   Medium   0   1   5   3   1   0.4   9   Low   Slow   0   0   1   8   1   1   10   Low   Very  slow   0   0   0   4   6   1.6   11   Medium   Instantaneous   6   4   0   0   0   -­‐1.6   12   Medium   Fast   2   5   3   0   0   -­‐0.9   13   Medium   Medium   0   0   5   4   1   0.6   14   Medium   Slow   0   0   1   7   2   1.1   15   Medium   Very  slow   0   0   1   3   6   1.5   16   High   Instantaneous   8   2   0   0   0   -­‐1.8   17   High   Fast   4   6   0   0   0   -­‐1.4   18   High   Medium   0   1   5   3   1   0.4   19   High   Slow   0   0   1   7   2   1.1   20   High   Very  slow   0   0   0   6   4   1.4   21   Very  high   Instantaneous   9   1   0   0   0   -­‐1.9   22   Very  high   Fast   3   6   1   0   0   -­‐1.2   23   Very  high   Medium   0   1   4   4   1   0.5   24   Very  high   Slow   0   0   1   8   1   1   25   Very  high   Very  slow   0   0   0   4   6   1.6   Rule ()   Antecedents   Consequent   Work load   Respons e -time   -2   -1   0 +1   +2   12   Medium   Fast   2   5   3 0   0   -0.9   10 experts’ responses ​ 𝑅↑𝑙 : IF (the workload (​ 𝑥↓1 ) is ​​ 𝐹 ↓​ 𝑖↓1  , AND the response- time (​ 𝑥↓2 ) is ​​ 𝐺 ↓​ 𝑖↓2  ), THEN (add/remove ​ 𝑐↓𝑎𝑣𝑔↑𝑙  instances). ​ 𝑐↓𝑎𝑣𝑔↑𝑙 =​∑ 𝑢=1↑​ 𝑁↓𝑙 ▒​ 𝑤↓𝑢↑𝑙 × 𝐶 /∑𝑢=1↑​ 𝑁↓ Goal: pre-computations of costly calculations to make a runtime efficient elasticity reasoning based on fuzzy inference
  • 20.
    Liang, Q., Mendel,J. M. (2000). Interval type-2 fuzzy logic systems: theory and design. Fuzzy Systems, IEEE Transactions on, 8(5), 535-550. Scaling Actions Monitoring Data
  • 21.
    0 10 2030 40 50 60 70 80 90 100 0 0.1 0.2 0.3 0.4 0.5 0.6 0.7 0.8 0.9 1 0.5954 0.3797 𝑀 0 10 20 30 40 50 60 70 80 90 100 0 0.1 0.2 0.3 0.4 0.5 0.6 0.7 0.8 0.9 1 0.2212 0.0000 0 10 20 30 40 50 60 70 80 90 100 0 0.1 0.2 0.3 0.4 0.5 0.6 0.7 0.8 0.9 1 x2 u 0 10 20 30 40 50 60 70 80 90 100 0 0.1 0.2 0.3 0.4 0.5 0.6 0.7 0.8 0.9 1 u Monitoring data Workload Response time
  • 22.
    0 10 2030 40 50 60 70 80 90 100 0 0.1 0.2 0.3 0.4 0.5 0.6 0.7 0.8 0.9 1 0.5954 0.3797 0 10 20 30 40 50 60 70 80 90 100 0 0.1 0.2 0.3 0.4 0.5 0.6 0.7 0.8 0.9 1 0.9568 0.9377
  • 24.
  • 26.
    0 50 100 0 500 1000 1500 050 100 100 200 300 400 500 0 50 100 0 1000 2000 0 50 100 0 200 400 600 0 50 100 0 500 1000 0 50 100 0 500 1000
  • 27.
    0 10 2030 40 50 60 70 80 90 100 -500 0 500 1000 1500 2000 Time (seconds) Numberofhits Original data betta=0.10, gamma=0.94, rmse=308.1565, rrse=0.79703 betta=0.27, gamma=0.94, rmse=209.7852, rrse=0.54504 betta=0.80, gamma=0.94, rmse=272.6285, rrse=0.70858 0 0.2 0.4 0.6 0.8 1 1.2 1.4 Big spike Dual phase Large variations Quickly varying Slowly varying Steep tri phase 0 50 100 0 500 1000 1500 0 50 100 100 200 300 400 500 0 50 100 0 1000 2000 0 50 100 0 200 400 600 0 50 100 0 500 1000 0 50 100 0 500 1000 RootRelativeSquaredError
  • 28.
    SUT Criteria Big spike Dual phase Large variations Quickly varying Slowly varying Steep tri phase RobusT2Scale 973ms537ms 509ms 451ms 423ms 498ms 3.2 3.8 5.1 5.3 3.7 3.9 Overprovisioni ng 354ms 411ms 395ms 446ms 371ms 491ms 6 6 6 6 6 6 Under provisioning 1465ms 1832ms 1789ms 1594ms 1898ms 2194ms 2 2 2 2 2 2 SLA: ​ 𝒓 𝒕↓ 𝟗𝟓 ≤𝟔𝟎𝟎 𝒎𝒔 For every 10s control interval • RobusT2Scale is superior to under-provisioning in terms of guaranteeing the SLA and does not require excessive resources • RobusT2Scale is superior to over-provisioning in terms of guaranteeing required resources while guaranteeing the SLA
  • 29.
    0 0.02 0.04 0.06 0.08 0.1 alpha=0.1 alpha=0.5 alpha=0.9alpha=1.0 RootMeanSquareError Noise level: 10%
  • 30.
  • 31.
    Current Solution (my PhDThesis + IC4 work on auto-scaling) Future Plan Updating K in MAPE-K @ RuntimeDesign-time Assistance Multi-cloud
  • 32.
    Fuzzifier Inference Engine Defuzzifier Rule base Fuzzy Q-learning Cloud ApplicationMonitoring Actuator CloudPlatform Fuzzy Logic Controller Knowledge Learning AutonomicController 𝑟𝑡 𝑤𝑤,  𝑟𝑡,  𝑡ℎ,  𝑣𝑚 𝑠𝑎 system state system goal
  • 33.
    RobusT2Scal e Learned rules FQL Monitoring Actuator CloudPlatform .fis L W W ElasticBench 𝑤,   𝑟𝑡 𝑤,   𝑟𝑡,     𝑡ℎ,   𝑣𝑚 𝑠𝑎 Load Generator C system state WCF REST 𝛾, 𝜂, 𝜀, 𝑟
  • 34.
    Cloud Platform (PaaS)On-Premise P: Worker Role L:Web Role P: Worker Role P: Worker Role Cache M: Worker Role Results : Storag e Blackboard : Storage LG: Console Auto-scaling Logic (controller) Policy Enforcer 1112 10 LB: Load Balance r Queue Actuator Monitoring
  • 35.
  • 36.
    0 0.5 1 1.5 2 2.5 0 50 100150 200 250 300 350 q(9,5) 0 0.02 0.04 0.06 0.08 0.1 0.12 0.14 0.16 0.18 0.2 0 50 100 150 200 250 300 350 q(7,5) -0.4 -0.2 0 0.2 0.4 0.6 0.8 1 1.2 0 50 100 150 200 250 300 350 q(9,3) -0.2 -0.1 0 0.1 0.2 0.3 0.4 0.5 0 50 100 150 200 250 300 350 q(3,3)
  • 37.
    0 1 2 3 4 5 6 7 8 0 1000 20003000 4000 5000 6000 7000 8000 9000 10000
  • 38.
  • 39.
    Challenge  1:  ~75%  wasted  capacity A c t u a l   d e m a n d Challenge  2:   customer  lost Fuzzifier Inference   Engine Defuzzifier Rule   base Fuzzy Q-­‐learning Cloud  ApplicationMonitoring Actuator Cloud  Platform Fuzzy  Logic   Controller Knowledge  Learning Autonomic  Controller 𝑟𝑡 𝑤 𝑤,𝑟𝑡,𝑡ℎ,𝑣𝑚 𝑠𝑎 system  state system  goal RobusT2Scale Learned  rules FQL Monitoring Actuator Cloud  Platform .fis L W W ElasticBench 𝑤, 𝑟𝑡 𝑤, 𝑟𝑡,    𝑡ℎ, 𝑣𝑚 𝑠𝑎 Load  Generator C system  state WCF REST 𝛾, 𝜂, 𝜀, 𝑟
  • 40.
    http://computing.dcu.ie/~pjamshidi/PDF/SEAMS2014.pdf More Details? => http://www.slideshare.net/pooyanjamshidi/ Slides? => Thank you! Aakash AhmadClausPahl Soodeh Farokhi Amir Sharifloo Armin Balalaie https://github.com/pooyanjamshidi Code? => Hamed Jamshidi Nabor Mendonca Brian CarrollReza Teimourzadegan