

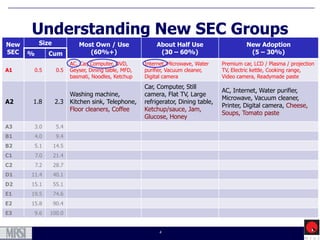
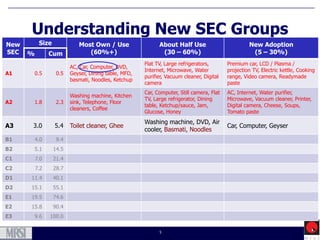
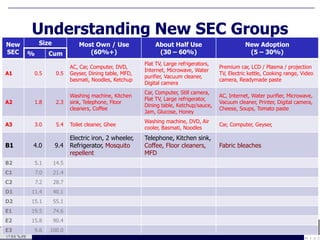
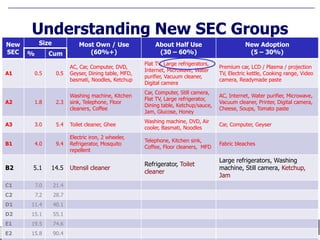
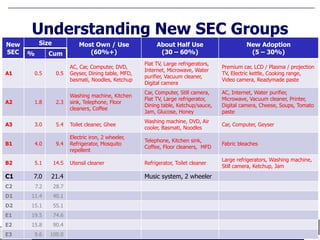
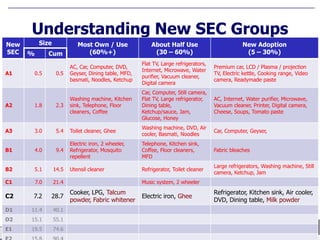
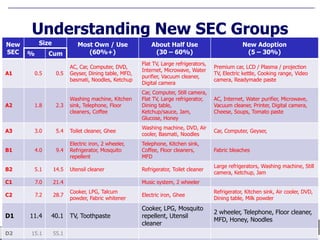
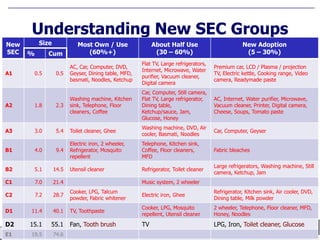
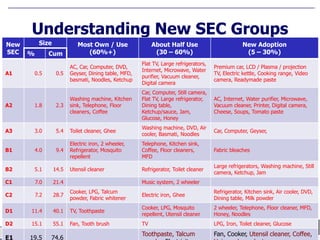
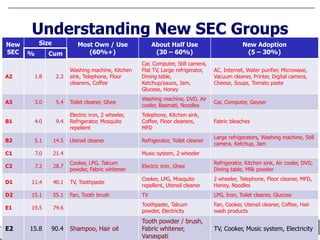
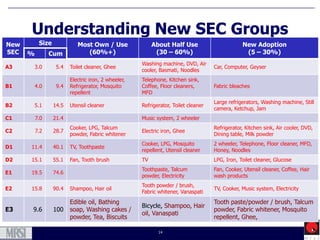

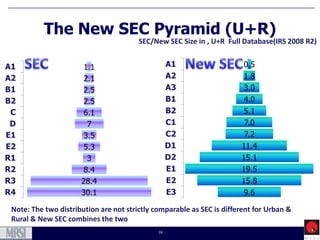
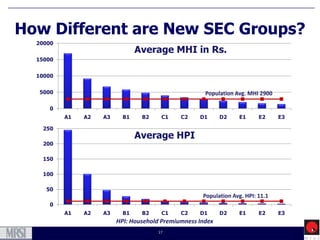
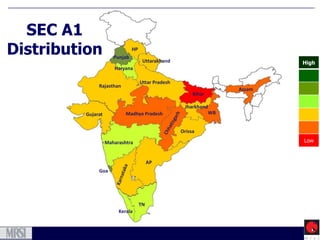
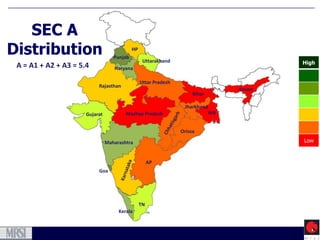
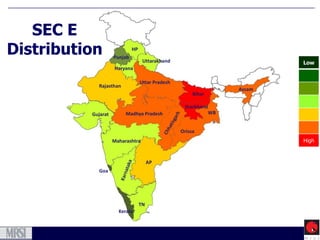
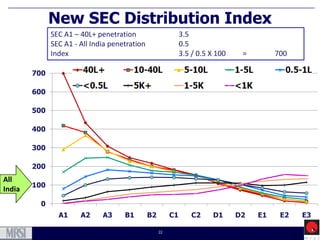


The document outlines consumer goods ownership and usage among different socio-economic classes (SECs) in India. It divides the population into 12 SECs based on size and describes the most commonly owned, commonly used, and newly adopted consumer goods for each SEC. SEC A1 makes up 0.5% of the population and owns appliances like ACs and cars. SECs represent progressively larger portions of the population up to SEC E3, which represents 9.6% of Indians. Higher SECs have higher rates of ownership for newer technologies while lower SECs show increasing adoption of basic appliances. The document provides detailed breakdowns of consumer goods penetration across India's diverse population.

![Mwb contents[1]](https://cdn.slidesharecdn.com/ss_thumbnails/mwbcontents1-110117033509-phpapp01-thumbnail.jpg?width=640&height=640&fit=bounds)


