Download to read offline
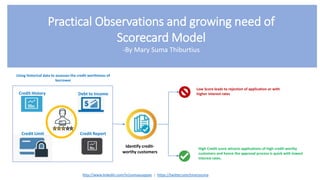
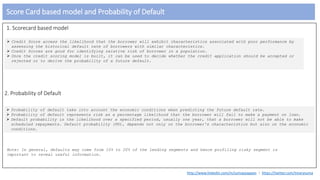
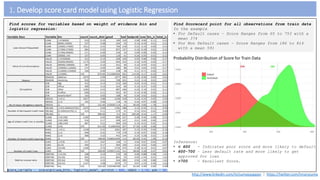
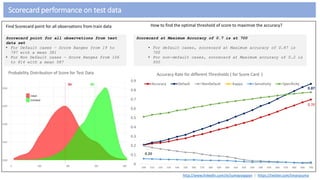


The document discusses a scorecard model for assessing creditworthiness using historical data and probability of default. It highlights how credit scores predict the risk of borrowers defaulting, factors influencing scores, and emphasizes the importance of identifying risky segments in lending. The document also explains the development of the scorecard model and optimal thresholds for maximizing accuracy in predicting defaults.


