SlideShare a Scribd company logo
1 of 7
Download to read offline
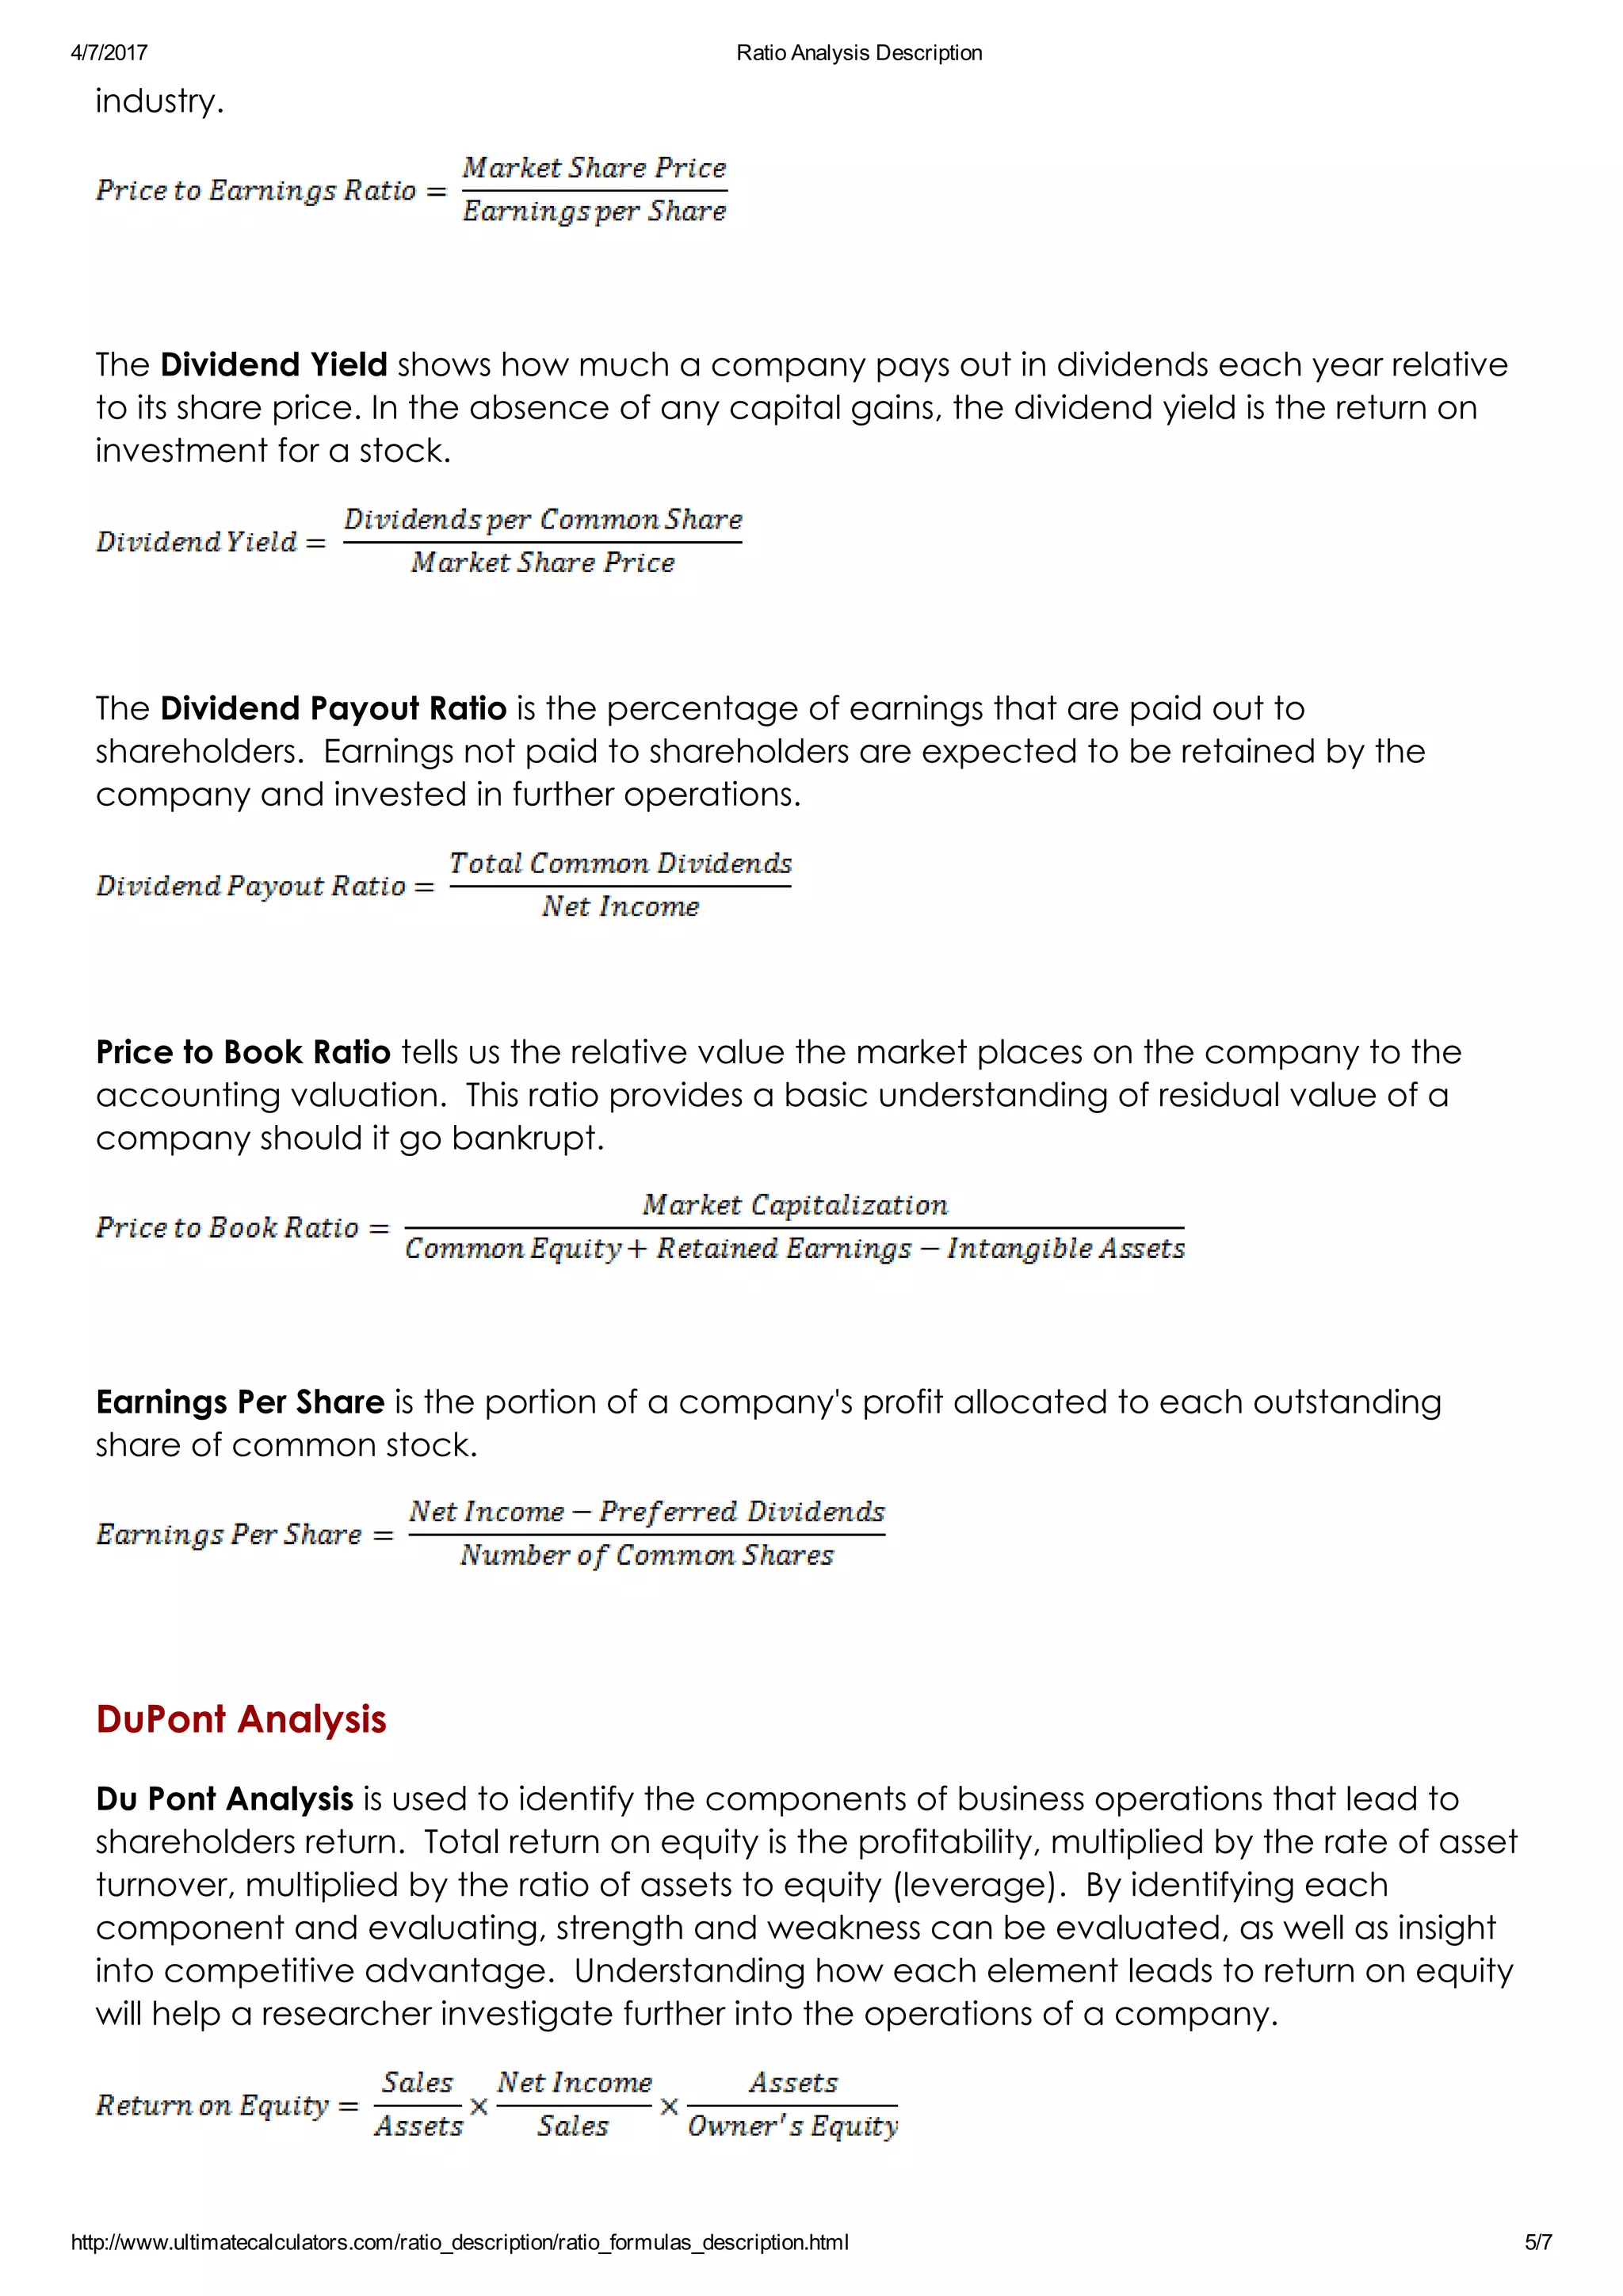
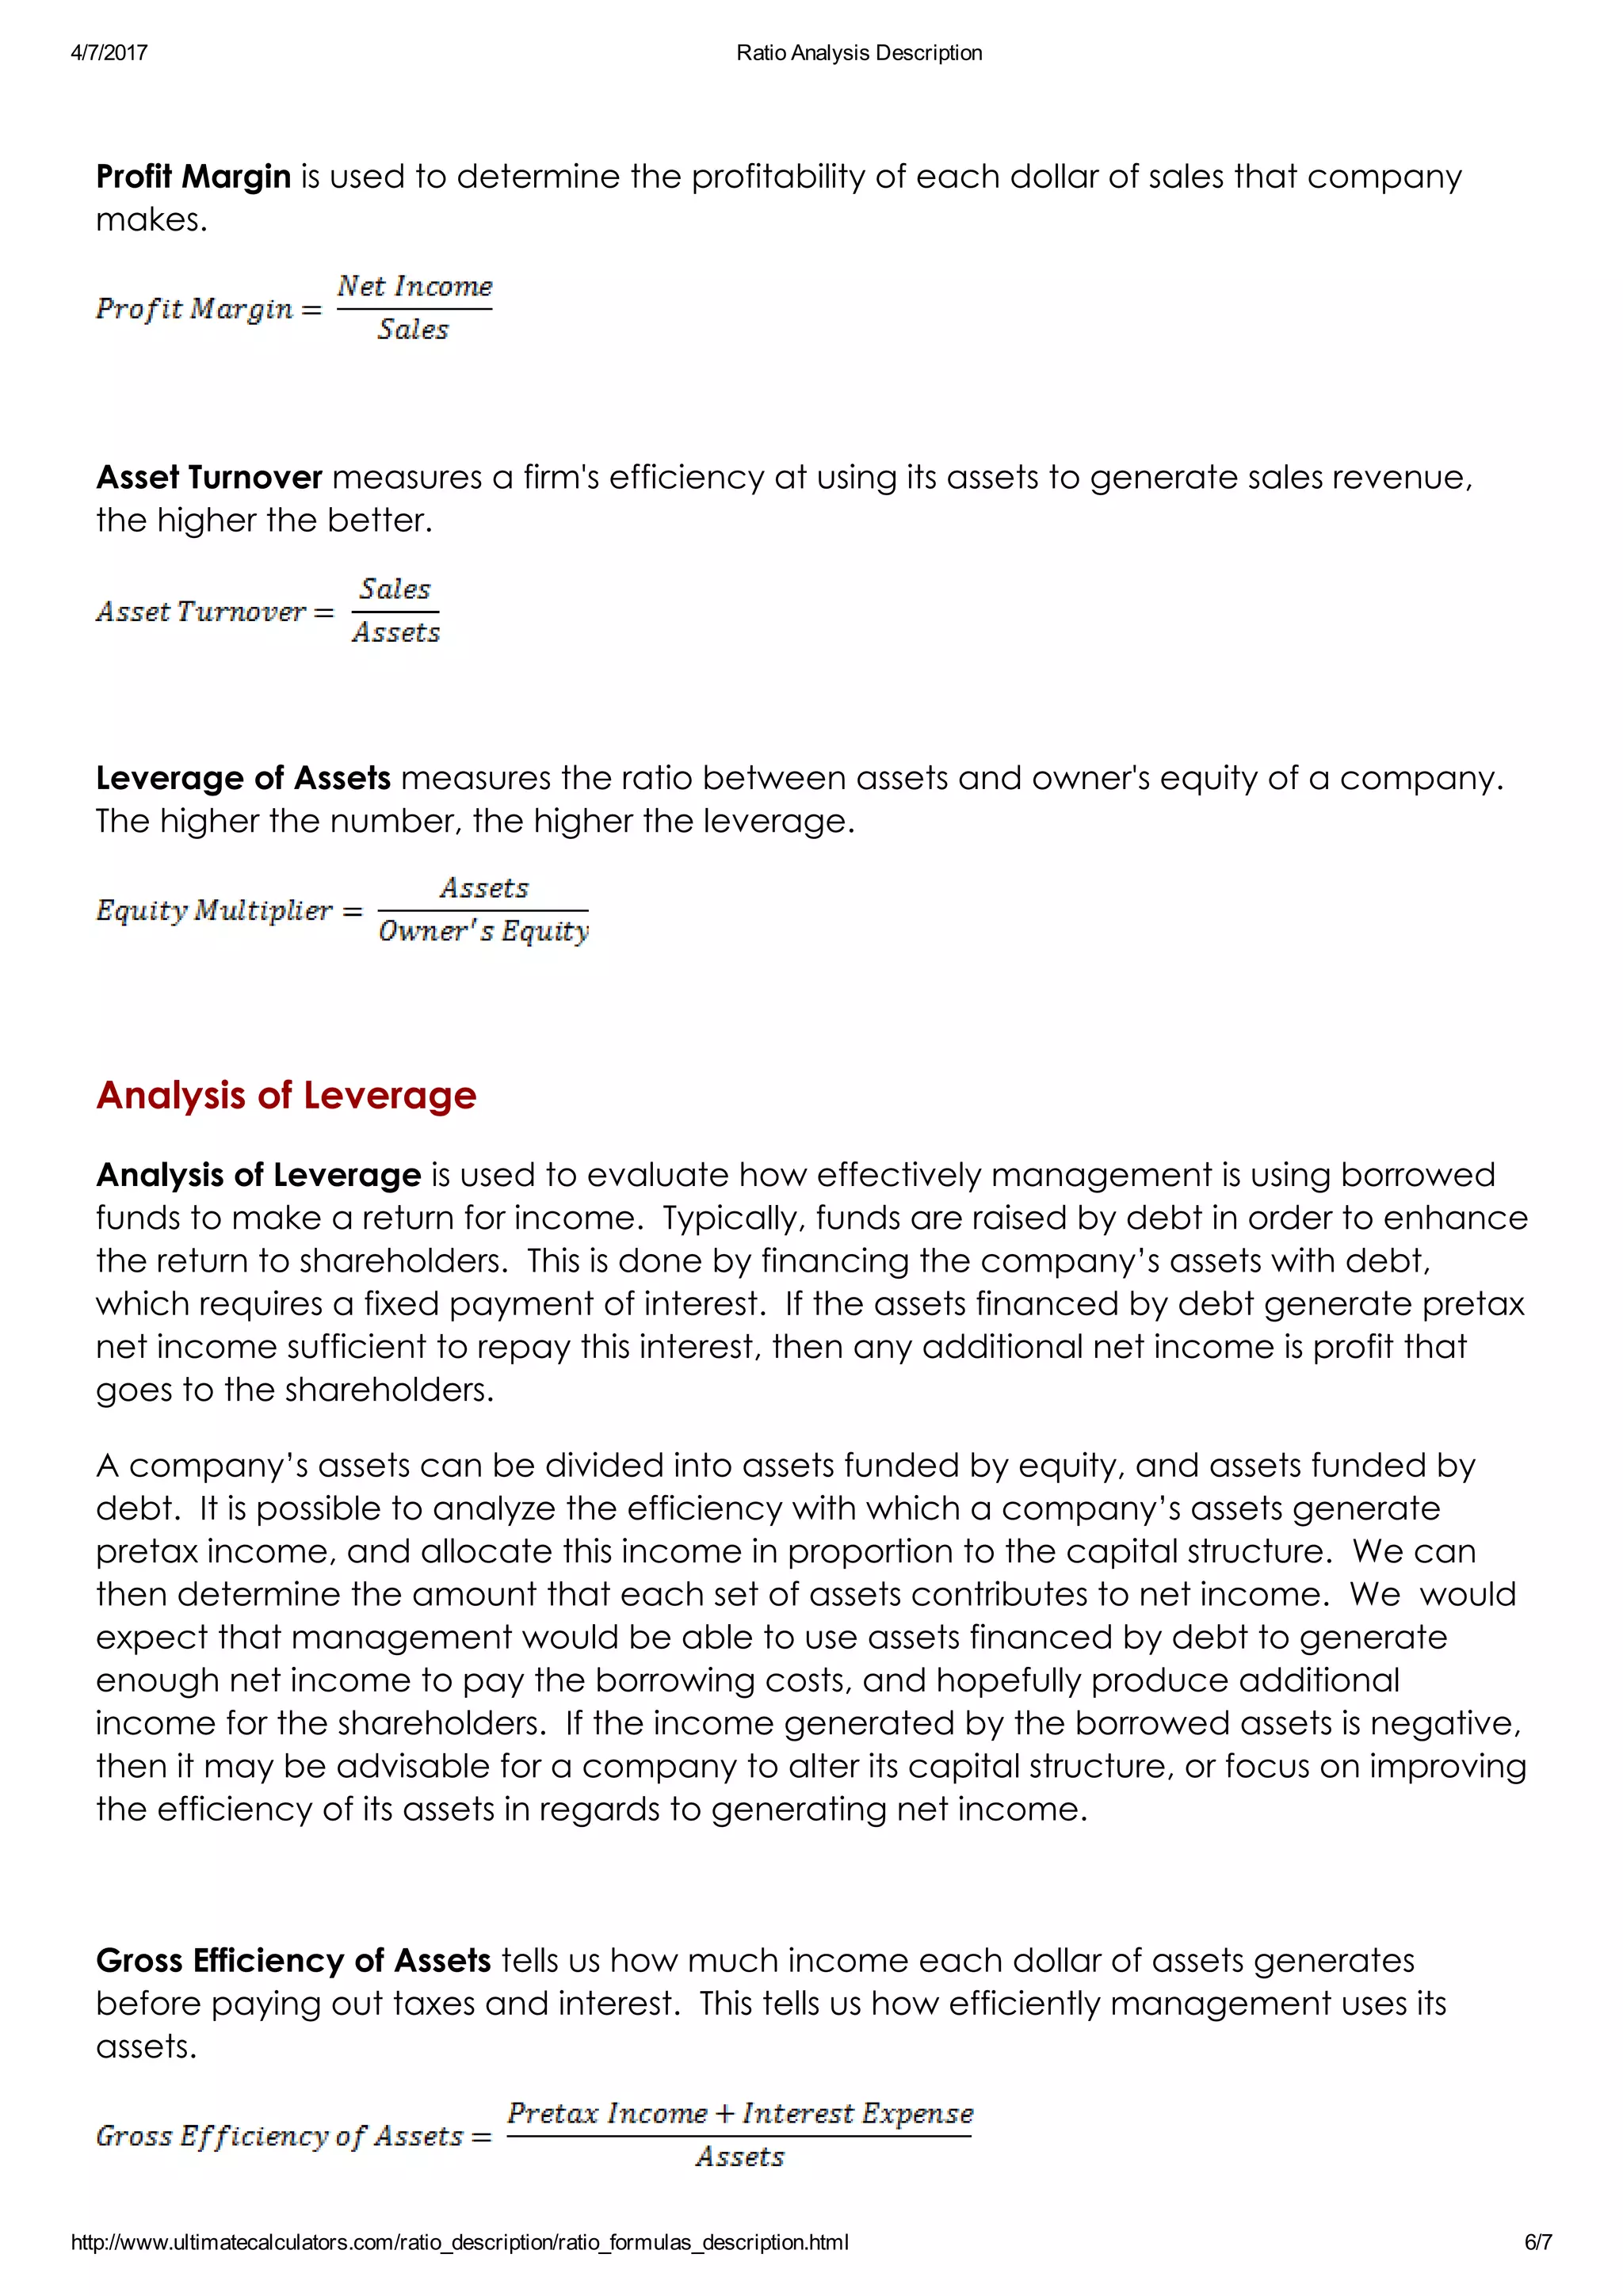
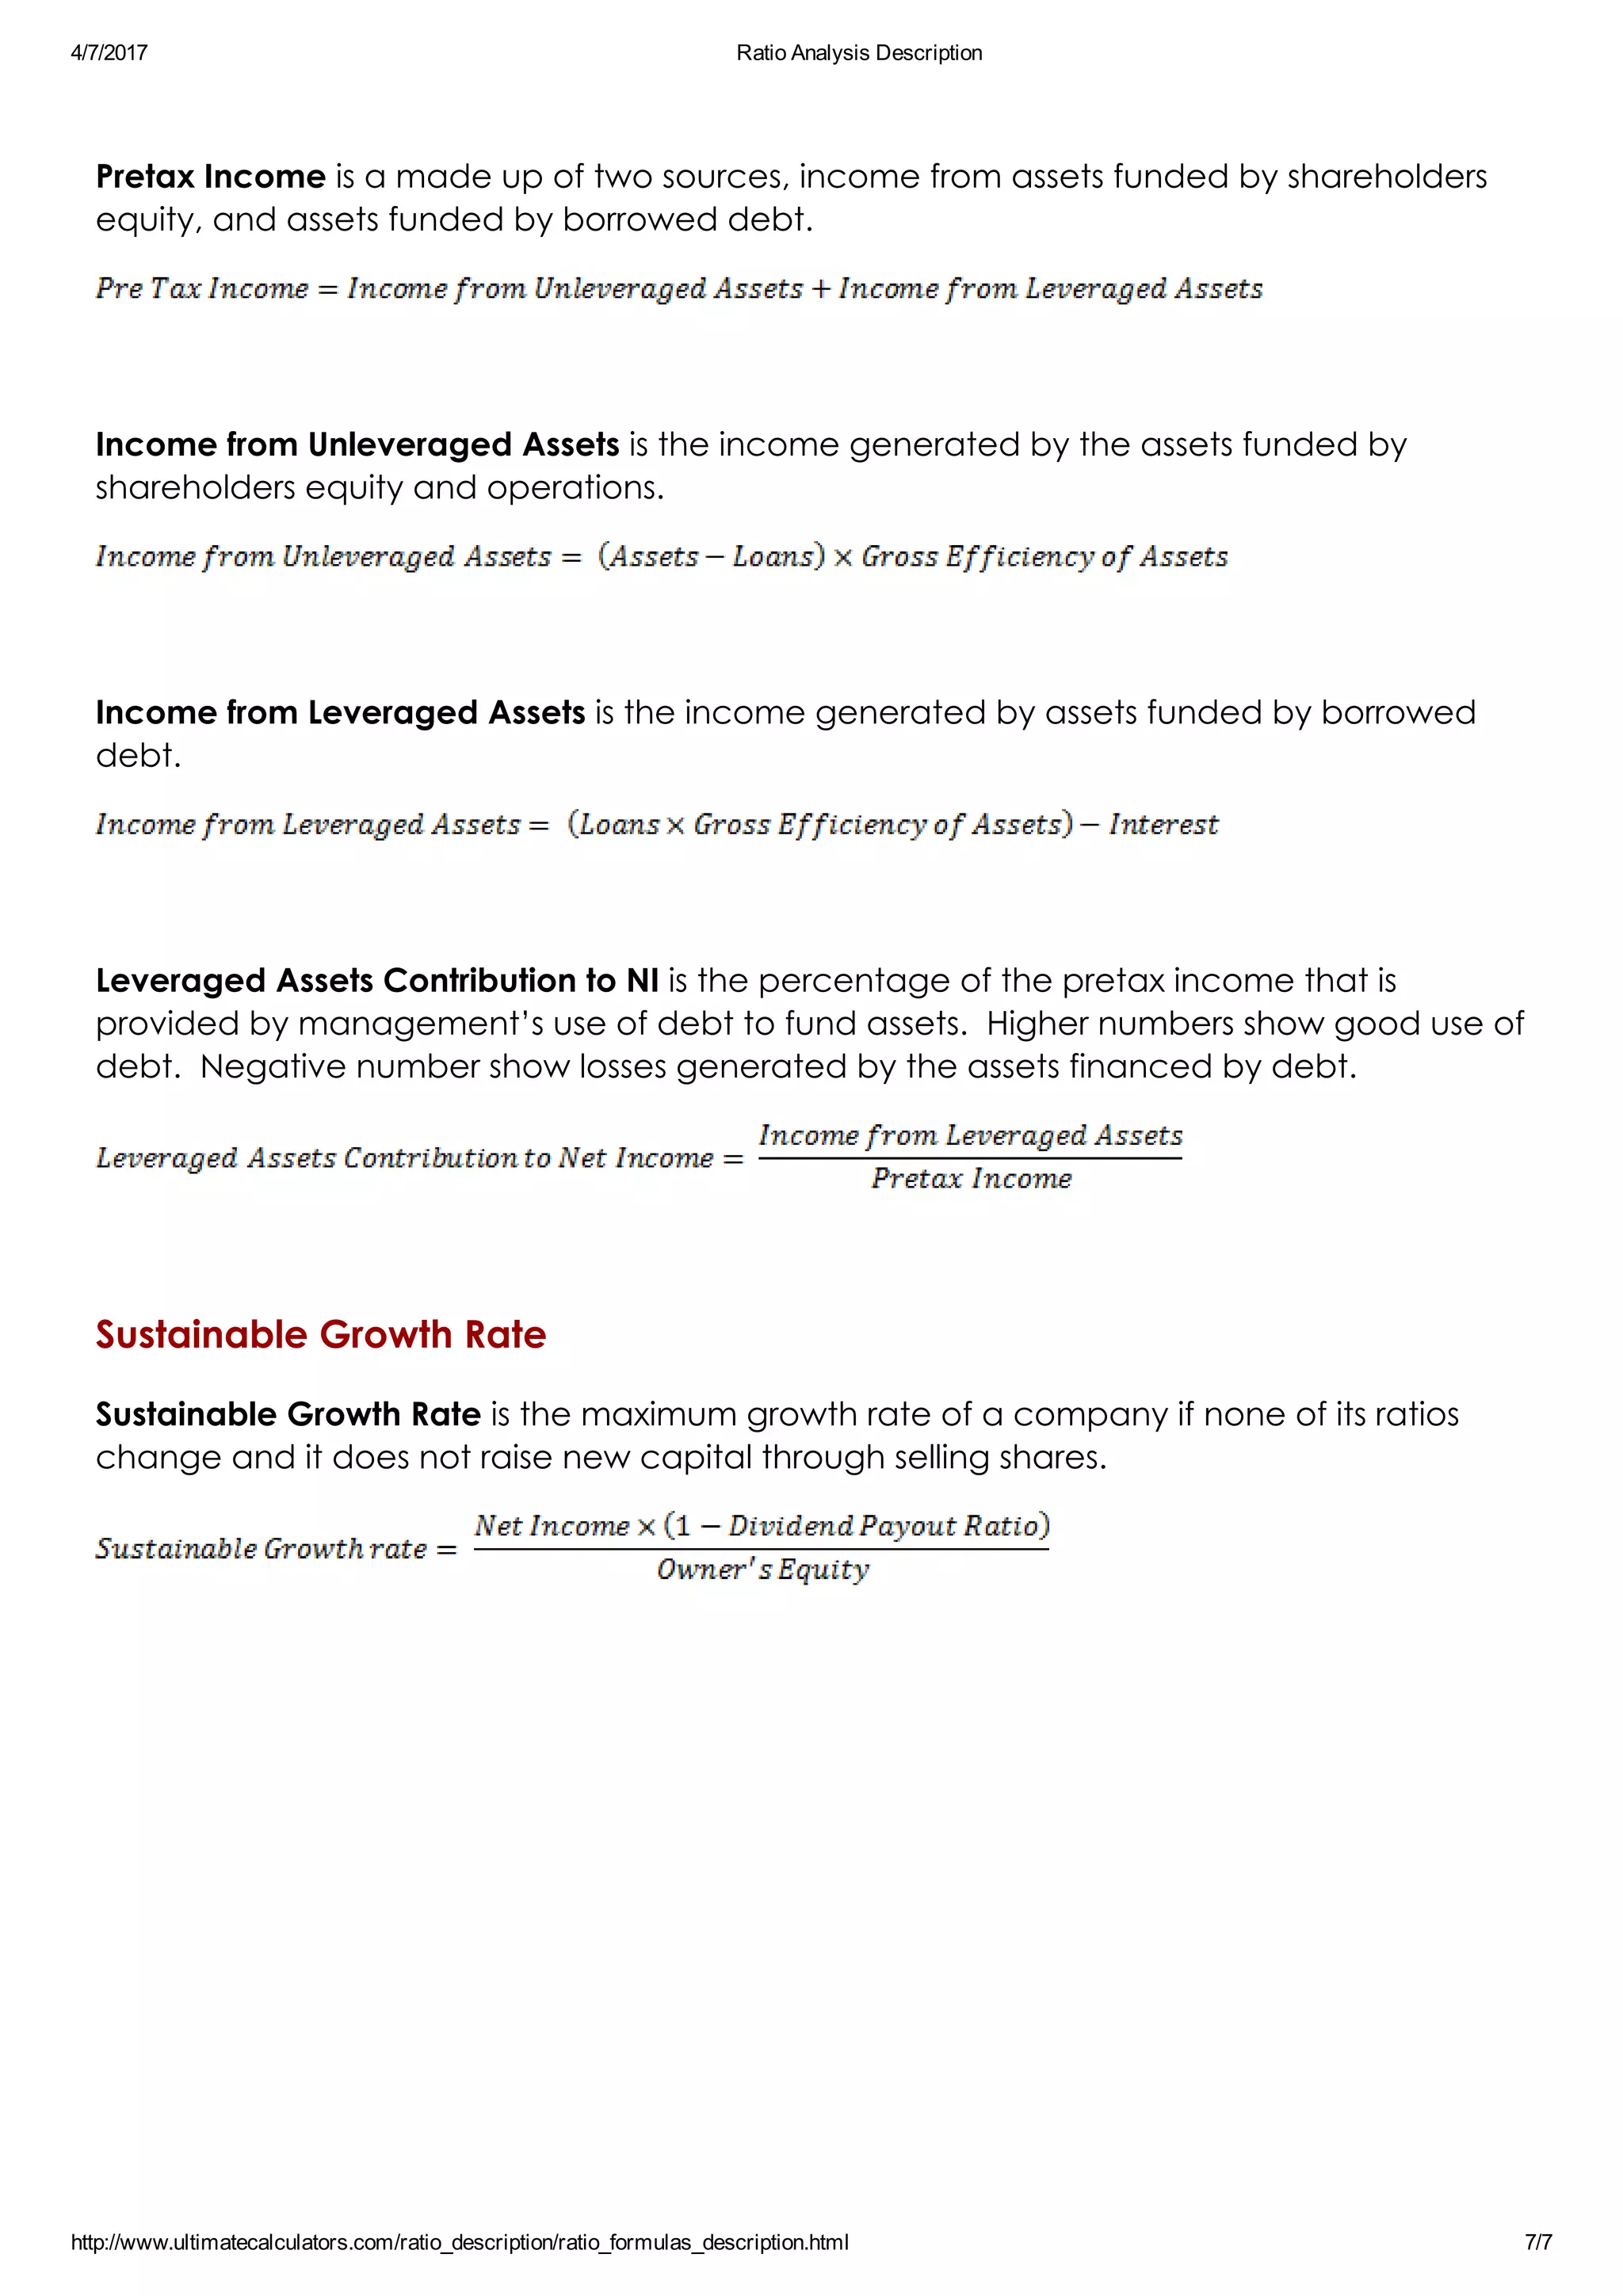
4/7/2017 Ratio Analysis Description
http://www.ultimatecalculators.com/ratio_description/ratio_formulas_description.html 1/7
Financial Statement Analysis
Analysis can be made in many ways.  Financial Ratios can be used to understand and
measure how well a company is doing in an area.  Ratios can be used to compare one
company against another, or one time period against another.  Common size statements
are used to compare different companies, as each line item is expressed as a ratio of
another, and therefore can be used for accurate comparison against different sized
companies.  Trend analysis is helpful to understand the change in a company’s financial
statements from one period to another.
 
Liquidity Ratios
The Current Ratio is used to test the company's ability to pay its short term obligations. 
Below 1 means the company does not have sufficient incoming cash flow to meet its
obligations over the coming year.
 
The Quick Ratio is an indicator of a company's short­term liquidity. The quick ratio
measures a company's ability to meet its short­term obligations with its most liquid assets.
The higher the quick ratio, the better the position of the company.
 
Profitability Ratios
Return on Assets is an indicator of how profitable a company is relative to its total assets.
ROA gives an idea as to how efficient management is at using its assets to generate
earnings.
 
Return on Equity provides the amount of net income returned as a percentage of
shareholders equity. Return on equity measures a corporation's profitability by revealing
how much profit a company generates with the money shareholders have invested. 
 
4/7/2017 Ratio Analysis Description
http://www.ultimatecalculators.com/ratio_description/ratio_formulas_description.html 2/7
The Return on Invested Capital measure gives a sense of how well a company is using its
money to generate returns. Comparing a company's return on capital (ROIC) with its cost
of capital (WACC) reveals whether invested capital was used effectively.
 
Return on Common Equity measures a corporation's profitability by revealing how much
profit a company generates with the money shareholders have invested.
 
Gross Profit Margin (Gross Margin) is used to assess a firm's financial health by revealing the
proportion of money left over from revenues after accounting for the cost of goods sold.
 
Profit Margin is used to determine the profitability of each dollar of sales that company
makes.
 
Operating Margin shows the profitability of the ongoing operations of the company,
before financing expenses and taxes.
 
Earnings Per Share is the portion of a company's profit allocated to each outstanding
share of common stock.
 
Activity Analysis
Asset Turnover measures a firm's efficiency at using its assets to generate sales revenue,
the higher the better. 
4/7/2017 Ratio Analysis Description
http://www.ultimatecalculators.com/ratio_description/ratio_formulas_description.html 3/7
 
Accounts Receivable Turnover is used to quantify a firm's effectiveness in extending credit
as well as collecting debts. The receivables turnover ratio is an activity ratio, measuring
how efficiently a firm uses its assets.
 
Days Receivables indicates the average number of days that receivables are
outstanding.  High numbers indicate long collection periods, low numbers indicate
efficient collection of receivables.
 
Average Days Sales
 
Inventory Turnover measures how many times a company's inventory will be sold and
replaced in a year.
 
Inventory Turnover Period in Days measures how many days it takes for a company to
turnover its entire inventory.
 
Fixed Asset Turnover measures the efficiency of fixed assets to generate profit.  The higher
the number, the more efficient management’s use of fixed assets.
 
Working Capital Turnover measures the depletion of working capital to the generation of
sales over a given period. This provides some useful information as to how effectively a
4/7/2017 Ratio Analysis Description
http://www.ultimatecalculators.com/ratio_description/ratio_formulas_description.html 4/7
company is using its working capital to generate sales.
 
Capital Structure Analysis
The Debt Ratio indicates what proportion of debt a company has relative to its assets. The
measure gives an idea to the leverage of the company along with the potential risks the
company faces in terms of its debt­load.
 
The Debt to Equity Ratio is a measure of a company's financial leverage. It indicates what
proportion of equity and debt the company is using to finance its assets.
 
The Debt to Tangible Net Worth Ratio is a measure of a company's financial leverage to
the tangible asset value of owner's equity. It indicates what proportion of equity and debt
the company is using to finance its tangible assets.
 
Times Interest Earned is used to measure a company's ability to meet its debt obligations. 
Failing to meet these obligations could force a company into bankruptcy.
 
Debt Servicing Ratio is used to assess a company’s ability to meet all of its debt repayment
obligations, both interest and principal repayments.
 
Market Analysis
The Price to Earnings Ratio tells us how many years it will take for earnings to repay the
current market share price.  This is a useful measure to compare companies in the same
4/7/2017 Ratio Analysis Description
http://www.ultimatecalculators.com/ratio_description/ratio_formulas_description.html 5/7
industry.
 
The Dividend Yield shows how much a company pays out in dividends each year relative
to its share price. In the absence of any capital gains, the dividend yield is the return on
investment for a stock.
 
The Dividend Payout Ratio is the percentage of earnings that are paid out to
shareholders.  Earnings not paid to shareholders are expected to be retained by the
company and invested in further operations.
 
Price to Book Ratio tells us the relative value the market places on the company to the
accounting valuation.  This ratio provides a basic understanding of residual value of a
company should it go bankrupt.
 
Earnings Per Share is the portion of a company's profit allocated to each outstanding
share of common stock.
 
DuPont Analysis
Du Pont Analysis is used to identify the components of business operations that lead to
shareholders return.  Total return on equity is the profitability, multiplied by the rate of asset
turnover, multiplied by the ratio of assets to equity (leverage).  By identifying each
component and evaluating, strength and weakness can be evaluated, as well as insight
into competitive advantage.  Understanding how each element leads to return on equity
will help a researcher investigate further into the operations of a company.
4/7/2017 Ratio Analysis Description
http://www.ultimatecalculators.com/ratio_description/ratio_formulas_description.html 6/7
 
Profit Margin is used to determine the profitability of each dollar of sales that company
makes.
 
Asset Turnover measures a firm's efficiency at using its assets to generate sales revenue,
the higher the better. 
 
Leverage of Assets measures the ratio between assets and owner's equity of a company. 
The higher the number, the higher the leverage.
 
Analysis of Leverage
Analysis of Leverage is used to evaluate how effectively management is using borrowed
funds to make a return for income.  Typically, funds are raised by debt in order to enhance
the return to shareholders.  This is done by financing the company’s assets with debt,
which requires a fixed payment of interest.  If the assets financed by debt generate pretax
net income sufficient to repay this interest, then any additional net income is profit that
goes to the shareholders. 
A company’s assets can be divided into assets funded by equity, and assets funded by
debt.  It is possible to analyze the efficiency with which a company’s assets generate
pretax income, and allocate this income in proportion to the capital structure.  We can
then determine the amount that each set of assets contributes to net income.  We  would
expect that management would be able to use assets financed by debt to generate
enough net income to pay the borrowing costs, and hopefully produce additional
income for the shareholders.  If the income generated by the borrowed assets is negative,
then it may be advisable for a company to alter its capital structure, or focus on improving
the efficiency of its assets in regards to generating net income.
 
Gross Efficiency of Assets tells us how much income each dollar of assets generates
before paying out taxes and interest.  This tells us how efficiently management uses its
assets.
4/7/2017 Ratio Analysis Description
http://www.ultimatecalculators.com/ratio_description/ratio_formulas_description.html 7/7
 
Pretax Income is a made up of two sources, income from assets funded by shareholders
equity, and assets funded by borrowed debt.
 
Income from Unleveraged Assets is the income generated by the assets funded by
shareholders equity and operations.
 
Income from Leveraged Assets is the income generated by assets funded by borrowed
debt.
 
Leveraged Assets Contribution to NI is the percentage of the pretax income that is
provided by management’s use of debt to fund assets.  Higher numbers show good use of
debt.  Negative number show losses generated by the assets financed by debt.
 
Sustainable Growth Rate
Sustainable Growth Rate is the maximum growth rate of a company if none of its ratios
change and it does not raise new capital through selling shares.
 

More Related Content

What's hot

Chapter 9-ratio-analysis121
Chapter 9-ratio-analysis121Chapter 9-ratio-analysis121
Chapter 9-ratio-analysis121
Anjaneyulu Bandi
 
Ratio Analysis
Ratio AnalysisRatio Analysis
Ratio Analysis
Dharan178
 
A Study of Disclosure of Accounting Policies in BAJAJ Allianz Insurance Compa...
A Study of Disclosure of Accounting Policies in BAJAJ Allianz Insurance Compa...A Study of Disclosure of Accounting Policies in BAJAJ Allianz Insurance Compa...
A Study of Disclosure of Accounting Policies in BAJAJ Allianz Insurance Compa...
employee goverment
 
Ratio analysis techniques
Ratio analysis techniquesRatio analysis techniques
Ratio analysis techniques
dhruv1898
 

What's hot (20)

No More Smoke and Mirrors: Knowing and Demonstrating Business Numbers
No More Smoke and Mirrors: Knowing and Demonstrating Business NumbersNo More Smoke and Mirrors: Knowing and Demonstrating Business Numbers
No More Smoke and Mirrors: Knowing and Demonstrating Business Numbers
 
Ratio analysis
Ratio analysisRatio analysis
Ratio analysis
 
Ratio analysis - Financial ratios for B Com students
Ratio analysis -  Financial ratios for B Com students Ratio analysis -  Financial ratios for B Com students
Ratio analysis - Financial ratios for B Com students
 
Ratio analysis
Ratio analysisRatio analysis
Ratio analysis
 
Introduction to ratio analysis
Introduction to ratio analysisIntroduction to ratio analysis
Introduction to ratio analysis
 
Chapter 9-ratio-analysis121
Chapter 9-ratio-analysis121Chapter 9-ratio-analysis121
Chapter 9-ratio-analysis121
 
Ratio Analysis
Ratio AnalysisRatio Analysis
Ratio Analysis
 
[Project] Financial Statement Analysis
[Project] Financial Statement Analysis[Project] Financial Statement Analysis
[Project] Financial Statement Analysis
 
Ratio Analysis
Ratio AnalysisRatio Analysis
Ratio Analysis
 
Financial accounting
Financial accountingFinancial accounting
Financial accounting
 
Ratios
RatiosRatios
Ratios
 
ratio analysis of hero motocorp ltd.
ratio analysis of hero motocorp ltd.ratio analysis of hero motocorp ltd.
ratio analysis of hero motocorp ltd.
 
A Study of Disclosure of Accounting Policies in BAJAJ Allianz Insurance Compa...
A Study of Disclosure of Accounting Policies in BAJAJ Allianz Insurance Compa...A Study of Disclosure of Accounting Policies in BAJAJ Allianz Insurance Compa...
A Study of Disclosure of Accounting Policies in BAJAJ Allianz Insurance Compa...
 
Financial ratio analysis
Financial ratio analysisFinancial ratio analysis
Financial ratio analysis
 
Sip 2013 15 main report-kiran mankumbre 110914
Sip 2013 15 main report-kiran mankumbre 110914Sip 2013 15 main report-kiran mankumbre 110914
Sip 2013 15 main report-kiran mankumbre 110914
 
Ratio analysis techniques
Ratio analysis techniquesRatio analysis techniques
Ratio analysis techniques
 
Ratio Analysis by Dr. Suresh vadde
Ratio Analysis by Dr. Suresh vaddeRatio Analysis by Dr. Suresh vadde
Ratio Analysis by Dr. Suresh vadde
 
Ratios
RatiosRatios
Ratios
 
Financial Ratios
Financial  RatiosFinancial  Ratios
Financial Ratios
 
Financial ratio report
Financial ratio reportFinancial ratio report
Financial ratio report
 

Similar to Scm inventory management workshop ppt copy

Ratios and Formulas in Customer Financial AnalysisFinancial stat.docx
Ratios and Formulas in Customer Financial AnalysisFinancial stat.docxRatios and Formulas in Customer Financial AnalysisFinancial stat.docx
Ratios and Formulas in Customer Financial AnalysisFinancial stat.docx
catheryncouper
 
Chapter 6_Interpretation of Financial Statement
Chapter 6_Interpretation of Financial StatementChapter 6_Interpretation of Financial Statement
Chapter 6_Interpretation of Financial Statement
Presana1
 
C:\Fakepath\44 Ratio Analysis 1
C:\Fakepath\44 Ratio Analysis 1 C:\Fakepath\44 Ratio Analysis 1
C:\Fakepath\44 Ratio Analysis 1
guestb31b11
 
Instructional intervention work sheet
Instructional intervention work sheetInstructional intervention work sheet
Instructional intervention work sheet
Feljone Ragma
 
Explain the various categories of ratio analysis and provide example.pdf
Explain the various categories of ratio analysis and provide example.pdfExplain the various categories of ratio analysis and provide example.pdf
Explain the various categories of ratio analysis and provide example.pdf
archanenterprises
 
Ratio Analysis Ppt
Ratio Analysis PptRatio Analysis Ppt
Ratio Analysis Ppt
Mobasher Ali
 

Similar to Scm inventory management workshop ppt copy (20)

RATIO ANALYSIS.pptx
RATIO ANALYSIS.pptxRATIO ANALYSIS.pptx
RATIO ANALYSIS.pptx
 
Ratio Analysis- Dr.J.Mexon
Ratio Analysis- Dr.J.MexonRatio Analysis- Dr.J.Mexon
Ratio Analysis- Dr.J.Mexon
 
Ratios and Formulas in Customer Financial AnalysisFinancial stat.docx
Ratios and Formulas in Customer Financial AnalysisFinancial stat.docxRatios and Formulas in Customer Financial AnalysisFinancial stat.docx
Ratios and Formulas in Customer Financial AnalysisFinancial stat.docx
 
Ratio analysis of square pharma
Ratio analysis of square pharmaRatio analysis of square pharma
Ratio analysis of square pharma
 
Chapter 6_Interpretation of Financial Statement
Chapter 6_Interpretation of Financial StatementChapter 6_Interpretation of Financial Statement
Chapter 6_Interpretation of Financial Statement
 
Ratio analysis1
Ratio analysis1Ratio analysis1
Ratio analysis1
 
Ratio analysis.pptx
Ratio analysis.pptxRatio analysis.pptx
Ratio analysis.pptx
 
C:\Fakepath\44 Ratio Analysis 1
C:\Fakepath\44 Ratio Analysis 1 C:\Fakepath\44 Ratio Analysis 1
C:\Fakepath\44 Ratio Analysis 1
 
Ratio analysis
Ratio analysisRatio analysis
Ratio analysis
 
Ratio analysis
Ratio analysisRatio analysis
Ratio analysis
 
Instructional intervention work sheet
Instructional intervention work sheetInstructional intervention work sheet
Instructional intervention work sheet
 
Financial Ratios - Introduction to Efficiency Ratios
Financial Ratios - Introduction to Efficiency RatiosFinancial Ratios - Introduction to Efficiency Ratios
Financial Ratios - Introduction to Efficiency Ratios
 
Explain the various categories of ratio analysis and provide example.pdf
Explain the various categories of ratio analysis and provide example.pdfExplain the various categories of ratio analysis and provide example.pdf
Explain the various categories of ratio analysis and provide example.pdf
 
Industry specific ratios and Financial Ratios
Industry specific ratios and Financial RatiosIndustry specific ratios and Financial Ratios
Industry specific ratios and Financial Ratios
 
Ratioanalysis
RatioanalysisRatioanalysis
Ratioanalysis
 
Ratio Analysis Ppt
Ratio Analysis PptRatio Analysis Ppt
Ratio Analysis Ppt
 
RATIO ANALYSIS BY KK MAHESH PUC STUDENTS
RATIO ANALYSIS BY KK MAHESH PUC STUDENTSRATIO ANALYSIS BY KK MAHESH PUC STUDENTS
RATIO ANALYSIS BY KK MAHESH PUC STUDENTS
 
Ratio Analysis in financial statements (KK MAHESH PU COLLEGE)
Ratio Analysis in financial statements (KK MAHESH  PU COLLEGE)Ratio Analysis in financial statements (KK MAHESH  PU COLLEGE)
Ratio Analysis in financial statements (KK MAHESH PU COLLEGE)
 
UNIT-2 Ratio.pptx
UNIT-2 Ratio.pptxUNIT-2 Ratio.pptx
UNIT-2 Ratio.pptx
 
Sg03
Sg03Sg03
Sg03
 

Recently uploaded

Shots fired Budget Presentation.pdf12312
Shots fired Budget Presentation.pdf12312Shots fired Budget Presentation.pdf12312
Shots fired Budget Presentation.pdf12312
LR1709MUSIC
 
Challenges and Opportunities: A Qualitative Study on Tax Compliance in Pakistan
Challenges and Opportunities: A Qualitative Study on Tax Compliance in PakistanChallenges and Opportunities: A Qualitative Study on Tax Compliance in Pakistan
Challenges and Opportunities: A Qualitative Study on Tax Compliance in Pakistan
vineshkumarsajnani12
 
Contact +971581248768 for 100% original and safe abortion pills available for...
Contact +971581248768 for 100% original and safe abortion pills available for...Contact +971581248768 for 100% original and safe abortion pills available for...
Contact +971581248768 for 100% original and safe abortion pills available for...
DUBAI (+971)581248768 BUY ABORTION PILLS IN ABU dhabi...Qatar
 

Recently uploaded (20)

Getting Real with AI - Columbus DAW - May 2024 - Nick Woo from AlignAI
Getting Real with AI - Columbus DAW - May 2024 - Nick Woo from AlignAIGetting Real with AI - Columbus DAW - May 2024 - Nick Woo from AlignAI
Getting Real with AI - Columbus DAW - May 2024 - Nick Woo from AlignAI
 
Shots fired Budget Presentation.pdf12312
Shots fired Budget Presentation.pdf12312Shots fired Budget Presentation.pdf12312
Shots fired Budget Presentation.pdf12312
 
Managerial Accounting 5th Edition by Stacey Whitecotton test bank.docx
Managerial Accounting 5th Edition by Stacey Whitecotton test bank.docxManagerial Accounting 5th Edition by Stacey Whitecotton test bank.docx
Managerial Accounting 5th Edition by Stacey Whitecotton test bank.docx
 
QSM Chap 10 Service Culture in Tourism and Hospitality Industry.pptx
QSM Chap 10 Service Culture in Tourism and Hospitality Industry.pptxQSM Chap 10 Service Culture in Tourism and Hospitality Industry.pptx
QSM Chap 10 Service Culture in Tourism and Hospitality Industry.pptx
 
Challenges and Opportunities: A Qualitative Study on Tax Compliance in Pakistan
Challenges and Opportunities: A Qualitative Study on Tax Compliance in PakistanChallenges and Opportunities: A Qualitative Study on Tax Compliance in Pakistan
Challenges and Opportunities: A Qualitative Study on Tax Compliance in Pakistan
 
SEO Case Study: How I Increased SEO Traffic & Ranking by 50-60% in 6 Months
SEO Case Study: How I Increased SEO Traffic & Ranking by 50-60%  in 6 MonthsSEO Case Study: How I Increased SEO Traffic & Ranking by 50-60%  in 6 Months
SEO Case Study: How I Increased SEO Traffic & Ranking by 50-60% in 6 Months
 
Top Quality adbb 5cl-a-d-b Best precursor raw material
Top Quality adbb 5cl-a-d-b Best precursor raw materialTop Quality adbb 5cl-a-d-b Best precursor raw material
Top Quality adbb 5cl-a-d-b Best precursor raw material
 
Progress Report - Oracle's OCI Analyst Summit 2024
Progress Report - Oracle's OCI Analyst Summit 2024Progress Report - Oracle's OCI Analyst Summit 2024
Progress Report - Oracle's OCI Analyst Summit 2024
 
Contact +971581248768 for 100% original and safe abortion pills available for...
Contact +971581248768 for 100% original and safe abortion pills available for...Contact +971581248768 for 100% original and safe abortion pills available for...
Contact +971581248768 for 100% original and safe abortion pills available for...
 
Unveiling Falcon Invoice Discounting: Leading the Way as India's Premier Bill...
Unveiling Falcon Invoice Discounting: Leading the Way as India's Premier Bill...Unveiling Falcon Invoice Discounting: Leading the Way as India's Premier Bill...
Unveiling Falcon Invoice Discounting: Leading the Way as India's Premier Bill...
 
HomeRoots Pitch Deck | Investor Insights | April 2024
HomeRoots Pitch Deck | Investor Insights | April 2024HomeRoots Pitch Deck | Investor Insights | April 2024
HomeRoots Pitch Deck | Investor Insights | April 2024
 
Berhampur Call Girl Just Call♥️ 8084732287 ♥️Top Class Call Girl Service Avai...
Berhampur Call Girl Just Call♥️ 8084732287 ♥️Top Class Call Girl Service Avai...Berhampur Call Girl Just Call♥️ 8084732287 ♥️Top Class Call Girl Service Avai...
Berhampur Call Girl Just Call♥️ 8084732287 ♥️Top Class Call Girl Service Avai...
 
Home Furnishings Ecommerce Platform Short Pitch 2024
Home Furnishings Ecommerce Platform Short Pitch 2024Home Furnishings Ecommerce Platform Short Pitch 2024
Home Furnishings Ecommerce Platform Short Pitch 2024
 
DUNGARPUR 💋 Call Girl 9827461493 Call Girls in Escort service book now
DUNGARPUR 💋 Call Girl 9827461493 Call Girls in  Escort service book nowDUNGARPUR 💋 Call Girl 9827461493 Call Girls in  Escort service book now
DUNGARPUR 💋 Call Girl 9827461493 Call Girls in Escort service book now
 
WheelTug Short Pitch Deck 2024 | Byond Insights
WheelTug Short Pitch Deck 2024 | Byond InsightsWheelTug Short Pitch Deck 2024 | Byond Insights
WheelTug Short Pitch Deck 2024 | Byond Insights
 
The Vietnam Believer Newsletter_May 13th, 2024_ENVol. 007.pdf
The Vietnam Believer Newsletter_May 13th, 2024_ENVol. 007.pdfThe Vietnam Believer Newsletter_May 13th, 2024_ENVol. 007.pdf
The Vietnam Believer Newsletter_May 13th, 2024_ENVol. 007.pdf
 
Thompson_Taylor_MBBS_PB1_2024-03 (1)- Project & Portfolio 2.pptx
Thompson_Taylor_MBBS_PB1_2024-03 (1)- Project & Portfolio 2.pptxThompson_Taylor_MBBS_PB1_2024-03 (1)- Project & Portfolio 2.pptx
Thompson_Taylor_MBBS_PB1_2024-03 (1)- Project & Portfolio 2.pptx
 
Falcon Invoice Discounting: The best investment platform in india for investors
Falcon Invoice Discounting: The best investment platform in india for investorsFalcon Invoice Discounting: The best investment platform in india for investors
Falcon Invoice Discounting: The best investment platform in india for investors
 
How does a bike-share company navigate speedy success? - Cyclistic
How does a bike-share company navigate speedy success? - CyclisticHow does a bike-share company navigate speedy success? - Cyclistic
How does a bike-share company navigate speedy success? - Cyclistic
 
A DAY IN THE LIFE OF A SALESPERSON .pptx
A DAY IN THE LIFE OF A SALESPERSON .pptxA DAY IN THE LIFE OF A SALESPERSON .pptx
A DAY IN THE LIFE OF A SALESPERSON .pptx
 

Scm inventory management workshop ppt copy

  • 1. 4/7/2017 Ratio Analysis Description http://www.ultimatecalculators.com/ratio_description/ratio_formulas_description.html 1/7 Financial Statement Analysis Analysis can be made in many ways.  Financial Ratios can be used to understand and measure how well a company is doing in an area.  Ratios can be used to compare one company against another, or one time period against another.  Common size statements are used to compare different companies, as each line item is expressed as a ratio of another, and therefore can be used for accurate comparison against different sized companies.  Trend analysis is helpful to understand the change in a company’s financial statements from one period to another.   Liquidity Ratios The Current Ratio is used to test the company's ability to pay its short term obligations.  Below 1 means the company does not have sufficient incoming cash flow to meet its obligations over the coming year.   The Quick Ratio is an indicator of a company's short­term liquidity. The quick ratio measures a company's ability to meet its short­term obligations with its most liquid assets. The higher the quick ratio, the better the position of the company.   Profitability Ratios Return on Assets is an indicator of how profitable a company is relative to its total assets. ROA gives an idea as to how efficient management is at using its assets to generate earnings.   Return on Equity provides the amount of net income returned as a percentage of shareholders equity. Return on equity measures a corporation's profitability by revealing how much profit a company generates with the money shareholders have invested.   
  • 2. 4/7/2017 Ratio Analysis Description http://www.ultimatecalculators.com/ratio_description/ratio_formulas_description.html 2/7 The Return on Invested Capital measure gives a sense of how well a company is using its money to generate returns. Comparing a company's return on capital (ROIC) with its cost of capital (WACC) reveals whether invested capital was used effectively.   Return on Common Equity measures a corporation's profitability by revealing how much profit a company generates with the money shareholders have invested.   Gross Profit Margin (Gross Margin) is used to assess a firm's financial health by revealing the proportion of money left over from revenues after accounting for the cost of goods sold.   Profit Margin is used to determine the profitability of each dollar of sales that company makes.   Operating Margin shows the profitability of the ongoing operations of the company, before financing expenses and taxes.   Earnings Per Share is the portion of a company's profit allocated to each outstanding share of common stock.   Activity Analysis Asset Turnover measures a firm's efficiency at using its assets to generate sales revenue, the higher the better. 
  • 3. 4/7/2017 Ratio Analysis Description http://www.ultimatecalculators.com/ratio_description/ratio_formulas_description.html 3/7   Accounts Receivable Turnover is used to quantify a firm's effectiveness in extending credit as well as collecting debts. The receivables turnover ratio is an activity ratio, measuring how efficiently a firm uses its assets.   Days Receivables indicates the average number of days that receivables are outstanding.  High numbers indicate long collection periods, low numbers indicate efficient collection of receivables.   Average Days Sales   Inventory Turnover measures how many times a company's inventory will be sold and replaced in a year.   Inventory Turnover Period in Days measures how many days it takes for a company to turnover its entire inventory.   Fixed Asset Turnover measures the efficiency of fixed assets to generate profit.  The higher the number, the more efficient management’s use of fixed assets.   Working Capital Turnover measures the depletion of working capital to the generation of sales over a given period. This provides some useful information as to how effectively a
  • 4. 4/7/2017 Ratio Analysis Description http://www.ultimatecalculators.com/ratio_description/ratio_formulas_description.html 4/7 company is using its working capital to generate sales.   Capital Structure Analysis The Debt Ratio indicates what proportion of debt a company has relative to its assets. The measure gives an idea to the leverage of the company along with the potential risks the company faces in terms of its debt­load.   The Debt to Equity Ratio is a measure of a company's financial leverage. It indicates what proportion of equity and debt the company is using to finance its assets.   The Debt to Tangible Net Worth Ratio is a measure of a company's financial leverage to the tangible asset value of owner's equity. It indicates what proportion of equity and debt the company is using to finance its tangible assets.   Times Interest Earned is used to measure a company's ability to meet its debt obligations.  Failing to meet these obligations could force a company into bankruptcy.   Debt Servicing Ratio is used to assess a company’s ability to meet all of its debt repayment obligations, both interest and principal repayments.   Market Analysis The Price to Earnings Ratio tells us how many years it will take for earnings to repay the current market share price.  This is a useful measure to compare companies in the same
  • 5. 4/7/2017 Ratio Analysis Description http://www.ultimatecalculators.com/ratio_description/ratio_formulas_description.html 5/7 industry.   The Dividend Yield shows how much a company pays out in dividends each year relative to its share price. In the absence of any capital gains, the dividend yield is the return on investment for a stock.   The Dividend Payout Ratio is the percentage of earnings that are paid out to shareholders.  Earnings not paid to shareholders are expected to be retained by the company and invested in further operations.   Price to Book Ratio tells us the relative value the market places on the company to the accounting valuation.  This ratio provides a basic understanding of residual value of a company should it go bankrupt.   Earnings Per Share is the portion of a company's profit allocated to each outstanding share of common stock.   DuPont Analysis Du Pont Analysis is used to identify the components of business operations that lead to shareholders return.  Total return on equity is the profitability, multiplied by the rate of asset turnover, multiplied by the ratio of assets to equity (leverage).  By identifying each component and evaluating, strength and weakness can be evaluated, as well as insight into competitive advantage.  Understanding how each element leads to return on equity will help a researcher investigate further into the operations of a company.
  • 6. 4/7/2017 Ratio Analysis Description http://www.ultimatecalculators.com/ratio_description/ratio_formulas_description.html 6/7   Profit Margin is used to determine the profitability of each dollar of sales that company makes.   Asset Turnover measures a firm's efficiency at using its assets to generate sales revenue, the higher the better.    Leverage of Assets measures the ratio between assets and owner's equity of a company.  The higher the number, the higher the leverage.   Analysis of Leverage Analysis of Leverage is used to evaluate how effectively management is using borrowed funds to make a return for income.  Typically, funds are raised by debt in order to enhance the return to shareholders.  This is done by financing the company’s assets with debt, which requires a fixed payment of interest.  If the assets financed by debt generate pretax net income sufficient to repay this interest, then any additional net income is profit that goes to the shareholders.  A company’s assets can be divided into assets funded by equity, and assets funded by debt.  It is possible to analyze the efficiency with which a company’s assets generate pretax income, and allocate this income in proportion to the capital structure.  We can then determine the amount that each set of assets contributes to net income.  We  would expect that management would be able to use assets financed by debt to generate enough net income to pay the borrowing costs, and hopefully produce additional income for the shareholders.  If the income generated by the borrowed assets is negative, then it may be advisable for a company to alter its capital structure, or focus on improving the efficiency of its assets in regards to generating net income.   Gross Efficiency of Assets tells us how much income each dollar of assets generates before paying out taxes and interest.  This tells us how efficiently management uses its assets.
  • 7. 4/7/2017 Ratio Analysis Description http://www.ultimatecalculators.com/ratio_description/ratio_formulas_description.html 7/7   Pretax Income is a made up of two sources, income from assets funded by shareholders equity, and assets funded by borrowed debt.   Income from Unleveraged Assets is the income generated by the assets funded by shareholders equity and operations.   Income from Leveraged Assets is the income generated by assets funded by borrowed debt.   Leveraged Assets Contribution to NI is the percentage of the pretax income that is provided by management’s use of debt to fund assets.  Higher numbers show good use of debt.  Negative number show losses generated by the assets financed by debt.   Sustainable Growth Rate Sustainable Growth Rate is the maximum growth rate of a company if none of its ratios change and it does not raise new capital through selling shares.