Download as PDF, PPTX
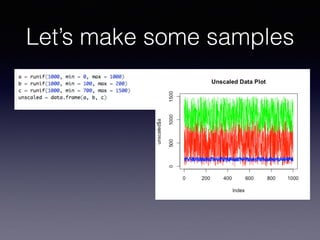
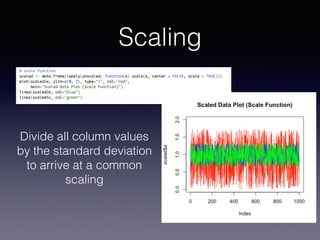
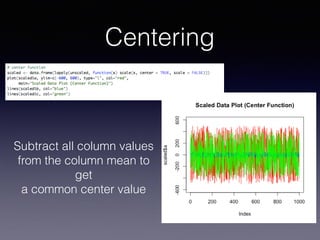
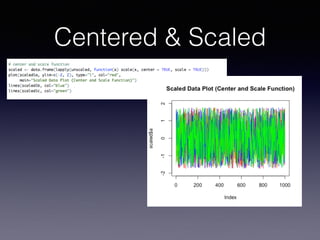
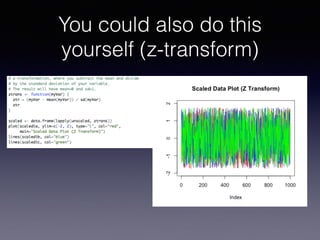

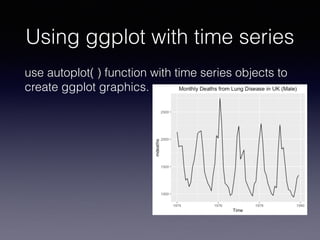
Scaling transforms datasets to a common scale, usually to compare datasets with different scoring mechanisms. It allows measurement of relative effects across scales. The scale() function scales and centers data by dividing column values by the standard deviation and subtracting from the column mean. Recent updates to the forecast package allow using ggplot for plotting time series forecasts, with the autoplot() function creating ggplot graphics from time series objects.


![제 23회 보아즈(BOAZ) 빅데이터 컨퍼런스 - [MBOAX] : ABSA를 활용한 소비자 반응 분석 기반 운영 효율화 대시보드 설계](https://cdn.slidesharecdn.com/ss_thumbnails/3-1boaz23rdconferencemboax-260203102709-9d519923-thumbnail.jpg?width=640&height=640&fit=bounds)


