Downloaded 13 times


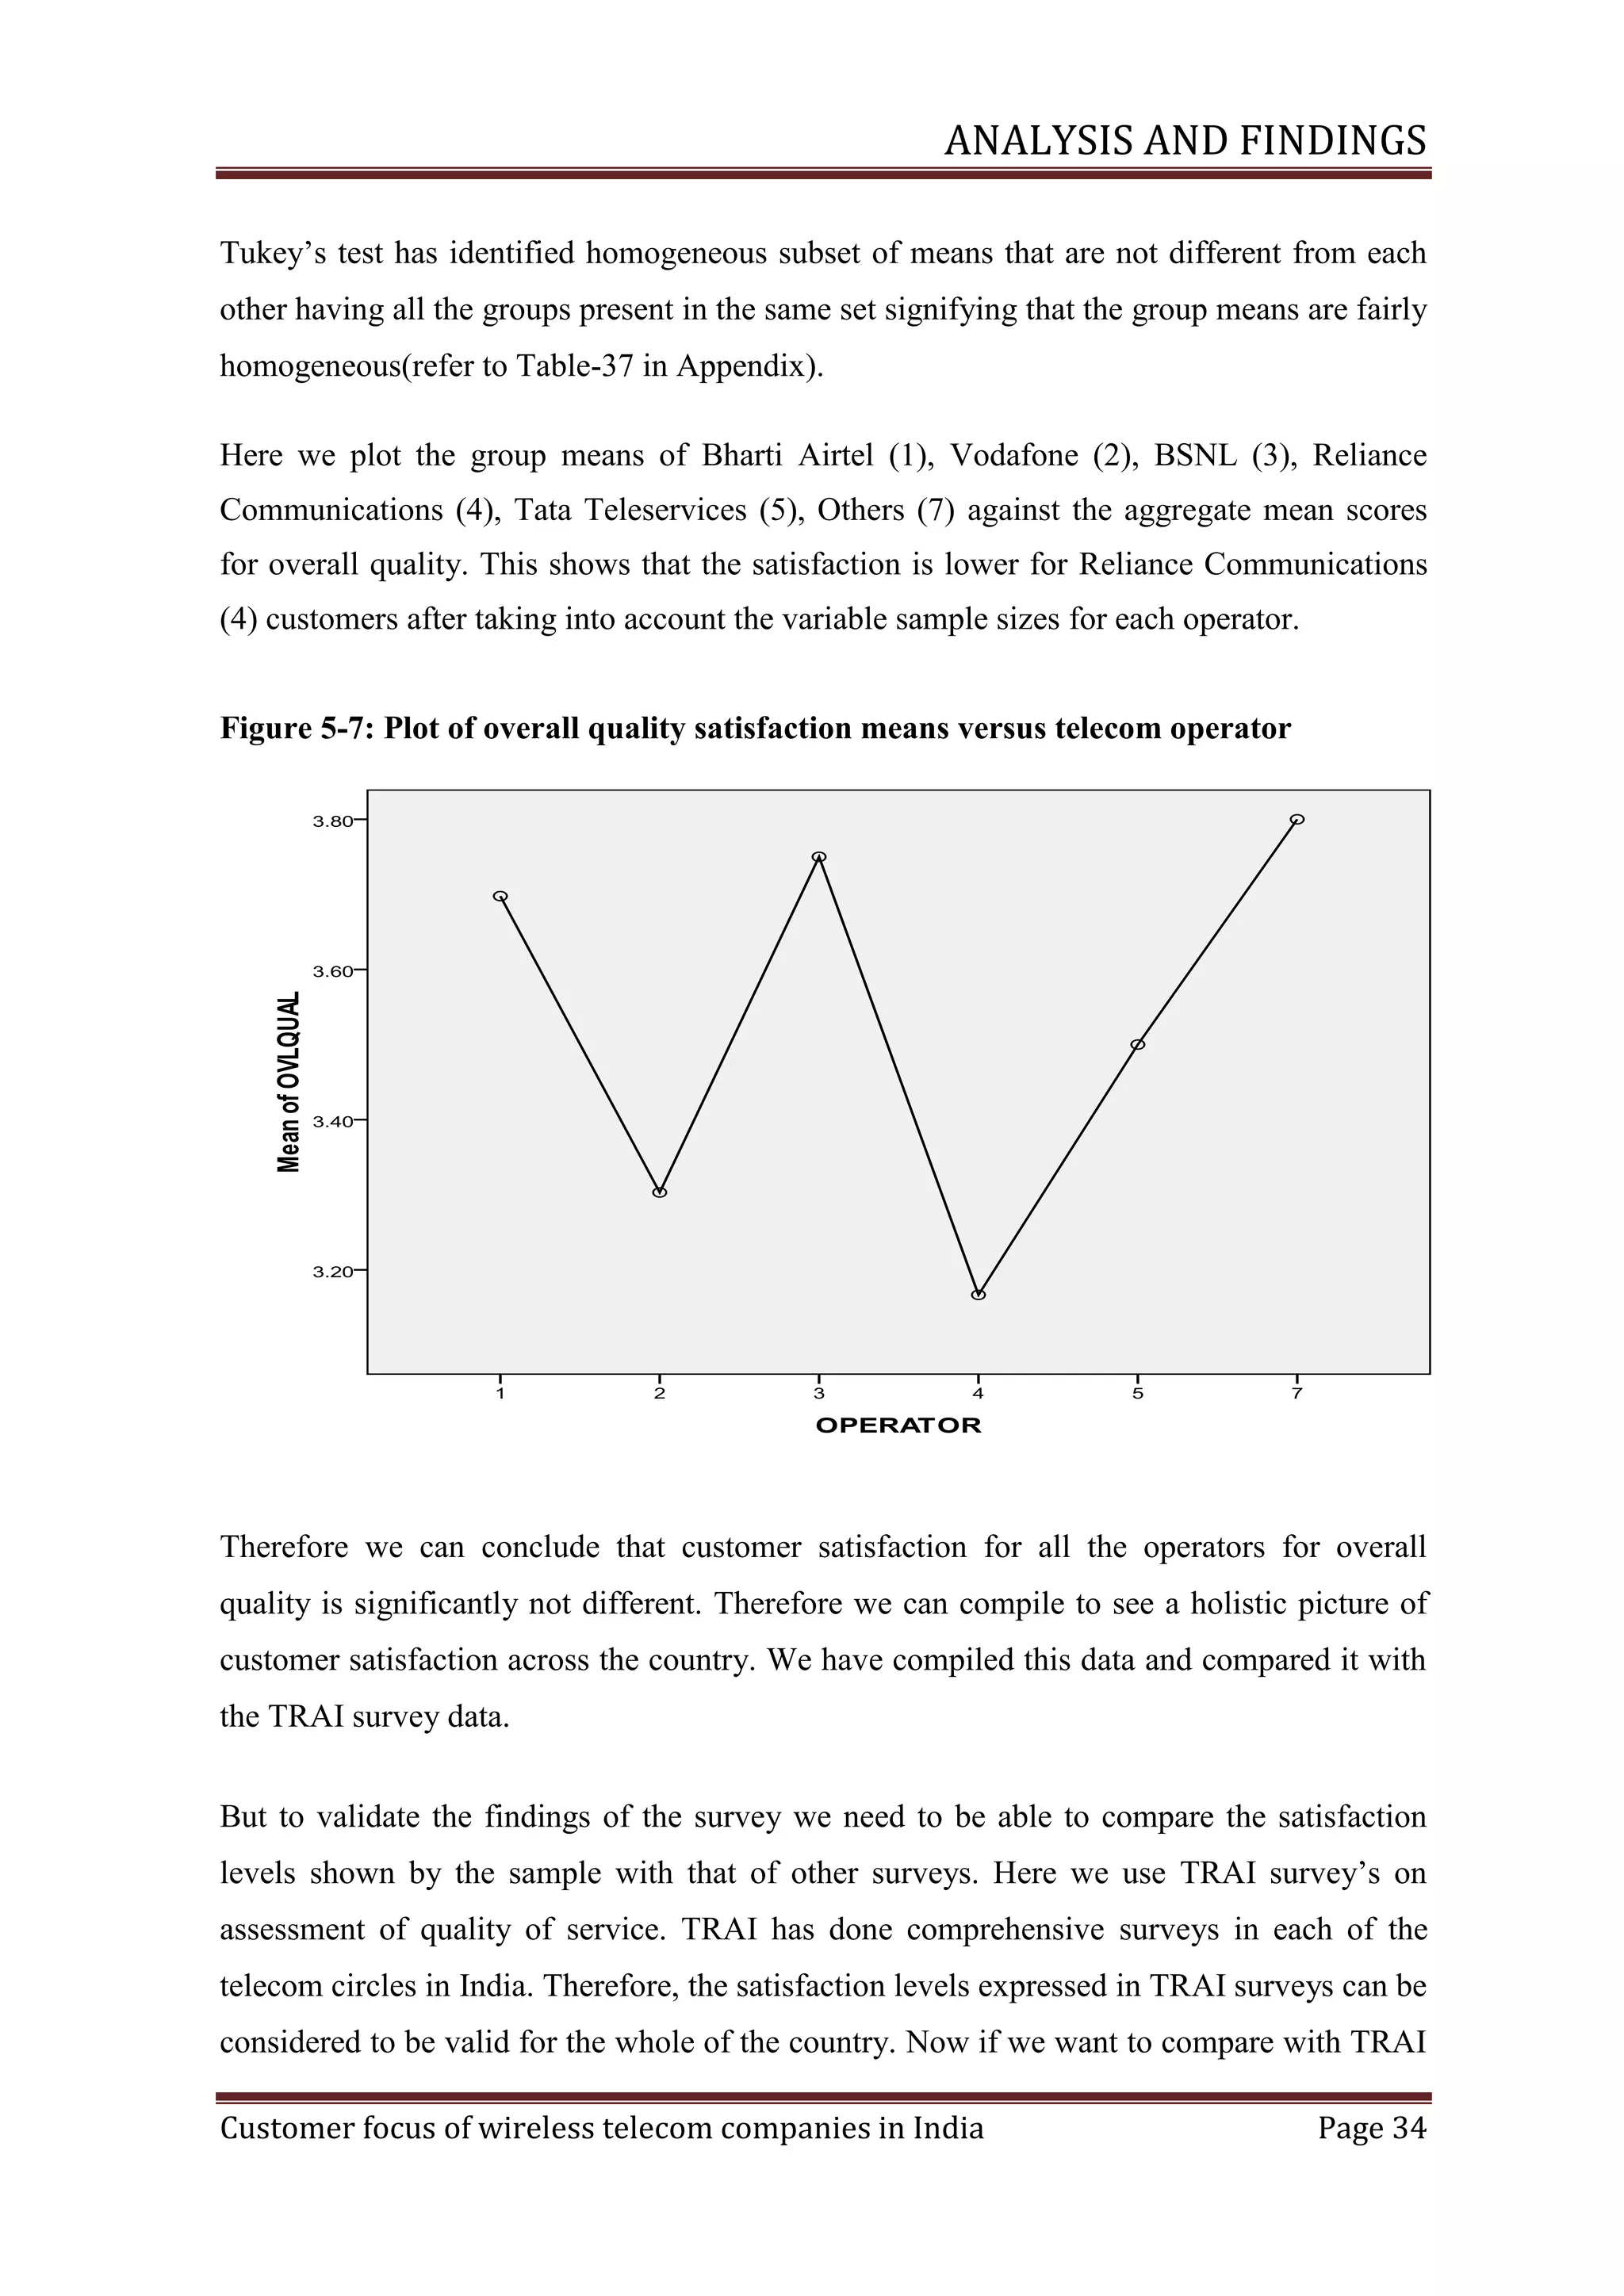
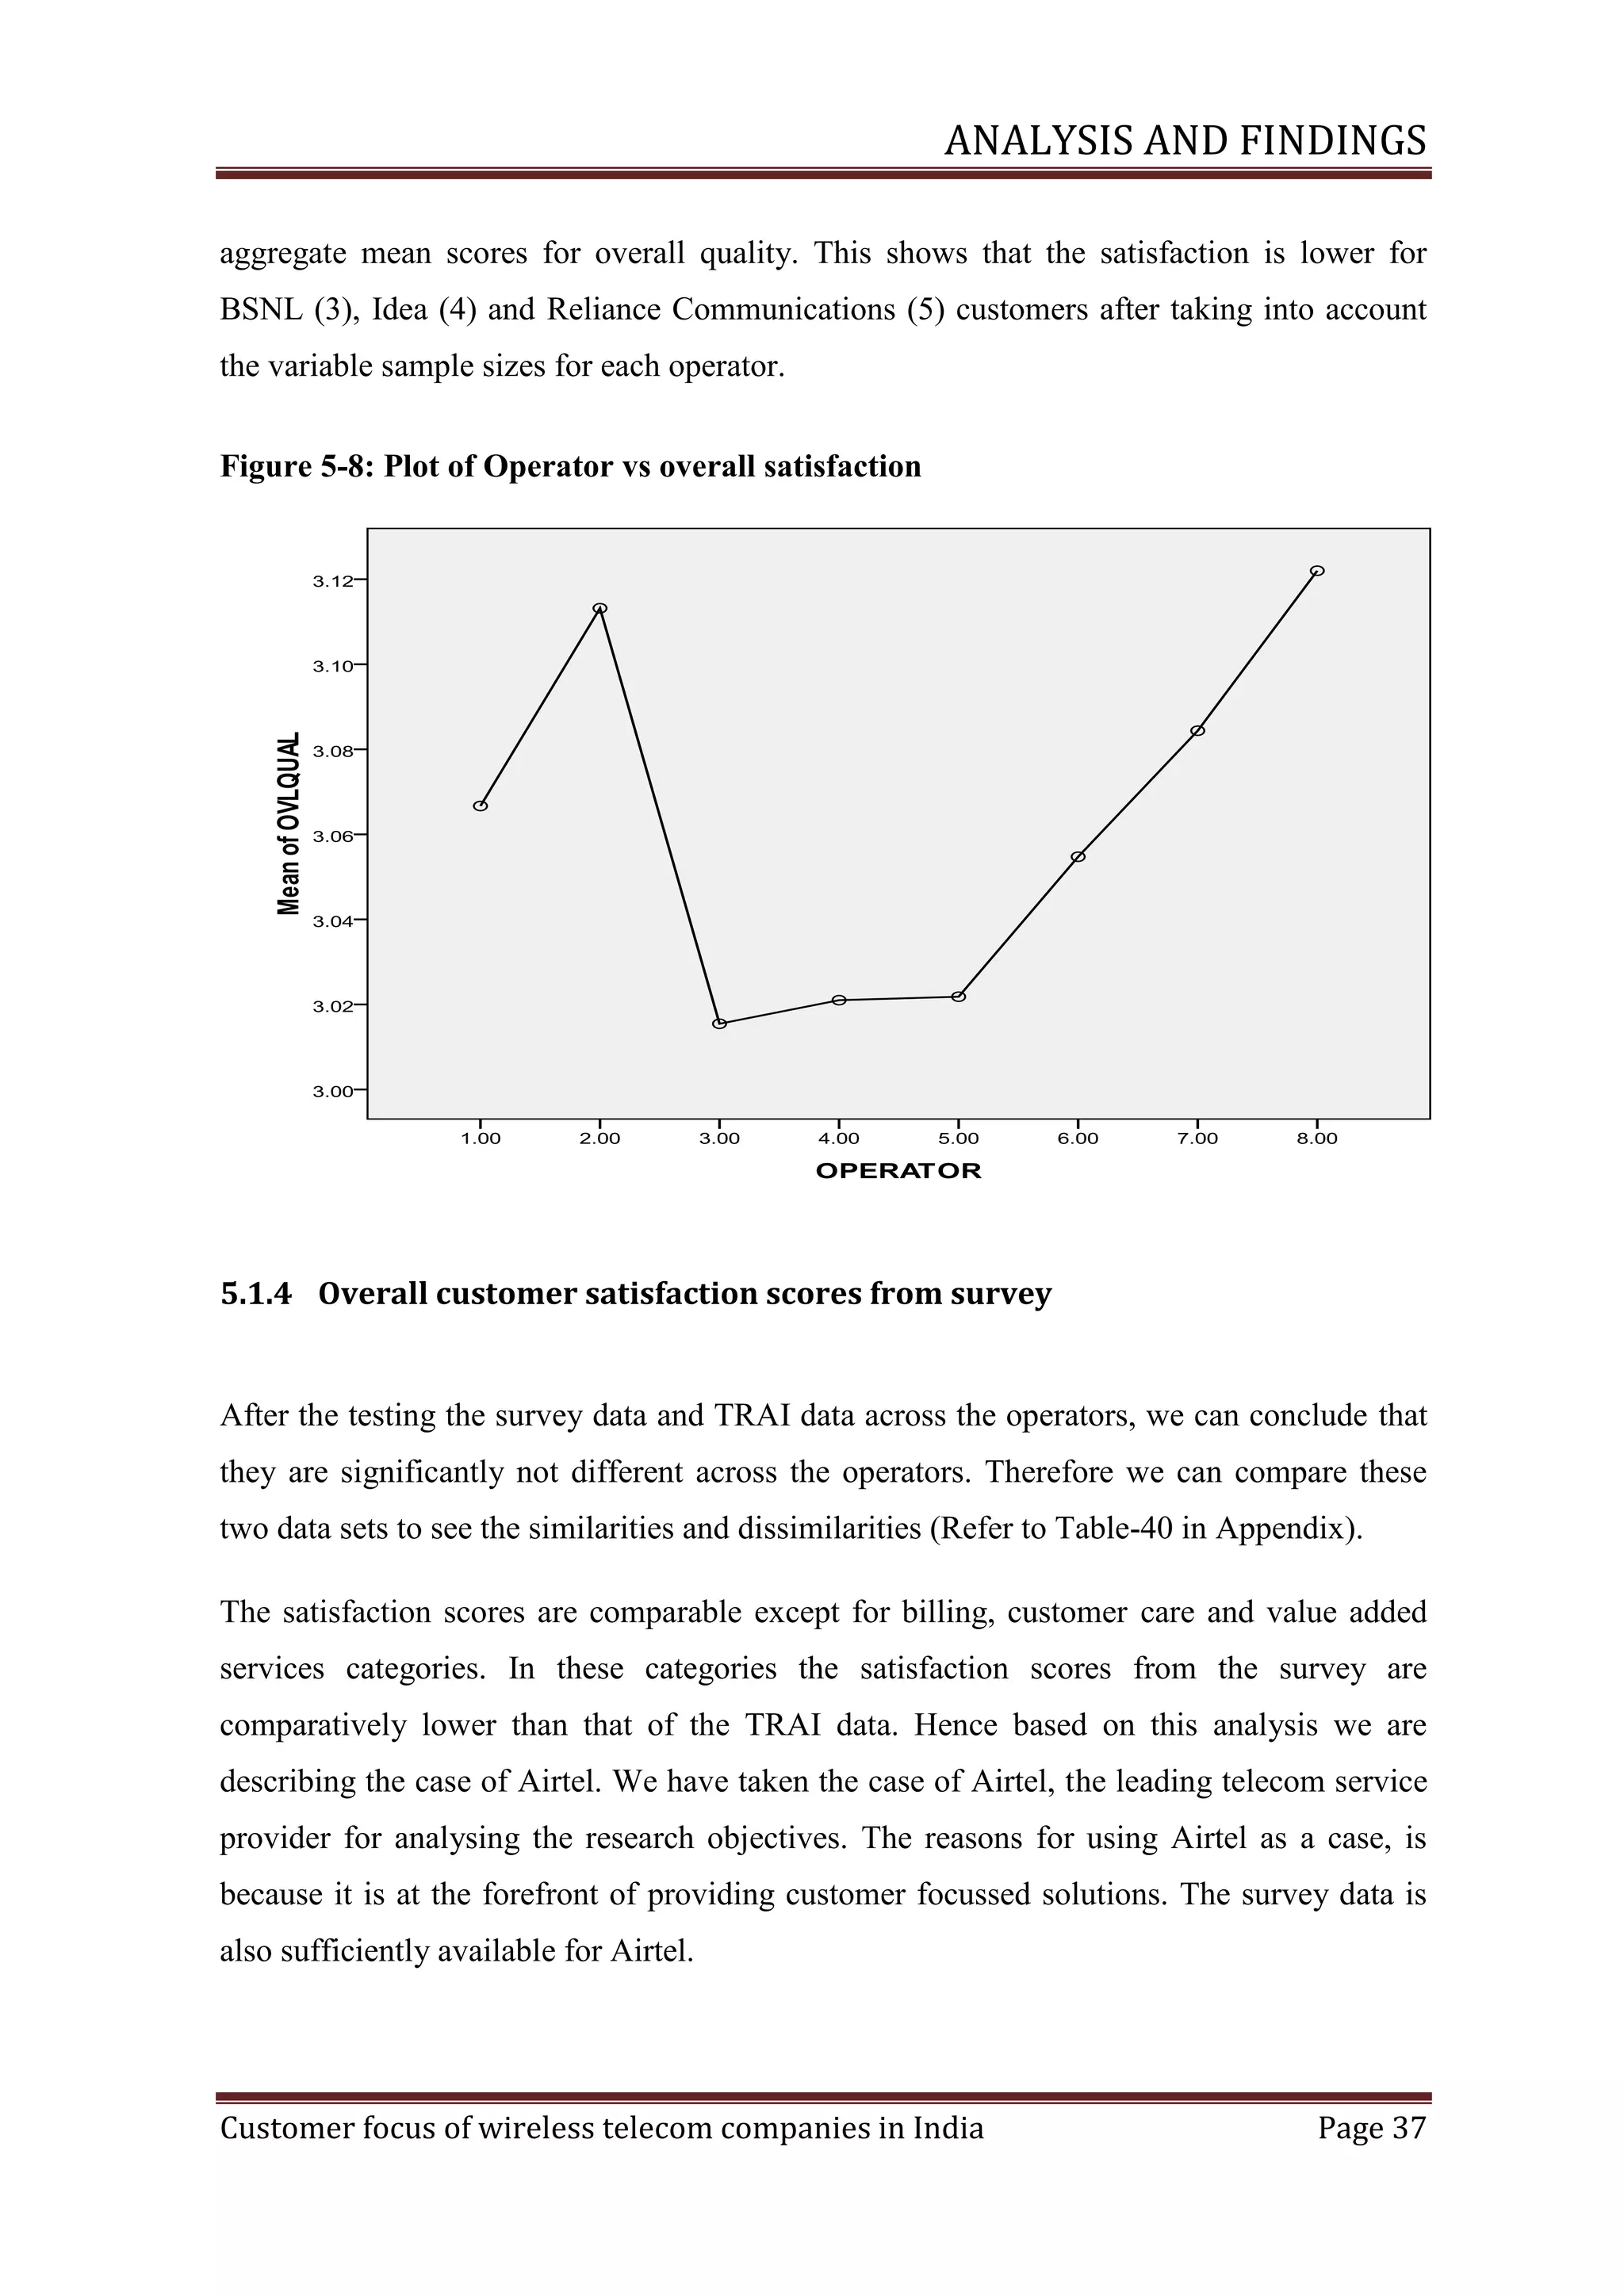
![INTRODUCTION
1 INTRODUCTION
1.1 Overview of wireless telecom industry
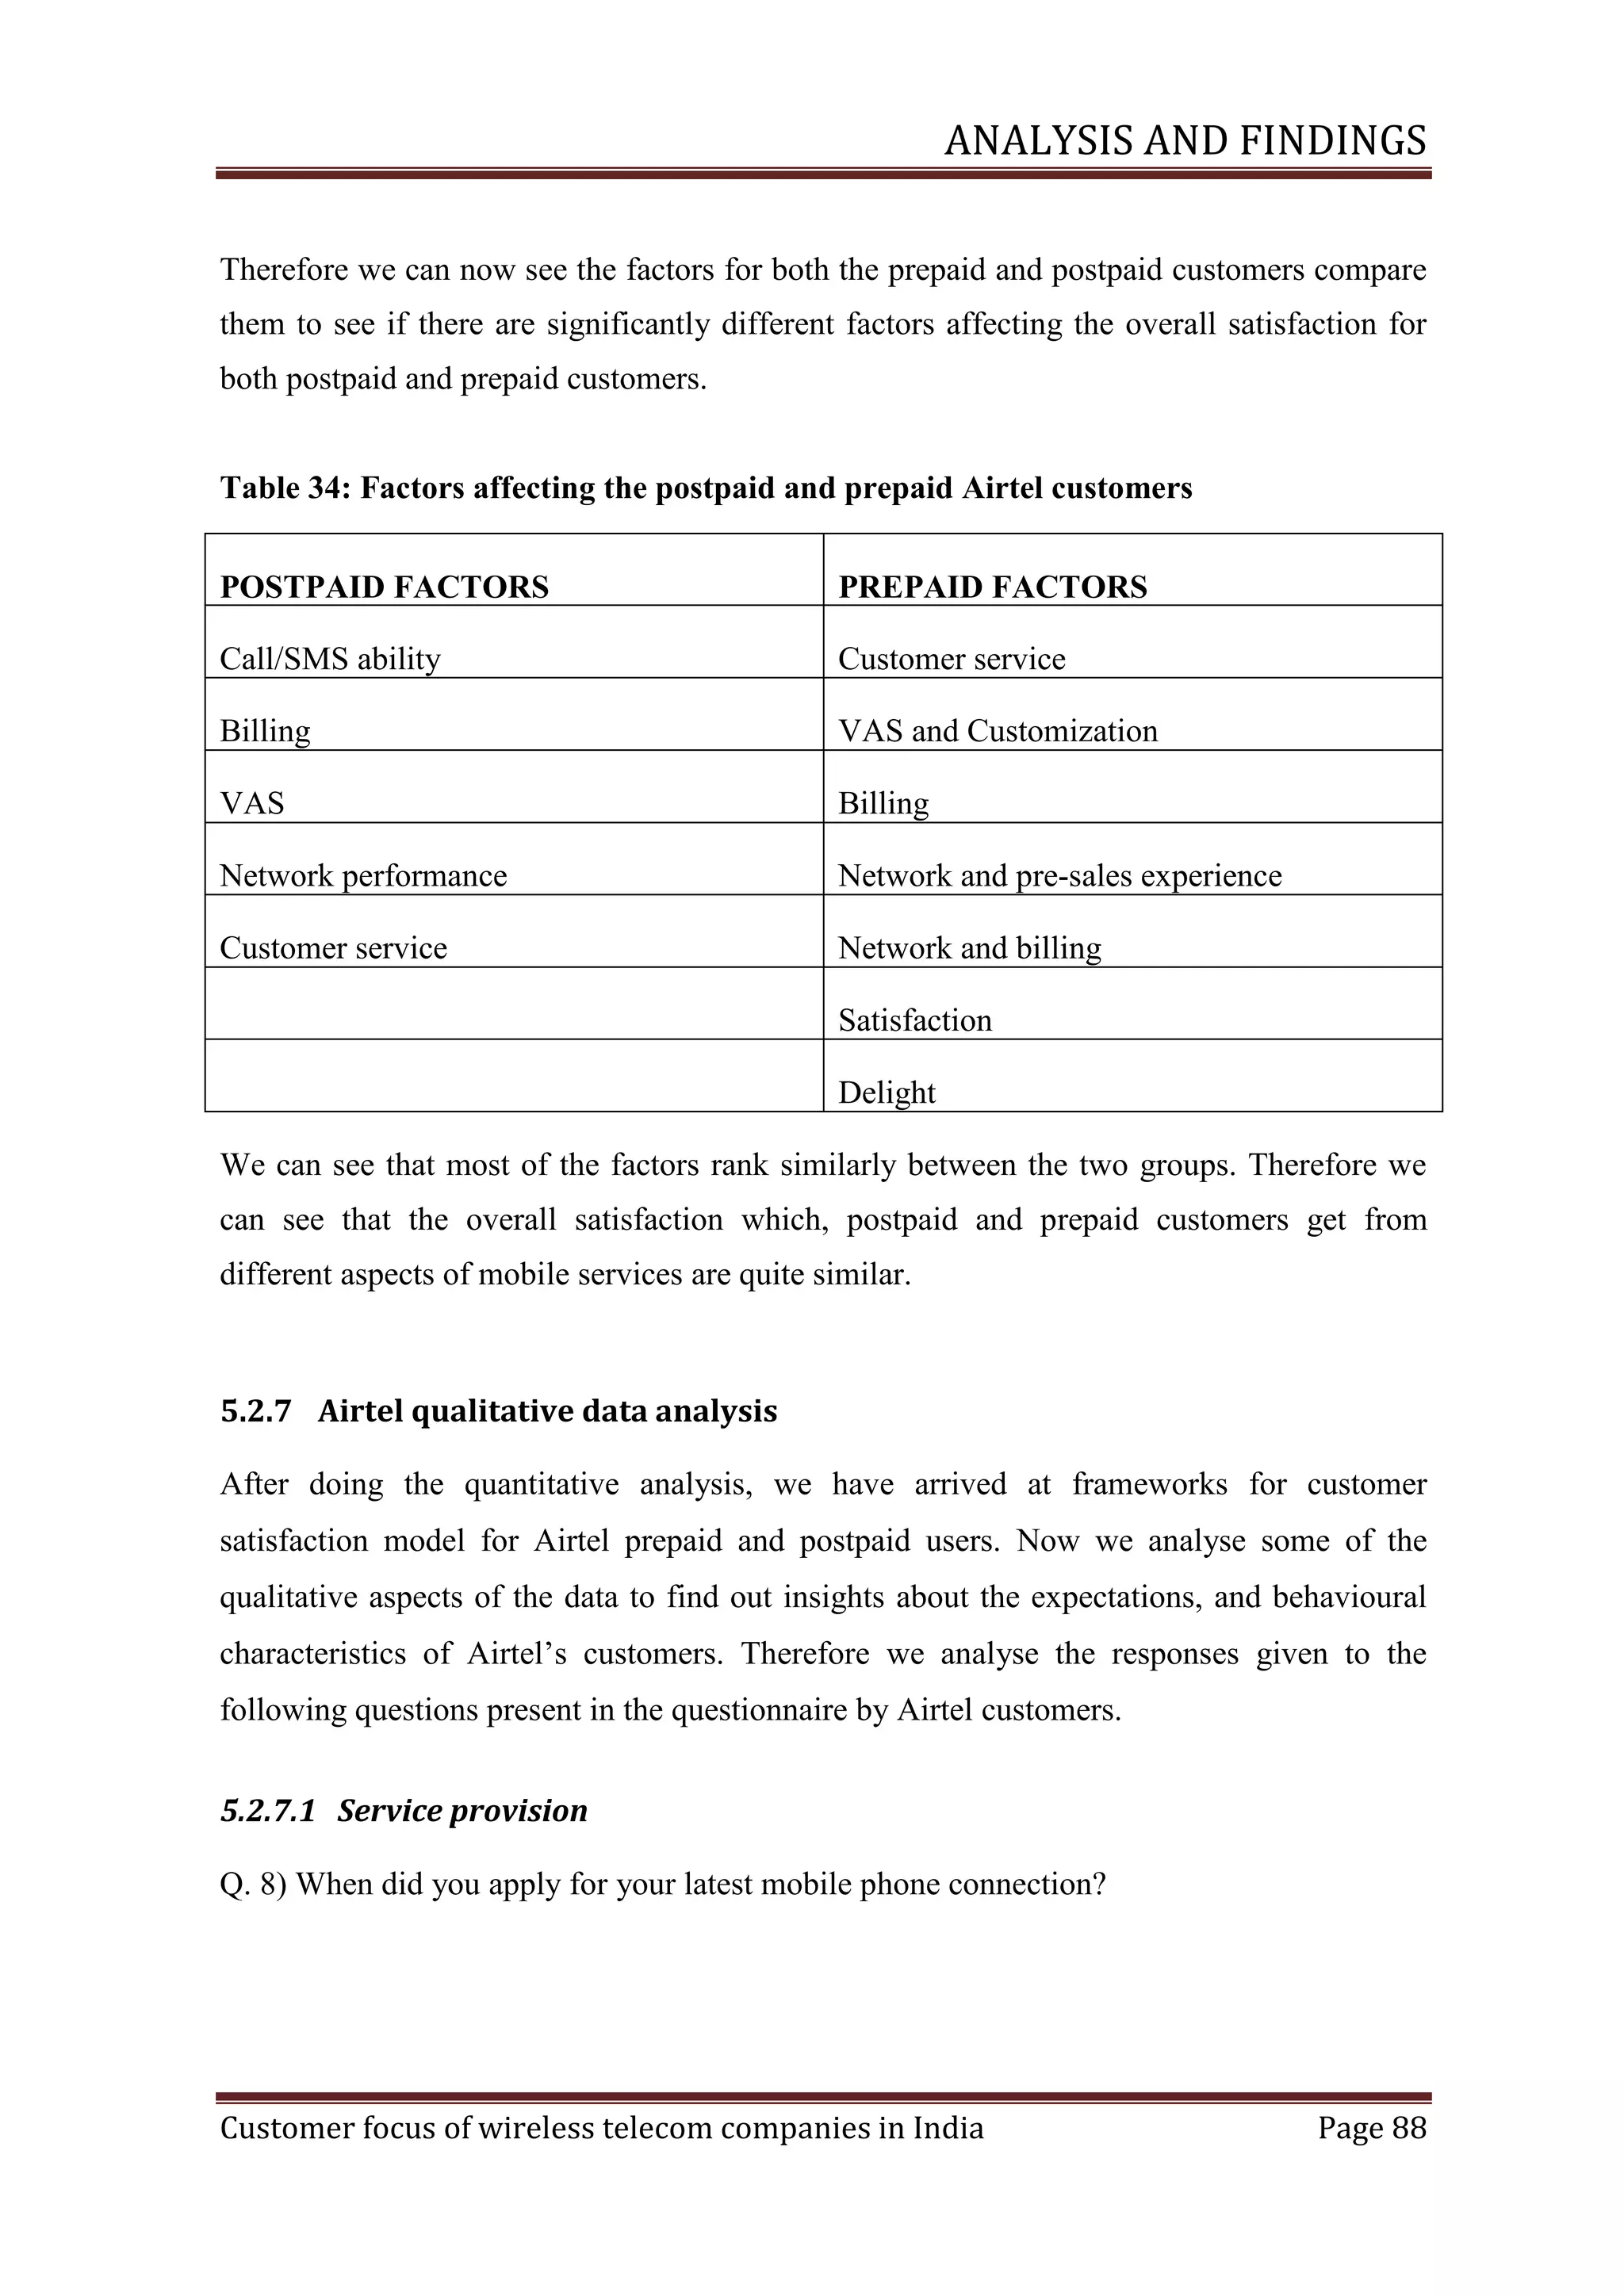
In the 21st century most organizations are trying to become more customer focussed. The
new breed of customer is very well informed. These customers are swapping passive roles
for much deeper involvement. ―Consumers‖ are becoming ―producers,‖ often creating
entertainment and advertising content for their peers, while demanding flexibility and
responsiveness from companies with whom they choose to do business. Therefore a lot of
importance is given by organizations, to the relationship they have with their customers.
This phenomenon is also observed in Indian organizations.
According to Reserve Bank of India‘s annual report 2008-09[21] the Indian services sector
has not only exhibited minimum growth of 9 per cent in the recent five years, but its share
in aggregate GDP has also increased to about 64.5 per cent. The current global economic
crisis being unprecedented in the recent history in terms of the magnitude of the impact as
well as the duration, the past resilience of the services sector could be tested in future.
While services sector‘s share in GDP improved marginally from 63.0 per cent in 2007-08 to
64.5 per cent during 2008-09, its relative contribution to GDP growth rate increased
significantly from 74.1 per cent to 88.2 per cent during the same period.
According to Mani[19] Communications is the fastest growing sector in India‘s economy.
No other sector of the economy has clocked such a rate of growth. The sector accounts for
about 4 per cent of GDP and the recent high rate of growth has contributed to about 11 per
cent of the growth in overall GDP of the country. Consequently, it is generally opined that a
revolution of sorts is taking place in the Indian telecom industry. One of the dimensions of
this growth taking place in the Indian telecom industry is the dominance of wireless
technology. The Indian telecom sector is now heavily dominated by wireless technologies,
which include cellular mobile and fixed wireless technologies. In fact, almost the entire
increase in the availability of telephones has been contributed by wireless technologies. The
ratio of wireless to wireline services is now almost five which is the highest in the history
of telecom industry in India. In fact what is interesting is that since 2005, the wireline
services have started falling in terms of sales. A number of factors explain this decrease in
Customer focus of wireless telecom companies in India
Page 1](https://image.slidesharecdn.com/satyafinalproject-140224205709-phpapp02/75/Satya-final-project-16-2048.jpg)
![INTRODUCTION
the popularity of fixed telephones, which has now become a worldwide trend. This heavy
reliance of wireless technologies, while extremely positive from the availability point of
view, has some implications for the diffusion of other services in the country.
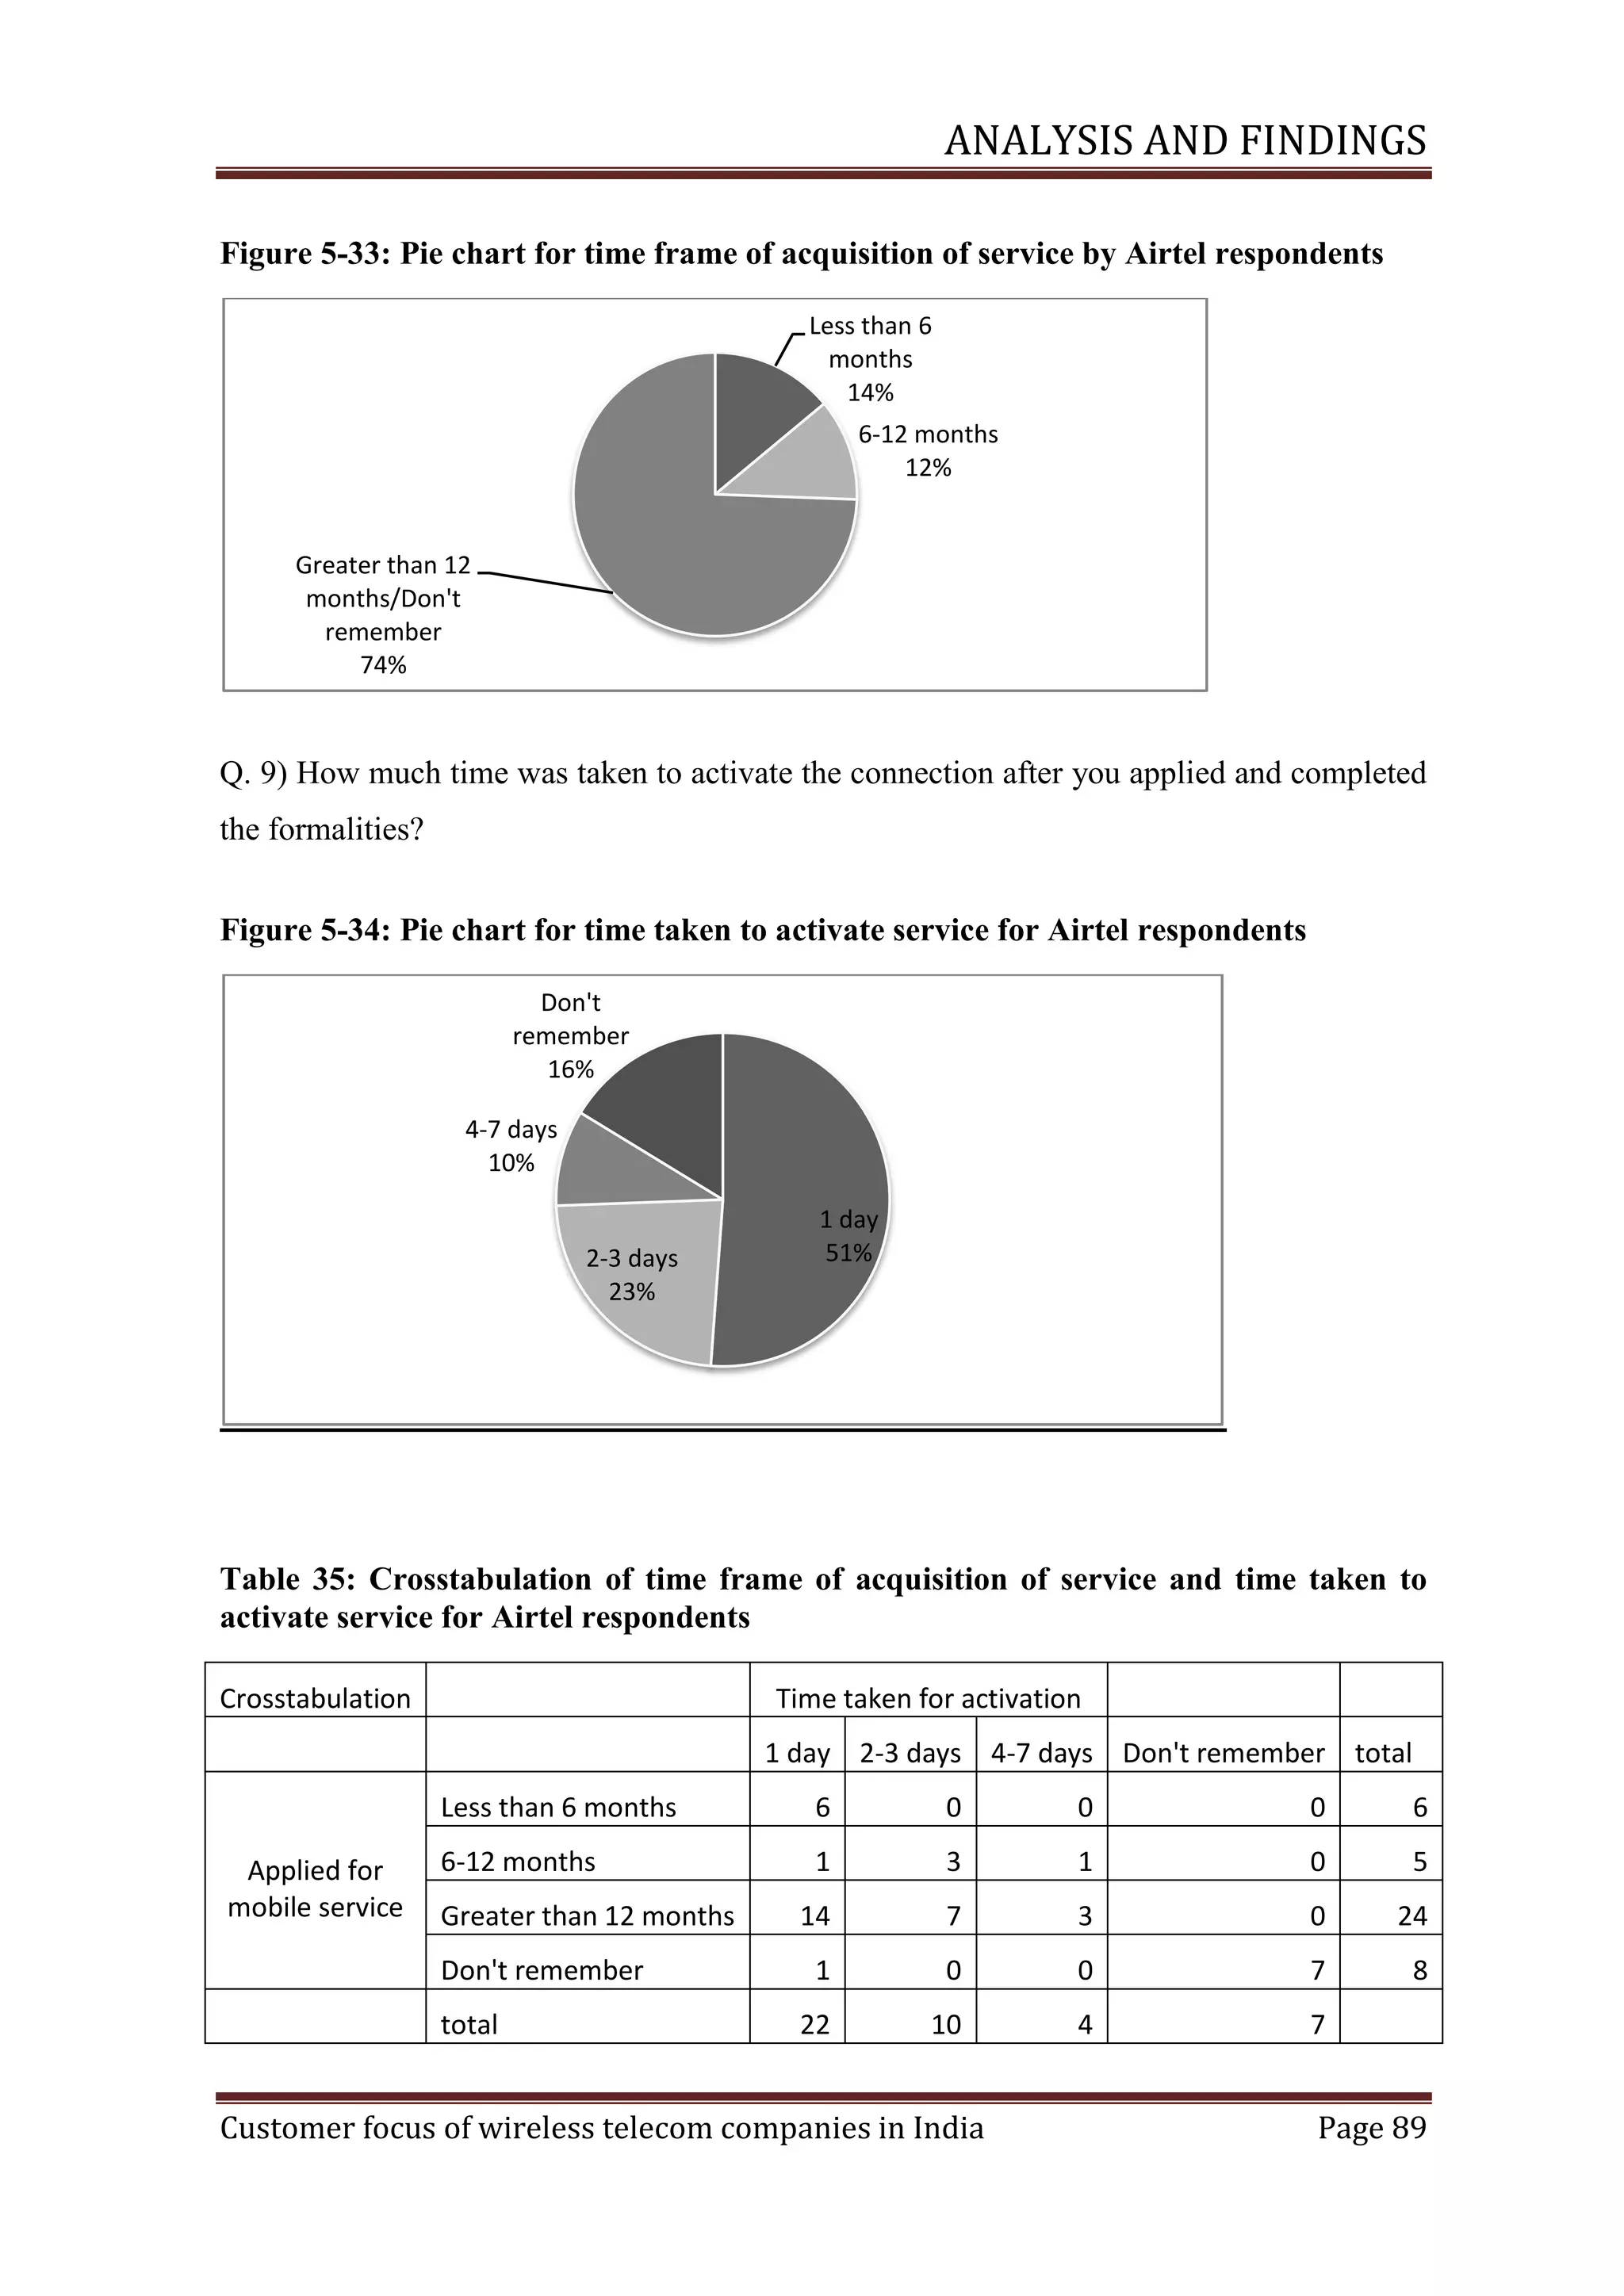
Total Wireless Subscribers in the country stand at 391.76 million[27]. This results in a
percentage growth of 12.93% during the quarter. Out of this the Urban Wireless
Subscribers are 282.05 Million (72%) and Rural Wireless Subscribers 109.71 Million
(28%); the GSM Subscribers are 297.26 Million (75.88%) and CDMA Subscribers 94.50
Million (24.12%). This leads us to make the following observation that rate of growth in
mobile subscriber base has been substantially high.
Some of the characteristics exhibited by the wireless telecom industry in India are the
following:
The cost of ownership of mobile services is very low. Therefore the customer base
of wireless telecom services is increasing at such a fast pace.
The need for connection and communication with others helps in fulfilling
emotional needs.
The use of communication services is shared by all households, compared only by
services like utilities, banking and other financial services.
On top of this wireless telecom services also create and enhance a lot of
individualism leading to attraction of these services.
The wireless telecom sector is dynamic and experiencing explosive growth. It is having a
lot of opportunities as well as facing a lot of threats. Mobile number portability, where a
subscriber would be able to shift from one operator to another without changing his/her
number, is such a disruptive threat. Therefore the telecom operators foreseeing the future
where they will have to compete on brand value and service offerings have to tighten their
belts as the switching costs for customers will dramatically lower.
Another interesting development has been the advent of mobile virtual network operators
(MVNO). These companies buy airtime and SIM cards in bulk from telecom operators and
sell them under their own brand. It is expected that the virtual operators will help shore up
Customer focus of wireless telecom companies in India
Page 2](https://image.slidesharecdn.com/satyafinalproject-140224205709-phpapp02/75/Satya-final-project-17-2048.jpg)
![INTRODUCTION
the fallen Average Revenue Per User‘s (ARPU) from Rs 450 in 2000 to about Rs 200
today. They will help the new telecom licensees to acquire customers faster, as well as
established licensees in better utilisation of resources for netting higher revenues.
In this dynamic and regulated environment, telecom service providers have a very
important goal in acquiring new customers and retaining loyal customers. They also have to
do this in a fast manner, as the market is growing at such a scorching pace that every month
world records are being created in adding new subscribers. While this has helped in
increasing the tele-density of the country, consequently helping people network and
communicate much faster, cheaper and effectively, whether the quality of service provided
has improved, or at least remained at a desired level is questionable. When more
subscribers are added on a daily basis, there should be capacity to enable services with the
desired level of quality.
In this context, marketing philosophy is fundamentally based upon the satisfaction of
customer needs and achievement of organisational goals. Essentially, it has always been an
inclusive aspect of the marketing orientation that there should be customer care and
satisfaction in order to meet customer needs.
Therefore the question is, to what degree telecom service providers are customer oriented to
meet customer‘s satisfaction needs. For this we need to find out the present degree of
customer satisfaction for telecom service providers. According to Telecom Regulatory
Authority of India (TRAI) survey reports on customer perception of service provided27], the
overall satisfaction scores of all the telecom service providers in all the telecom circles
remain below the acceptable benchmark of TRAI. This clearly brings out the fact that the
service providers are yet to achieve the desired level of quality for providing customer
satisfaction. But there has been very little research in collating the survey reports and seeing
a holistic picture for a service provider over a period of time. There is also sparse literature
available to find factors affecting the Indian telecom customer‘s satisfaction. Based on
these findings, the Indian telecom customer‘s requirements could be established.
Many researchers have found the effective application of Customer Relationship
Management (CRM) in the telecom sector in helping to get a complete view of the
Customer focus of wireless telecom companies in India
Page 3](https://image.slidesharecdn.com/satyafinalproject-140224205709-phpapp02/75/Satya-final-project-18-2048.jpg)

![LITERATURE REVIEW
2 LITERATURE REVIEW
The literature review section presents a comprehensive summary of the relevant knowledge
present in the area of customer focus of telecom service providers.
2.1 Customer focus
We have analysed the common and widely accepted definitions of customer focus and
present a comprehensive definition for customer focus:
It is an organizational orientation [3] towards providing excellent customer service [5] and
Satisfy needs of potential and actual customers[3].
Follow customer specifications [12].
Greatly value customer relationships [5].
Involve customers in product development and service development [5].
Build trust and maintain integrity and strategic partnerships with customers [5].
Structure the company so every tier supports the person providing the service to the
customer [5].
Move beyond the notions of customer satisfaction and loyalty and encourage
customers to be advocates for a product or service [5].
Treat colleagues like customers by building obliging, responsive and respectful
relationships [5].
2.2 Characteristics of customer-focused organizations
Through the analysis of literature, we have found the following characteristics which a
customer focussed company should possess.
They always interact with customers and seek feedback from them. They analyse
feedback and use the relevant information to change their internal processes and
respond swiftly [18].
Customer focus of wireless telecom companies in India
Page 7](https://image.slidesharecdn.com/satyafinalproject-140224205709-phpapp02/75/Satya-final-project-23-2048.jpg)
![LITERATURE REVIEW
They take customer care seriously by providing toll-free number and help desks so
that they get valuable immediate feedback. They try to help fix problems within an
acceptable timeframe [18].
They value customer satisfaction metrics and results on par with financial metrics
[18]
.
Through the review of literature, we have been able to understand that for a telecom service
provider to be customer focussed, it has to be able to satisfy the needs of its potential and
actual customers by providing excellent customer service. To satisfy the needs of
customers, the service provider has to constantly monitor and receive feedback from
customers. Using customer satisfaction results, the service provider receives feedback about
its services and consequently feeds the information to its process to improve service quality
and satisfy customers.
Therefore the need for critical review of customer satisfaction has to be there so as to
understand how a telecom service provider can satisfy its customers.
2.3 Customer satisfaction
Through the analysis of current literature on customer satisfaction we arrive at the
following definition of customer satisfaction.
Customer satisfaction is defined as a person‘s feelings of pleasure or disappointment
resulting from the comparison of a product/service‘s perceived performance in relation with
his or her expectation [2].
Hence for telecom service providers to achieve customer satisfaction, researchers
recommend the following action:
Mobile carriers must focus on service quality and offer customer-oriented services
to heighten customer satisfaction [13].
Customer satisfaction can be improved by the use of improving service quality and
perceived value [16].
Customer focus of wireless telecom companies in India
Page 8](https://image.slidesharecdn.com/satyafinalproject-140224205709-phpapp02/75/Satya-final-project-24-2048.jpg)
![LITERATURE REVIEW
Mobile service providers must change either customer perception or service quality
to improve customer satisfaction [9].
Acceptance and satisfaction of value added services is heavily influenced on quality
of service experienced by the user [14].
Therefore telecom service providers should look to improve service quality. Researchers
have empirically found out the factors affecting service quality so that service providers can
act decisively. Call quality, value-added services, and customer support were among the
important factors having significant impact on service quality.
The improvement in service quality by making an impact on improving the factors affecting
service quality will lead to improvement in customer satisfaction levels. This will provide
lots of benefits. A high customer satisfaction level heightens customer loyalty and prevents
customer churn, lowers customers‘ price sensitivity, reduces the costs of failed marketing
and of new customer creation, reduces operating costs due to customer number increases,
improves the effectiveness of advertising, and enhances business reputation [1].
Researchers give another way of improving customer satisfaction, which is by keeping a tab
on the early warning signals for the degree of customer retention. There are two factors
which provide us such early warning signals. They are the customer assessment about the
prices charged being good and fair (compared against competitors), and, the customer
perception of the functional benefit of mobile communications services [11].
2.4 Customer satisfaction tests
From present understanding of customer satisfaction we can infer that the telecom operators
have to look at customer satisfaction as a metric to provide the perception of the functional
benefits being enjoyed by the customer. This will give the telecom operators an indication
of what the customer is thinking about them.
This leads us to arrive at user perceptions as a means of improving customer satisfaction.
User perceptions are psychological constructs that must be measured indirectly using
psychological instruments
[14]
. There are two major approaches for the measurement of
Customer focus of wireless telecom companies in India
Page 9](https://image.slidesharecdn.com/satyafinalproject-140224205709-phpapp02/75/Satya-final-project-25-2048.jpg)
![LITERATURE REVIEW
quality of service from the user‘s point of view: opinion polls and customer satisfaction
surveys. Customer satisfaction tests are suggested to be closely related to usability testing.
Usability testing is defined as techniques to collect empirical data while observing
representative end users using the product itself [22]. The main difference between usability
testing and customer satisfaction tests is the focus. Customer satisfactions tests analyze the
quality of service as a whole.
2.5 TRAI’s quality of service initiative
In the Indian telecom sector context, the telecom regulator TRAI has come up with
regulation named, ―Regulation on Quality of Service of Basic and Cellular Mobile
Telephone Services, 2005‖
[26]
to lay-down the standards of quality of service to be
provided by the service providers. The regulation also states about the regular testing of
QoS performance and assessment of customer satisfaction with QoS. Hence TRAI regularly
undertakes customer satisfaction tests for the industry. This provides valuable information
to service providers about customer perception of QoS delivered. According to TRAI [26],
Quality of service is the main indicator of the performance of a telephone network and of
the degree to which the network conforms to the stipulated norms. The subscriber‘s
perception of the QoS is determined by a number of performance factors. The purpose of
laying down Quality of Service Parameters is to:
1. Create conditions for consumer satisfaction by making known the quality of service
which the service provider is required to provide and the user has a right to expect.
2. Measure the Quality of Service provided by the Service Providers from time to time
and to compare them with the norms so as to assess the level of performance.
3. Generally protect the interests of consumers of telecommunication services.
Therefore we have been able to arrive at the need for customer satisfaction test to be
customer focussed. Hence the service providers should be able to continuously monitor
customer satisfaction levels, satisfy the customers and be customer focussed. But to retain
these satisfied customers, service providers have to make these customers loyal by building
Customer focus of wireless telecom companies in India
Page 10](https://image.slidesharecdn.com/satyafinalproject-140224205709-phpapp02/75/Satya-final-project-26-2048.jpg)
![LITERATURE REVIEW
longer and stronger relationships. By building relationships with customers, service
provider takes the level of trust and commitment between them a notch higher. The service
provider will be able to build a switching barrier which is above monetary benefits and
consists of emotional benefits. Researchers have shown that CRM is used for building
relationships and improving switching barrier. Switching barrier is the hurdle which
customers would have to jump to switch to a different service provider. The factors
significantly affecting the switching barrier appeared to be switching costs such as loss cost,
move-in cost and interpersonal relationships. Hence mobile carriers must develop a threepronged strategy of developing customer reward programs that compensate customers,
increasing the cost of switching and developing and carrying out relationship-oriented
marketing to enhance interpersonal relationship with customers[13].
2.6 Need of the hour: Customer Relationship Management
From the review of literature, we have been able to arrive at the following definition for
CRM.
It consists of the processes a company uses to track and organize its contacts with its
current and prospective customers. Hence it is not just about technology but about strategy
and process [7].
Researchers say that CRM gives the complete information and provides a holistic view of
the customer. Some of the views suggested by researchers are:
CRM is an attitude that needs to pervade the company, but it needs a solid
foundation of knowledge of customers [29].
With the help of enterprise applications like CRM the telecom service providers are
now able to obtain complete customer information. They are now able to have a
unified view of the customer so that all the interactions of different departments and
services of the company with the customer are at the dashboard [4].
Therefore the value provided by CRM is:
Customer focus of wireless telecom companies in India
Page 11](https://image.slidesharecdn.com/satyafinalproject-140224205709-phpapp02/75/Satya-final-project-27-2048.jpg)
![LITERATURE REVIEW
The knowledge about customers and their interactions with the company facilitates
better business decisions and encourages customer loyalty and retention [29].
Telecom service providers have been able to streamline their business processes to
reduce variability, improve of quality of service and hence lead to positive financial
results for the company. Through the use of better technology companies can handle
more in less time, be more accurate, and hence lead to more quality services for the
customer [4].
In this way the company can provide more value to the customer, more satisfaction
thereby increasing customer loyalty leading to retention and revenues [4].
Online CRM provide online billing, online repair, ordering of routers and private
branch exchanges, provide access to consultants online. This has helped the
customers in faster access to bills, faster resolution of bills, easier access to services
and provisions. This ultimately leads to richer customer interaction and higher
customer satisfaction [28].
Analytical CRM solutions can perform precise market segmentation, trending and
modelling, customer analysis and reporting using centralized customer data from
disparate sources. By doing this telecom service providers will be able to understand
what products are helping to retain the customers and which ones are experiencing a
loss of customers [6].
Hence we can see the value provided by CRM in satisfying customers and building a
relationship with them. But literature also has failures stories about the implementation of
solutions related with CRM.
Literature says that most telecom companies haven‘t been able to understand what CRM
stands for. Most of them have thought of it as a technological solution and not as a change
in business processes. So they have not been able to focus on getting their CRM strategy
right [17]. According to analysts most CRM initiatives have disappointed telecom companies
because they are too focused on management and have done little to improve the customer
relationship experience. Because of the detoured focus on management, carriers don't
integrate CRM with all touch-points in the customer lifecycle, miss out key opportunities to
analyze and improve on the customer experience, and overlook the importance of sharing
customer data across departments and even back-office application silos. As a result, there
Customer focus of wireless telecom companies in India
Page 12](https://image.slidesharecdn.com/satyafinalproject-140224205709-phpapp02/75/Satya-final-project-28-2048.jpg)

![THEORETICAL BACKGROUND
3 THEORETICAL BACKGROUND
The theoretical background discusses about the theory of analytical tools used for
explaining the concept of customer focus and customer satisfaction, which have been used
in analysis and findings of the study.
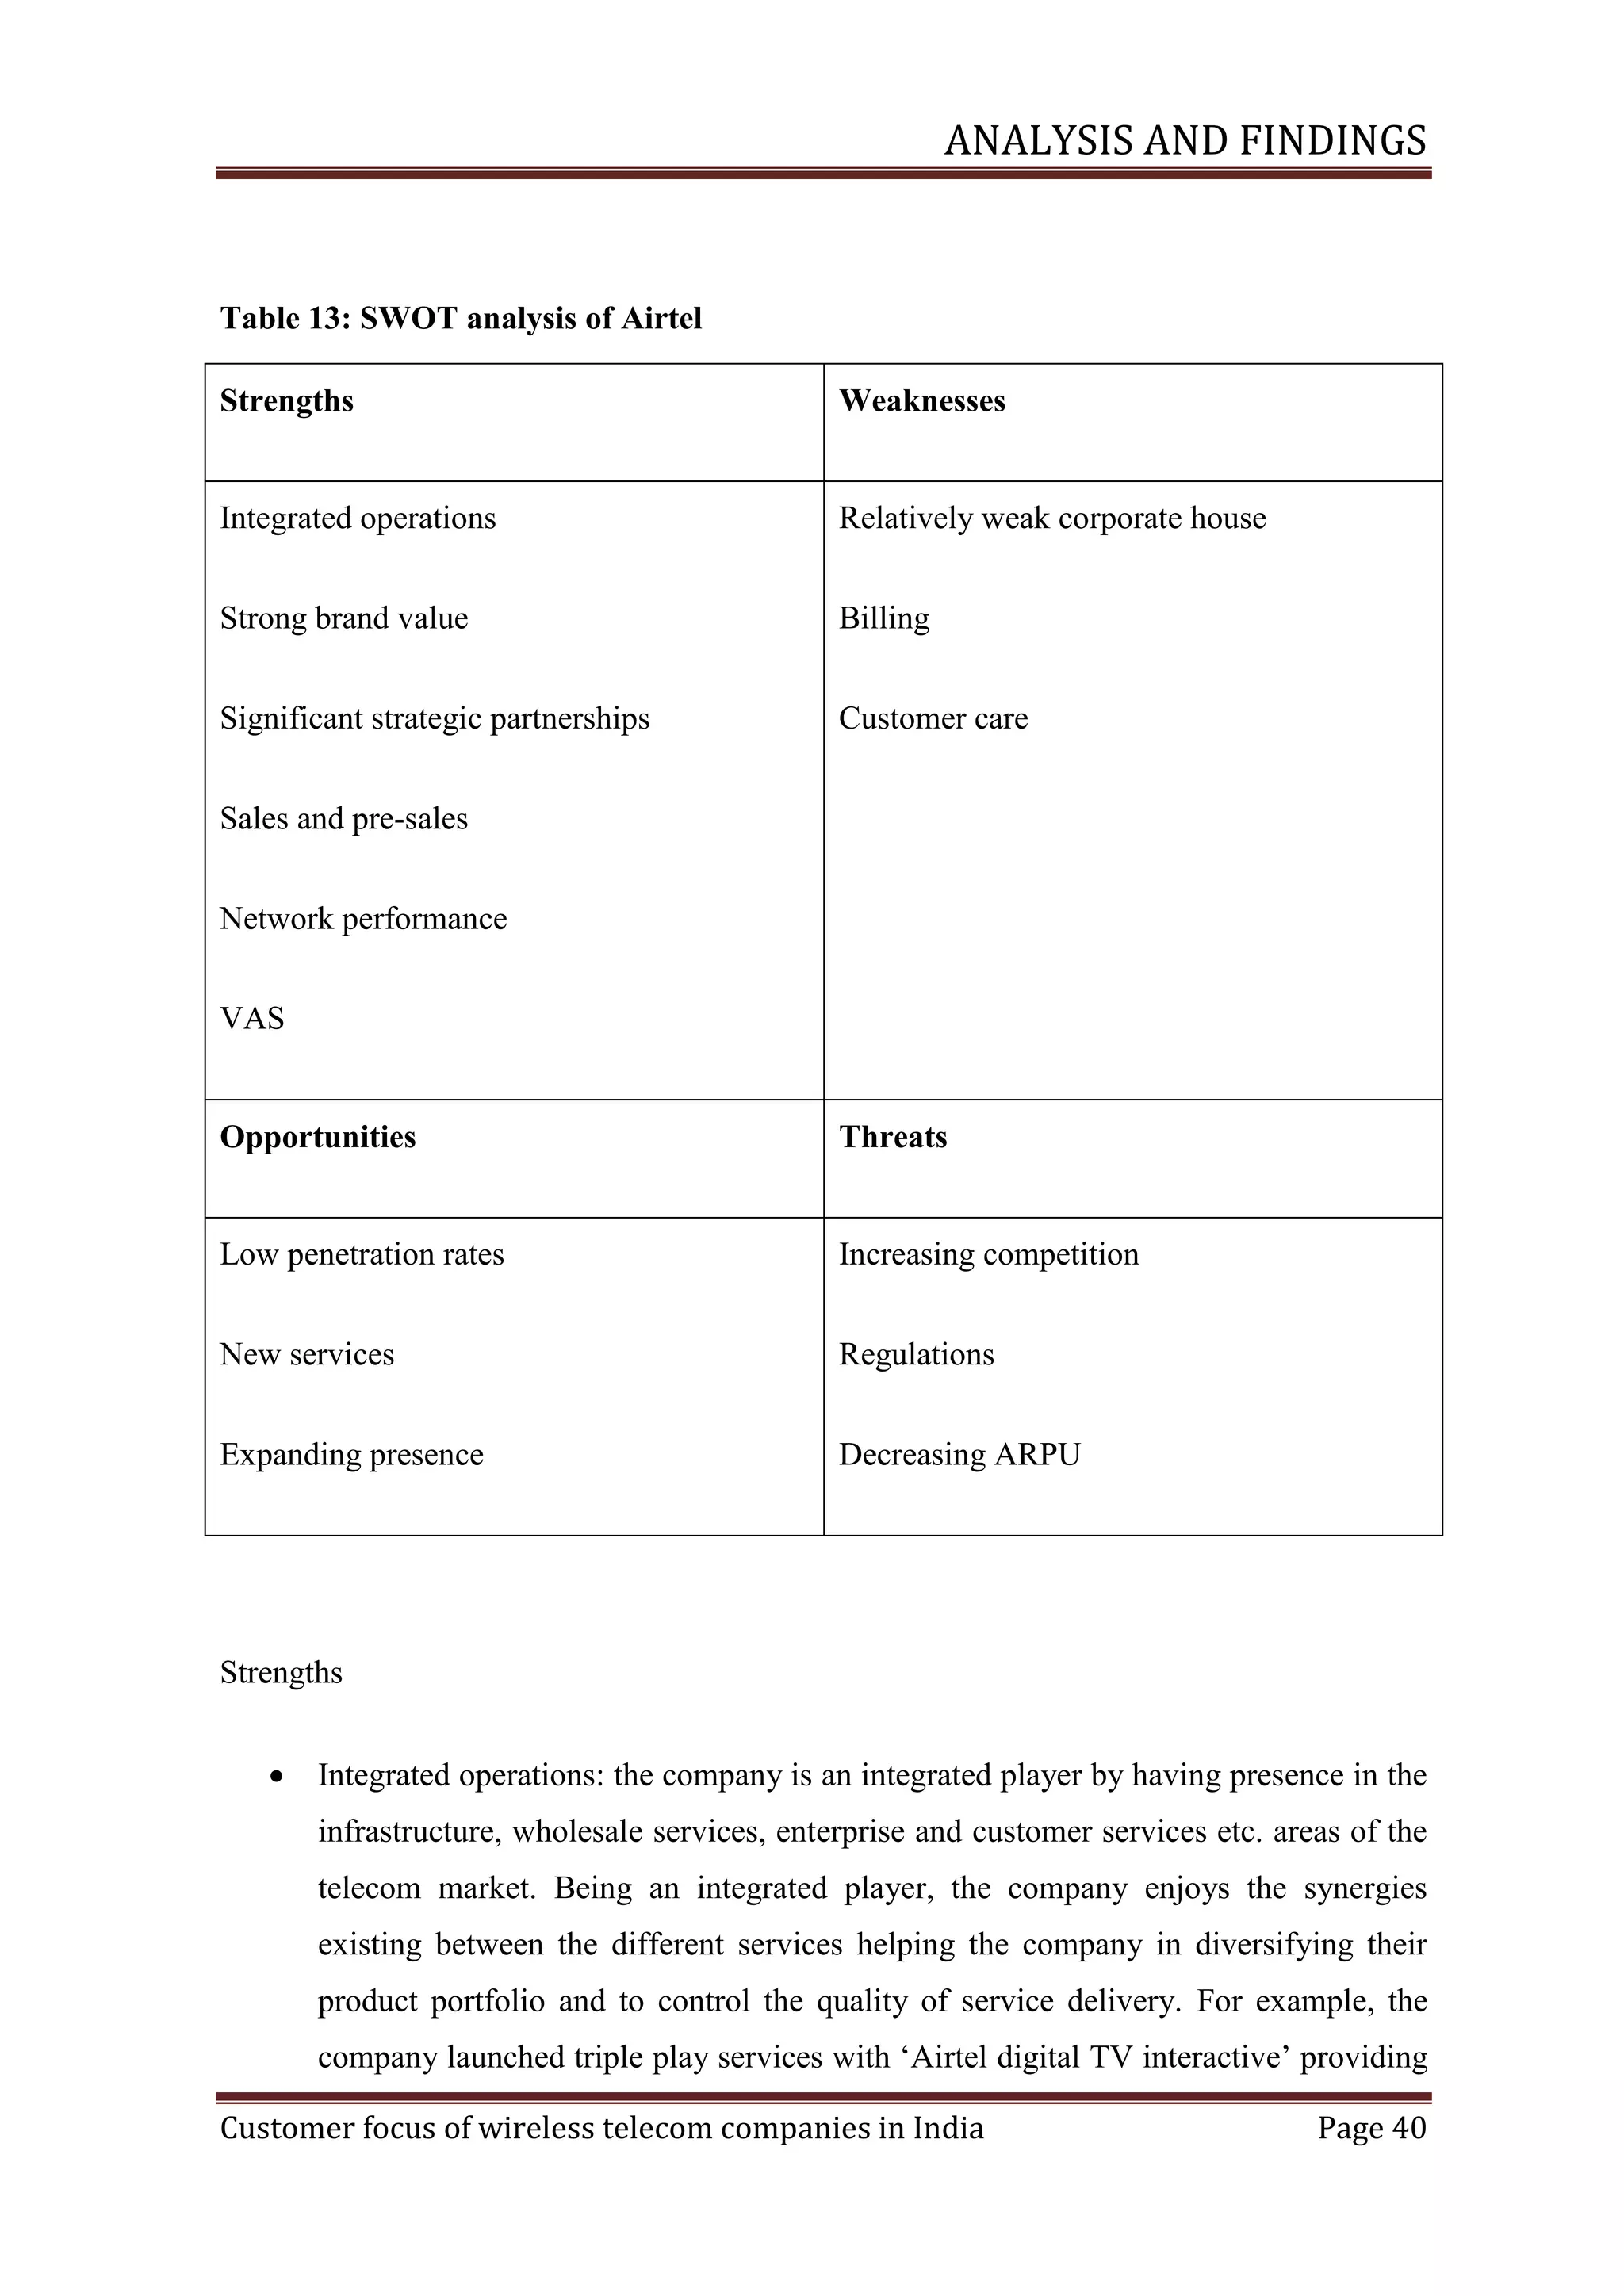
3.1 SWOT Analysis (Strengths, Weaknesses, Opportunities, Threats)
According to Kotler et al. [15], the overall evaluation of a company‘s strengths, weaknesses,
opportunities, and threats is called SWOT analysis. It involves monitoring the external and
internal business environment. They have divided the analysis into the following two parts.
SWOT analysis has been used in the study to discuss the strengths and weakness of a
telecom service provider in its ability to compete in the telecom sector and in providing
QoS contributing to overall satisfaction for customers.
3.1.1 External environment (opportunity and threat) analysis
A business unit has to monitor the key macro environment forces like demographic,
cultural, technological forces etc and significant microenvironment actors like customers,
competitors, suppliers etc. that affect its ability to earn Profits. The business should set up a
marketing intelligence system to track trends and important developments. For each event
or development management needs to identify the associated opportunities and threats.
An opportunity is an area of buyer need and interest in which there is a high probability that
a company can profitably satisfy that need. There are three main sources of market
opportunities. The first is to supply something that is in short supply, the second to supply
an existing product or service in a new or superior way, the third source often leads to a
totally new product or service.
An environmental threat is a challenge posed by an unfavourable trend or development that
would lead, in the absence of defensive marketing action to lower sales or profit. Threats
should be classified according to seriousness and probability of occurrence.
Customer focus of wireless telecom companies in India
Page 15](https://image.slidesharecdn.com/satyafinalproject-140224205709-phpapp02/75/Satya-final-project-32-2048.jpg)
![THEORETICAL BACKGROUND
3.1.2 Internal environment (strengths/weaknesses) analysis
Each business needs to evaluate its internal strengths and weaknesses. This does not mean
that the business needs to correct all its weaknesses nor should it harp about the strengths it
possesses. The business has to consider about limiting itself to those opportunities where it
possesses strengths or whether it should consider opportunities where it might have to
develop certain strengths.
Stalk et al.
[24]
suggest that winning companies are those that have achieved superior in-
company capabilities. Although each department may possess specific core competencies
the challenge for the business is to develop superior competitive capability in managing
company's key processes.
Thus we arrive at the need and use of SWOT analysis for the business. It provides us with a
competitive analysis of the business. We also have to look at other analysis techniques used
for study.
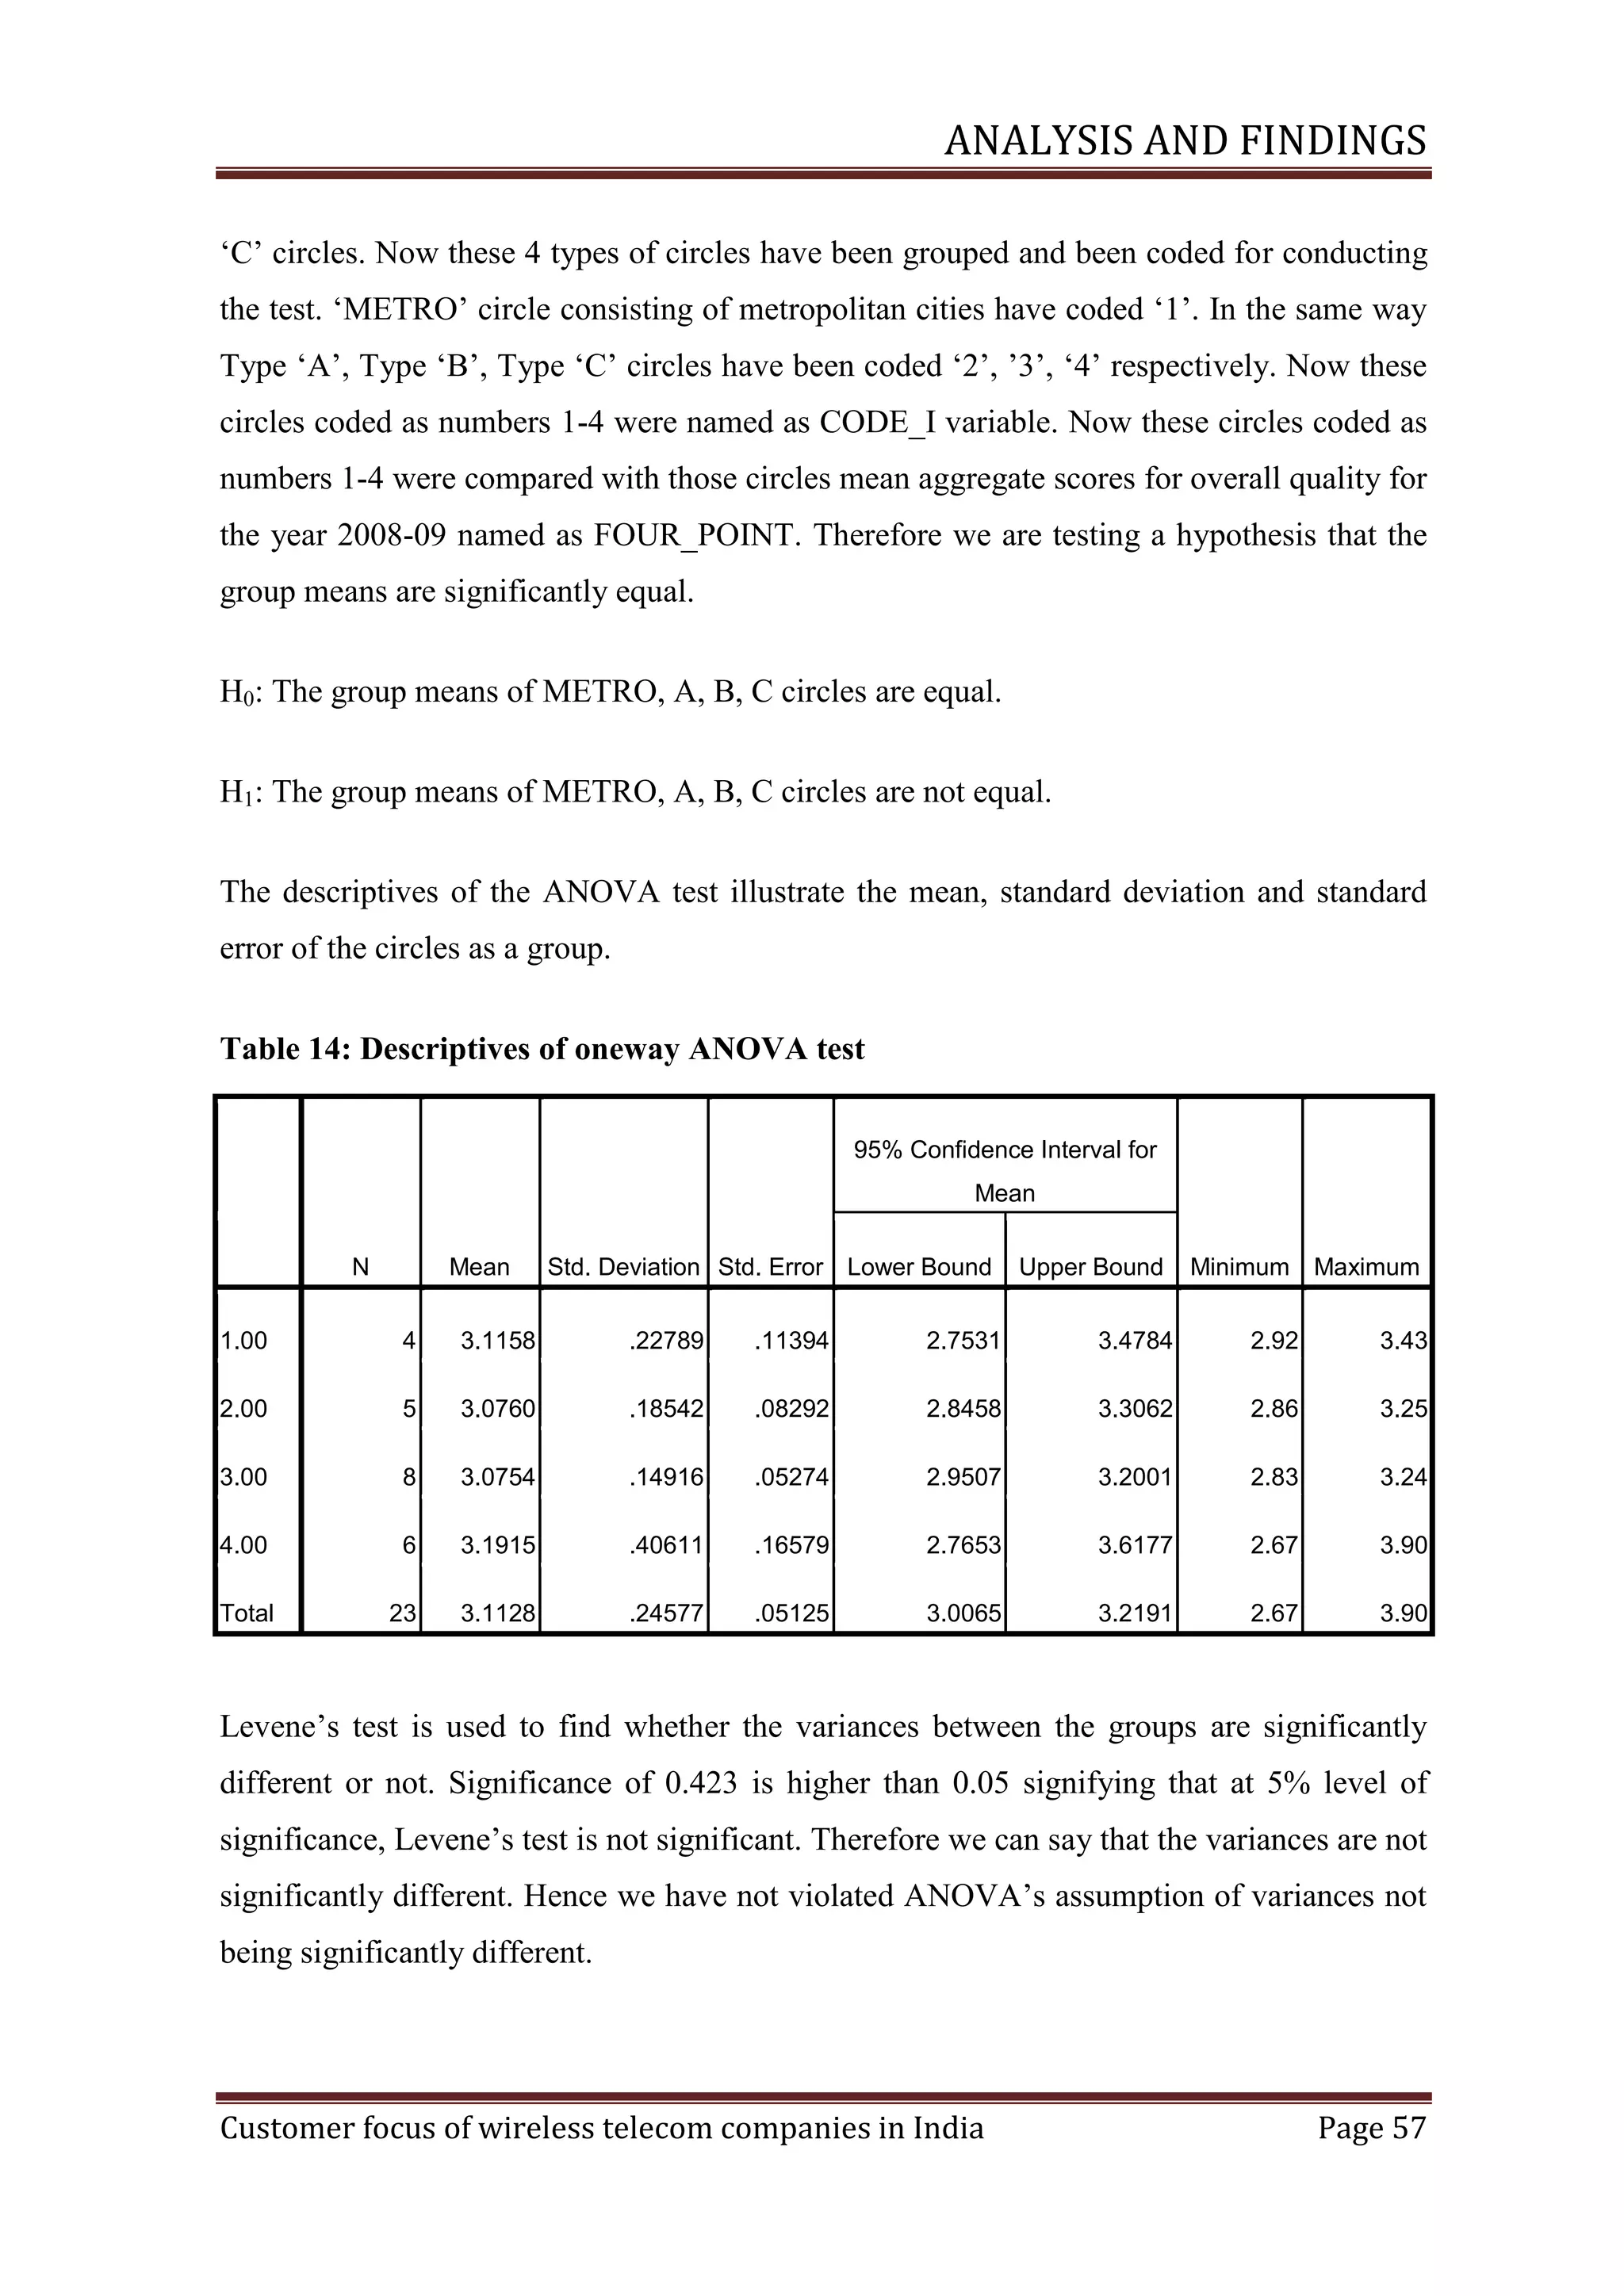
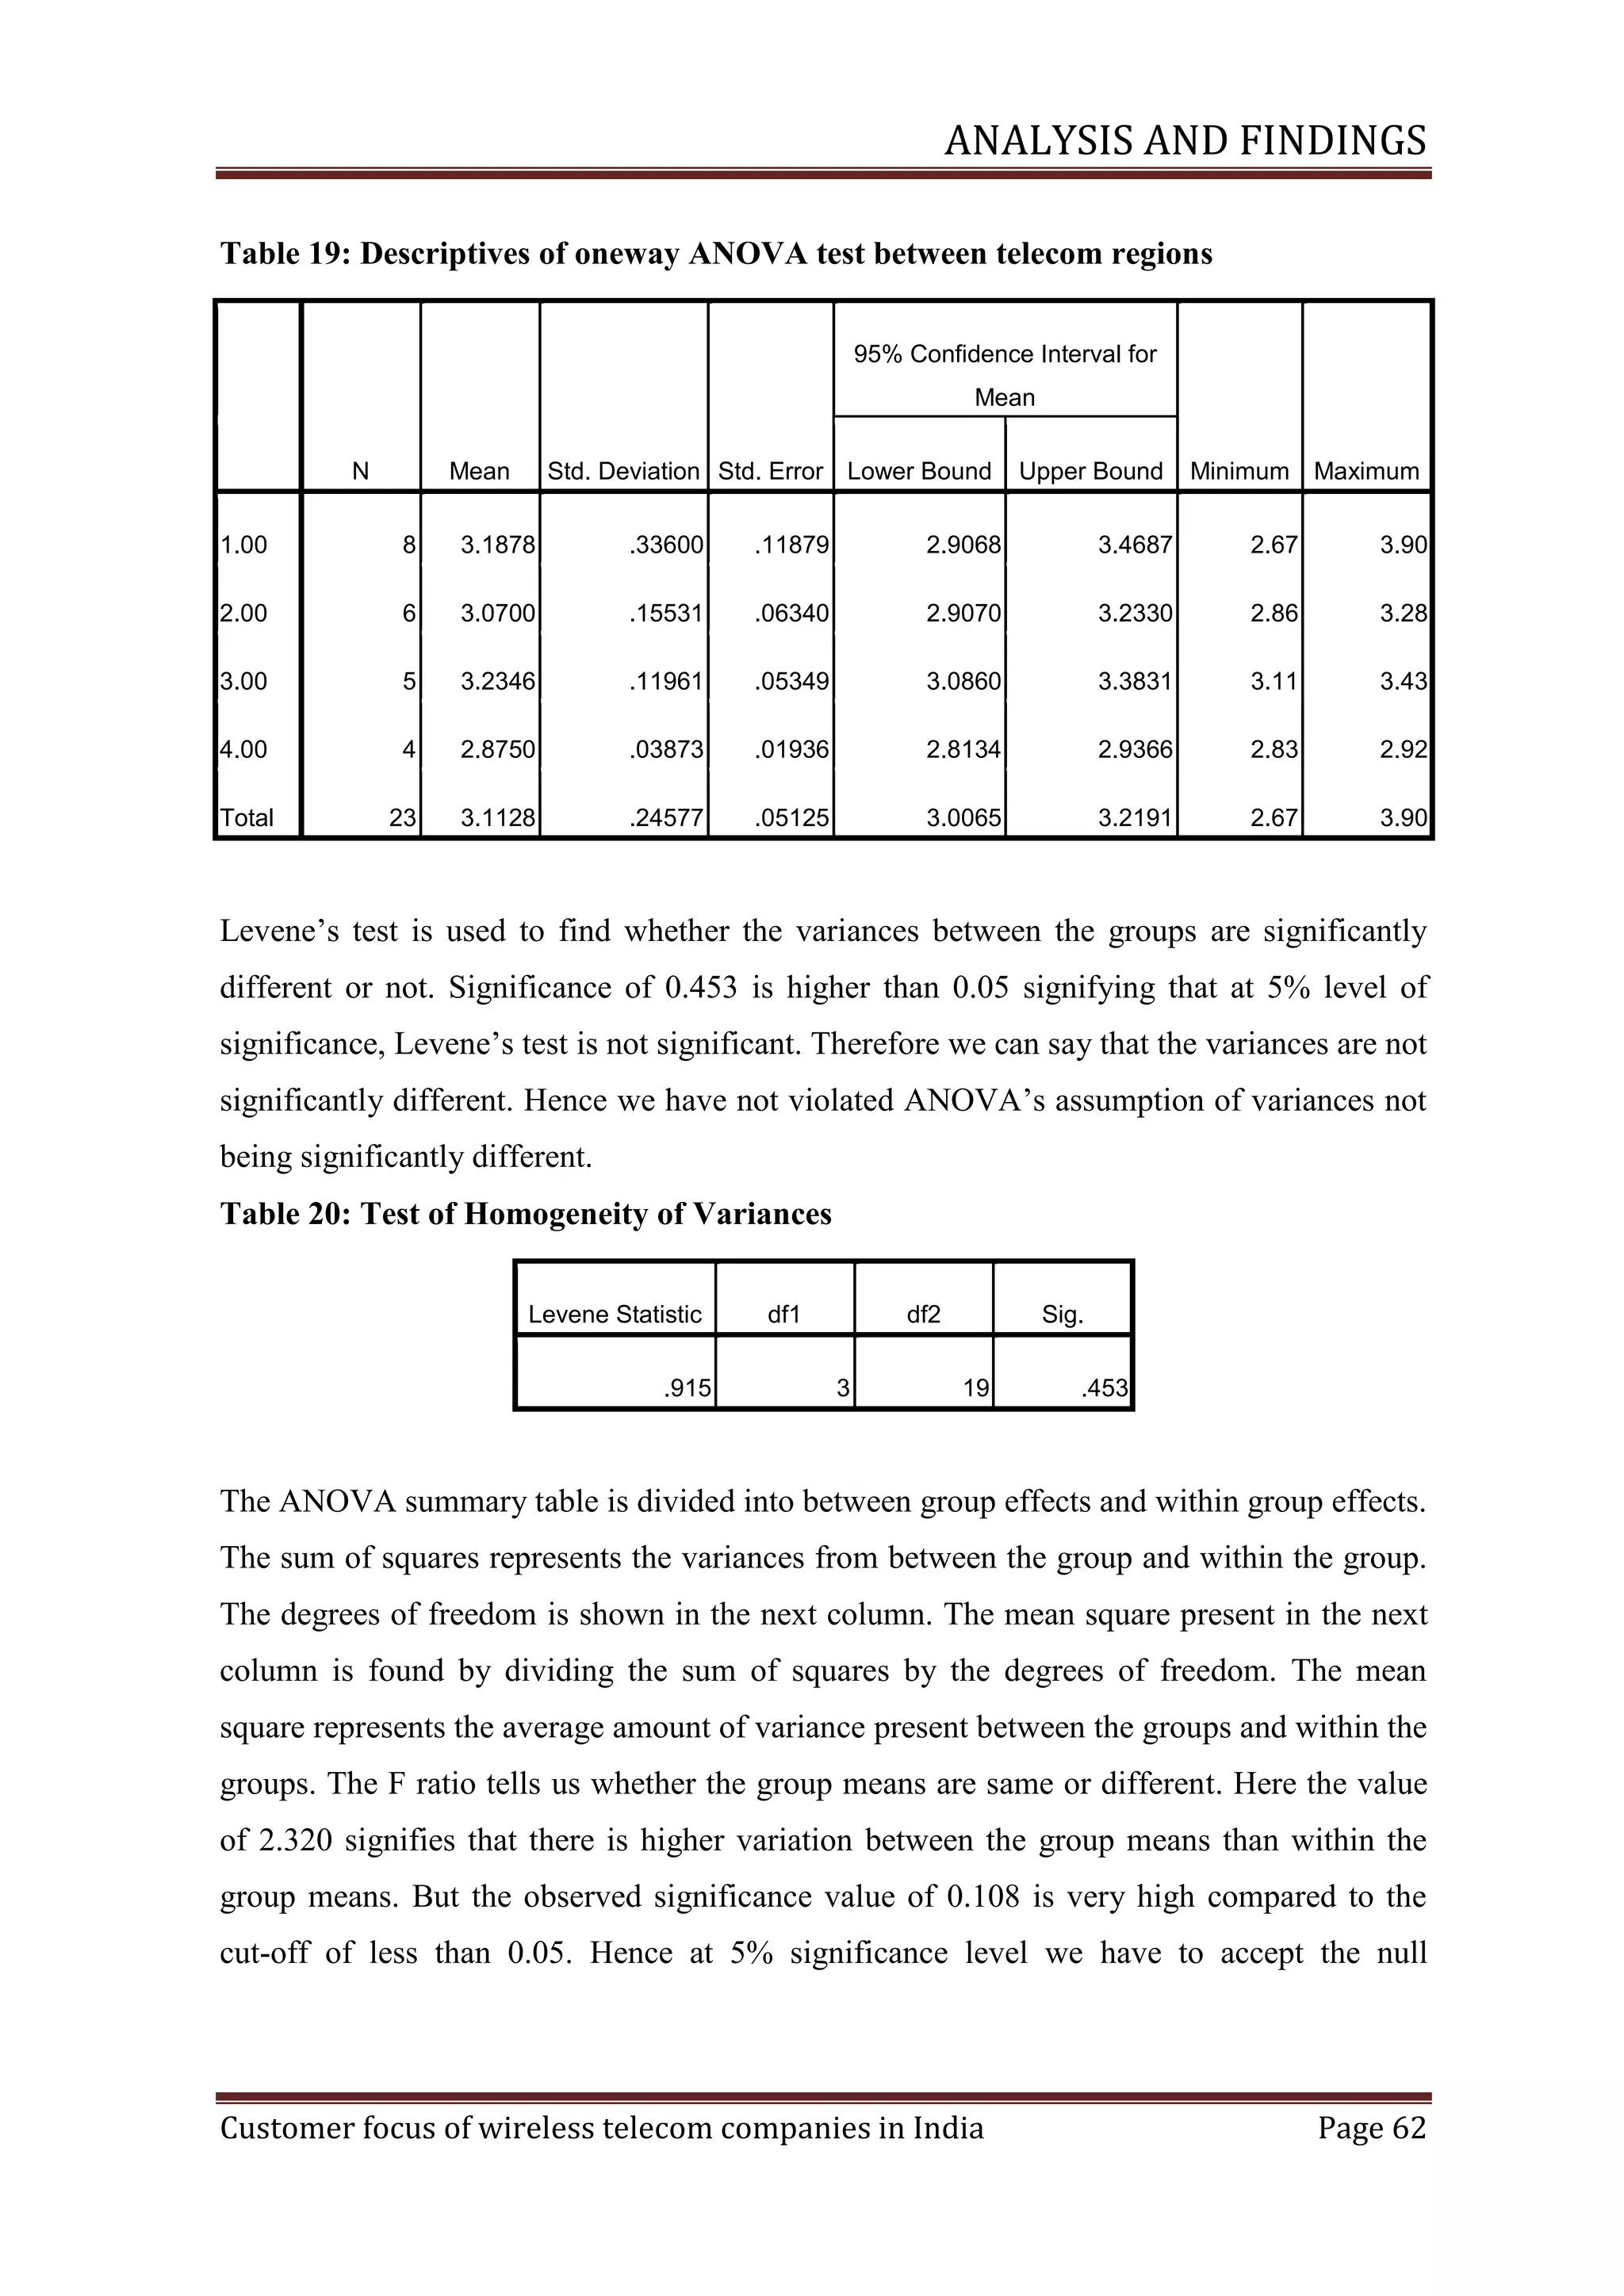
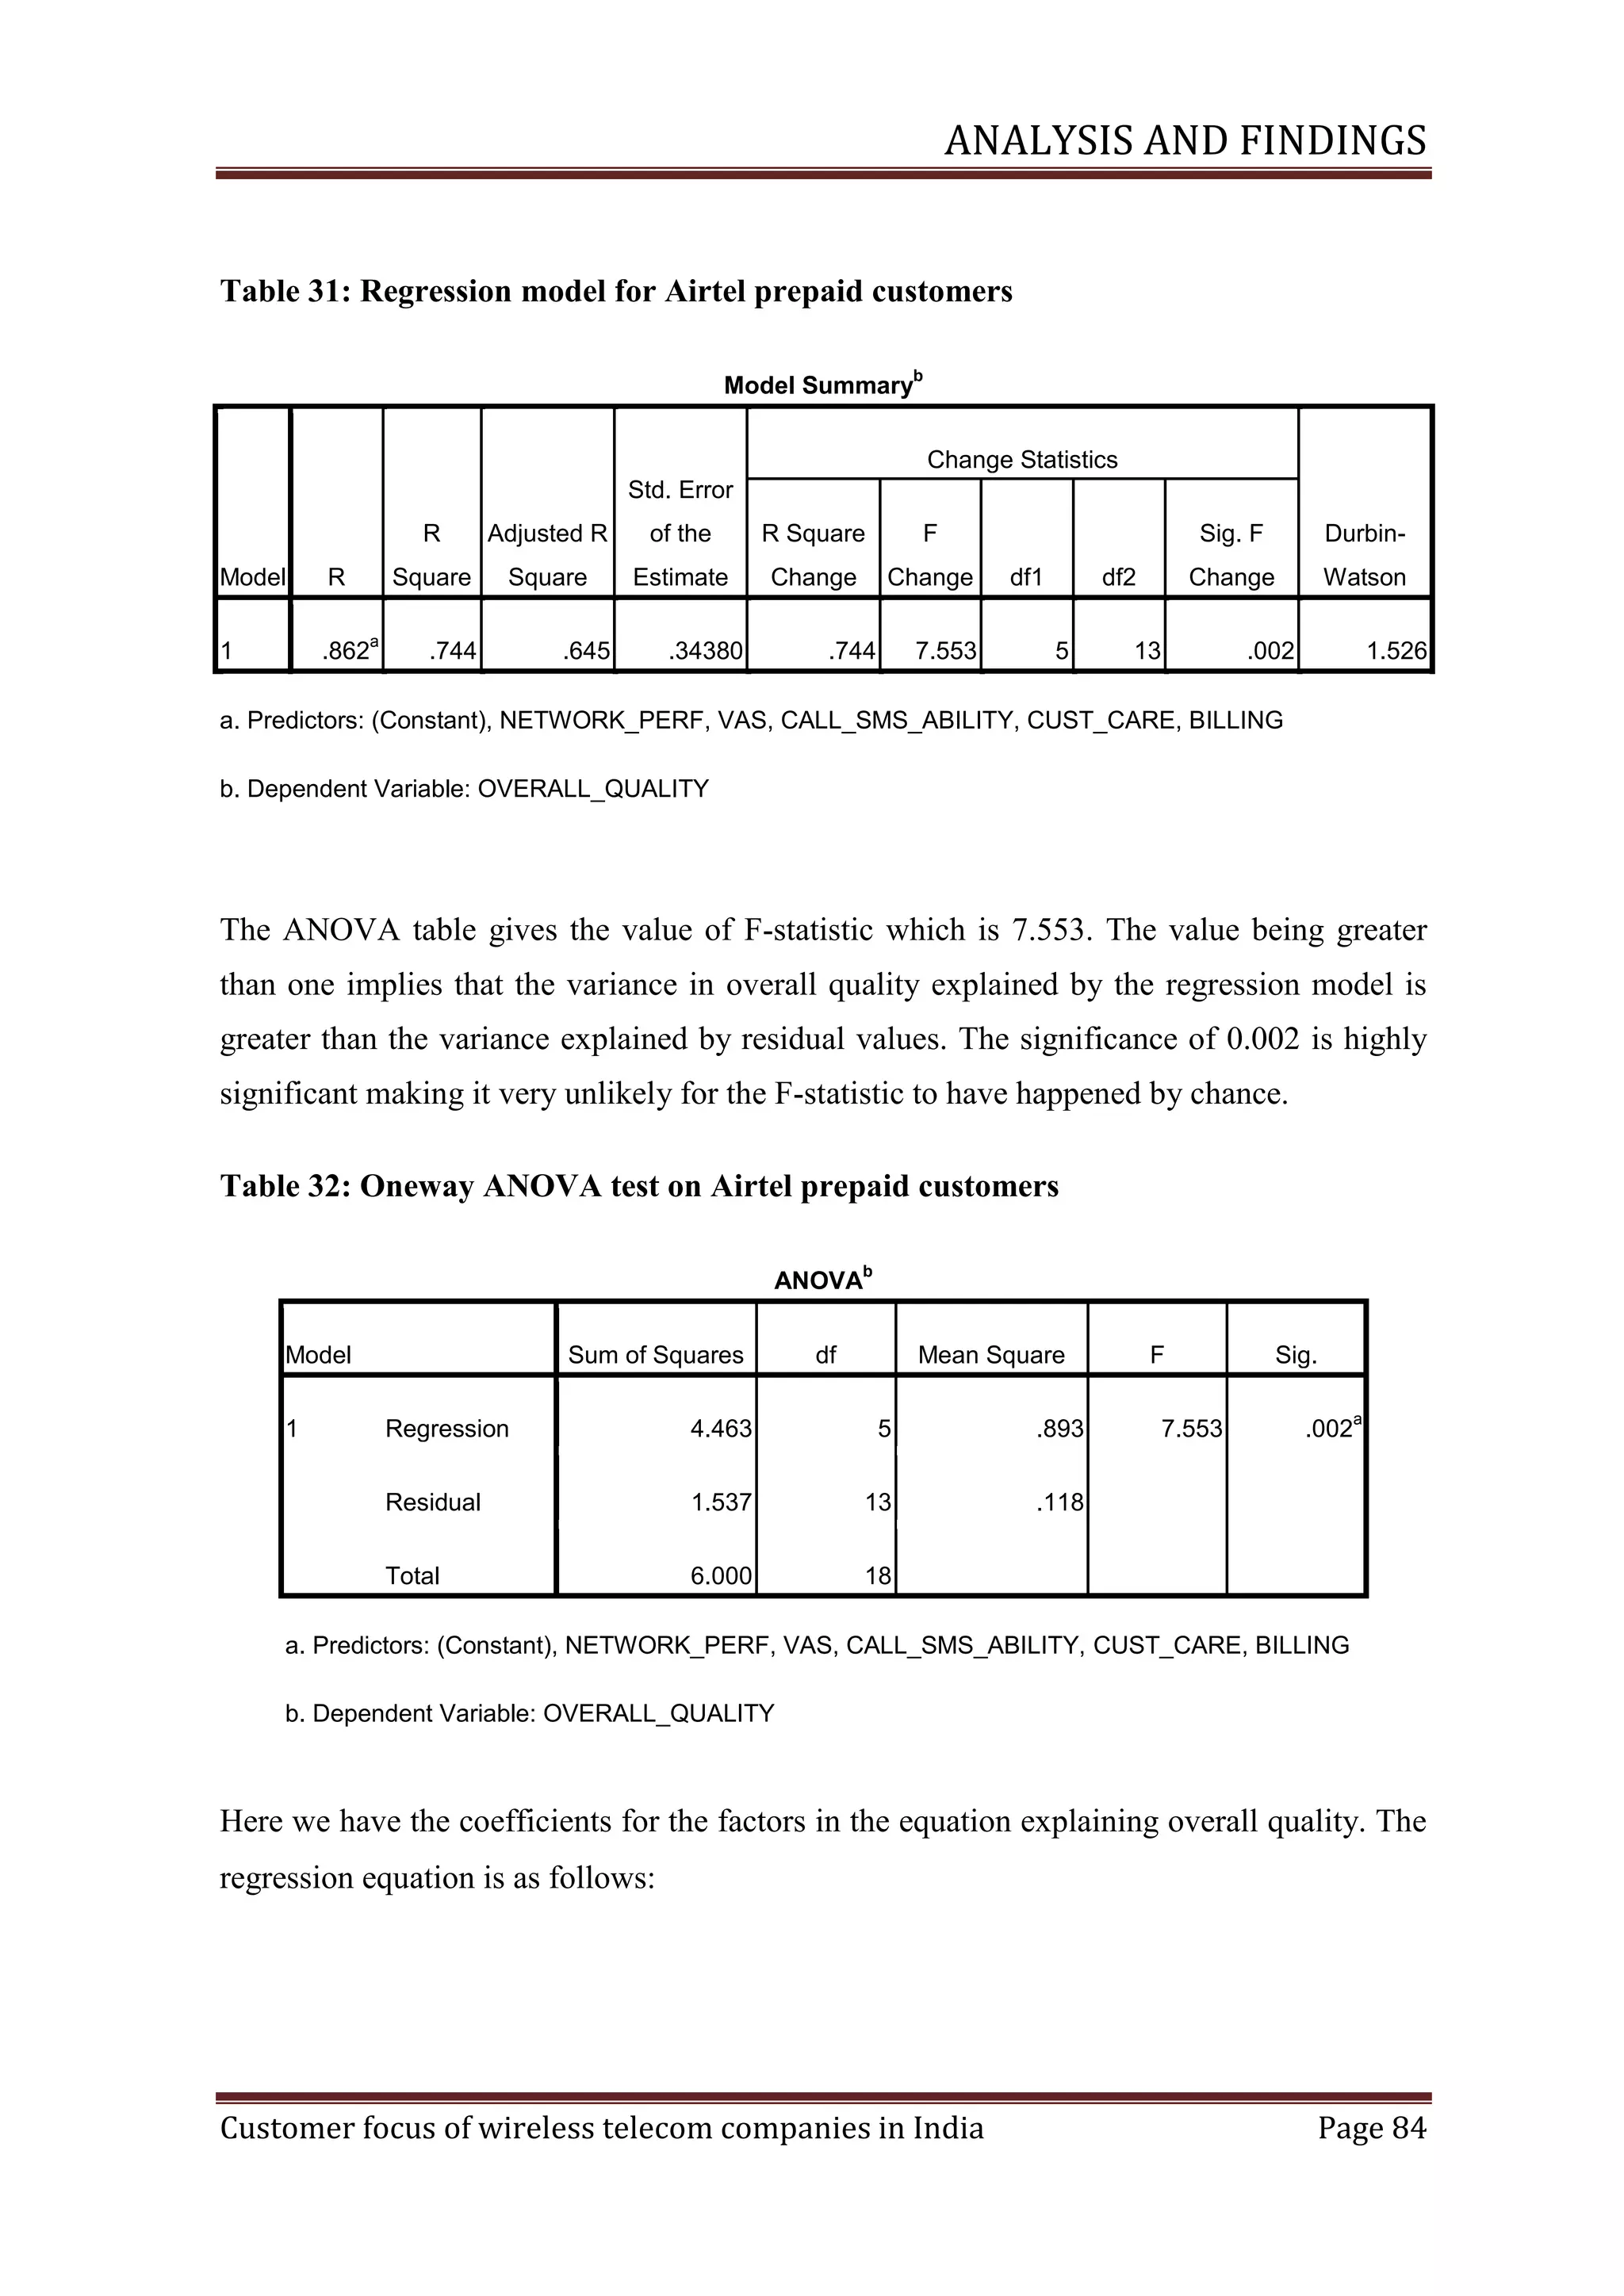
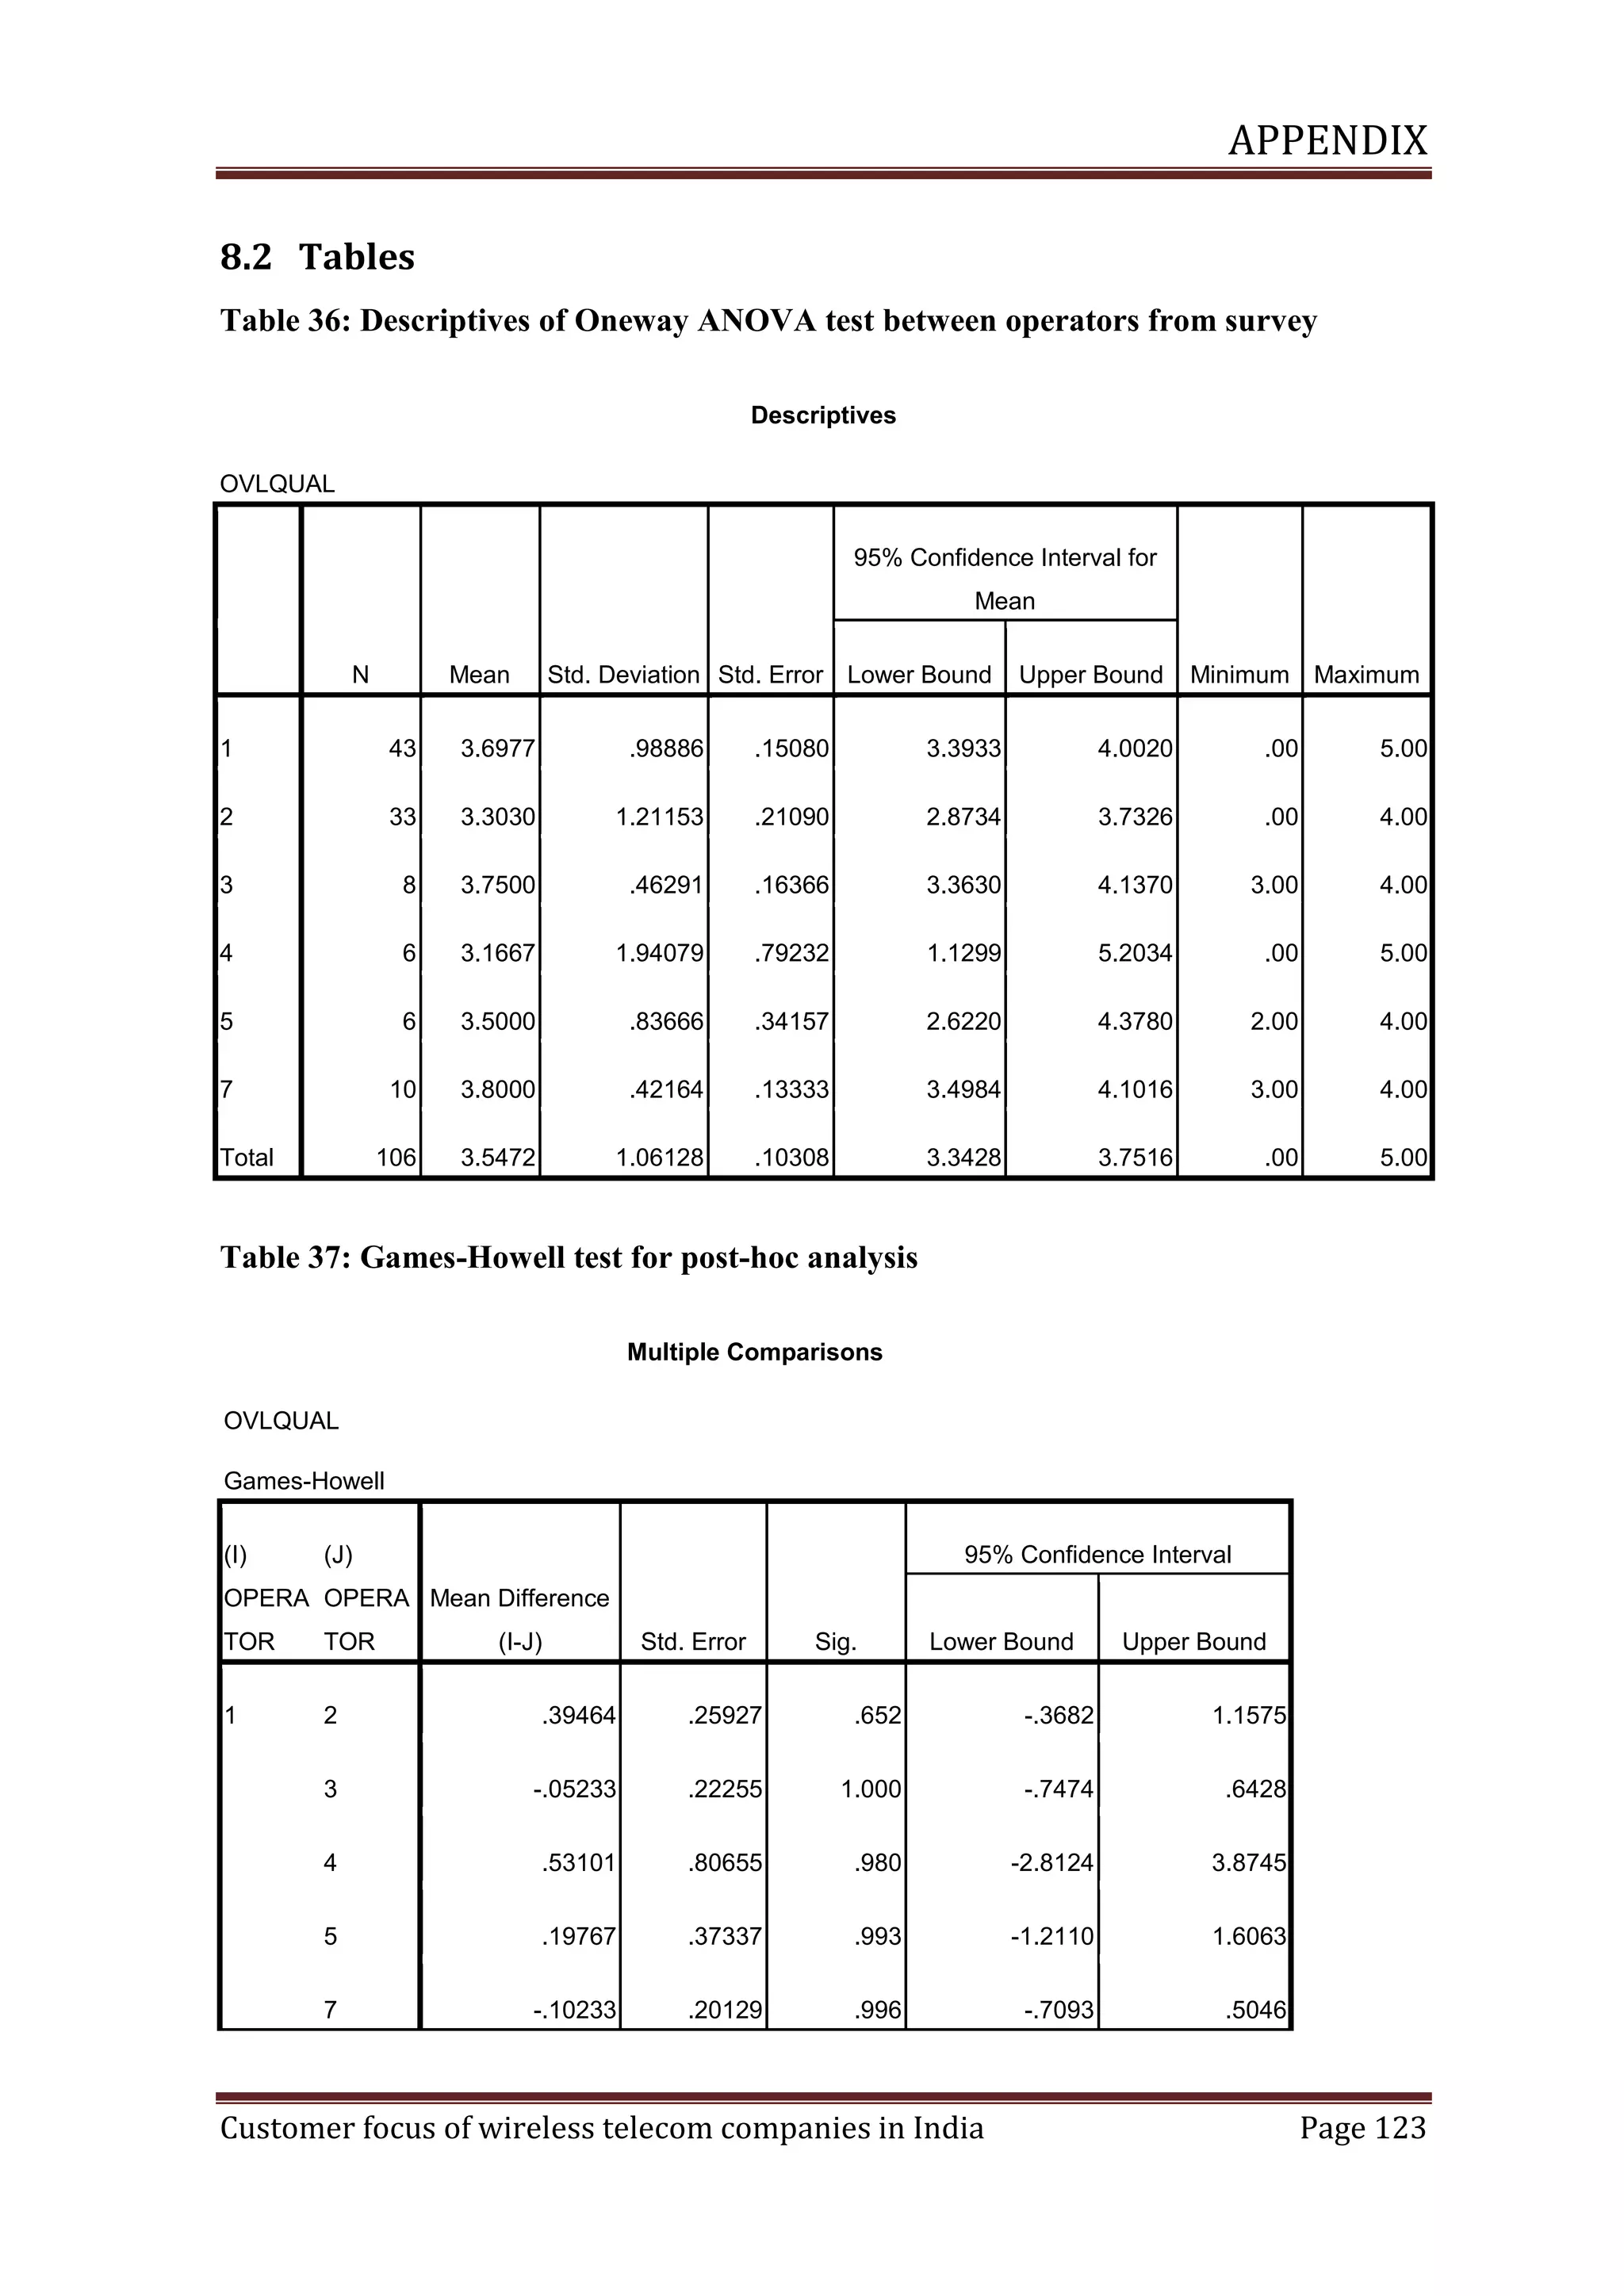
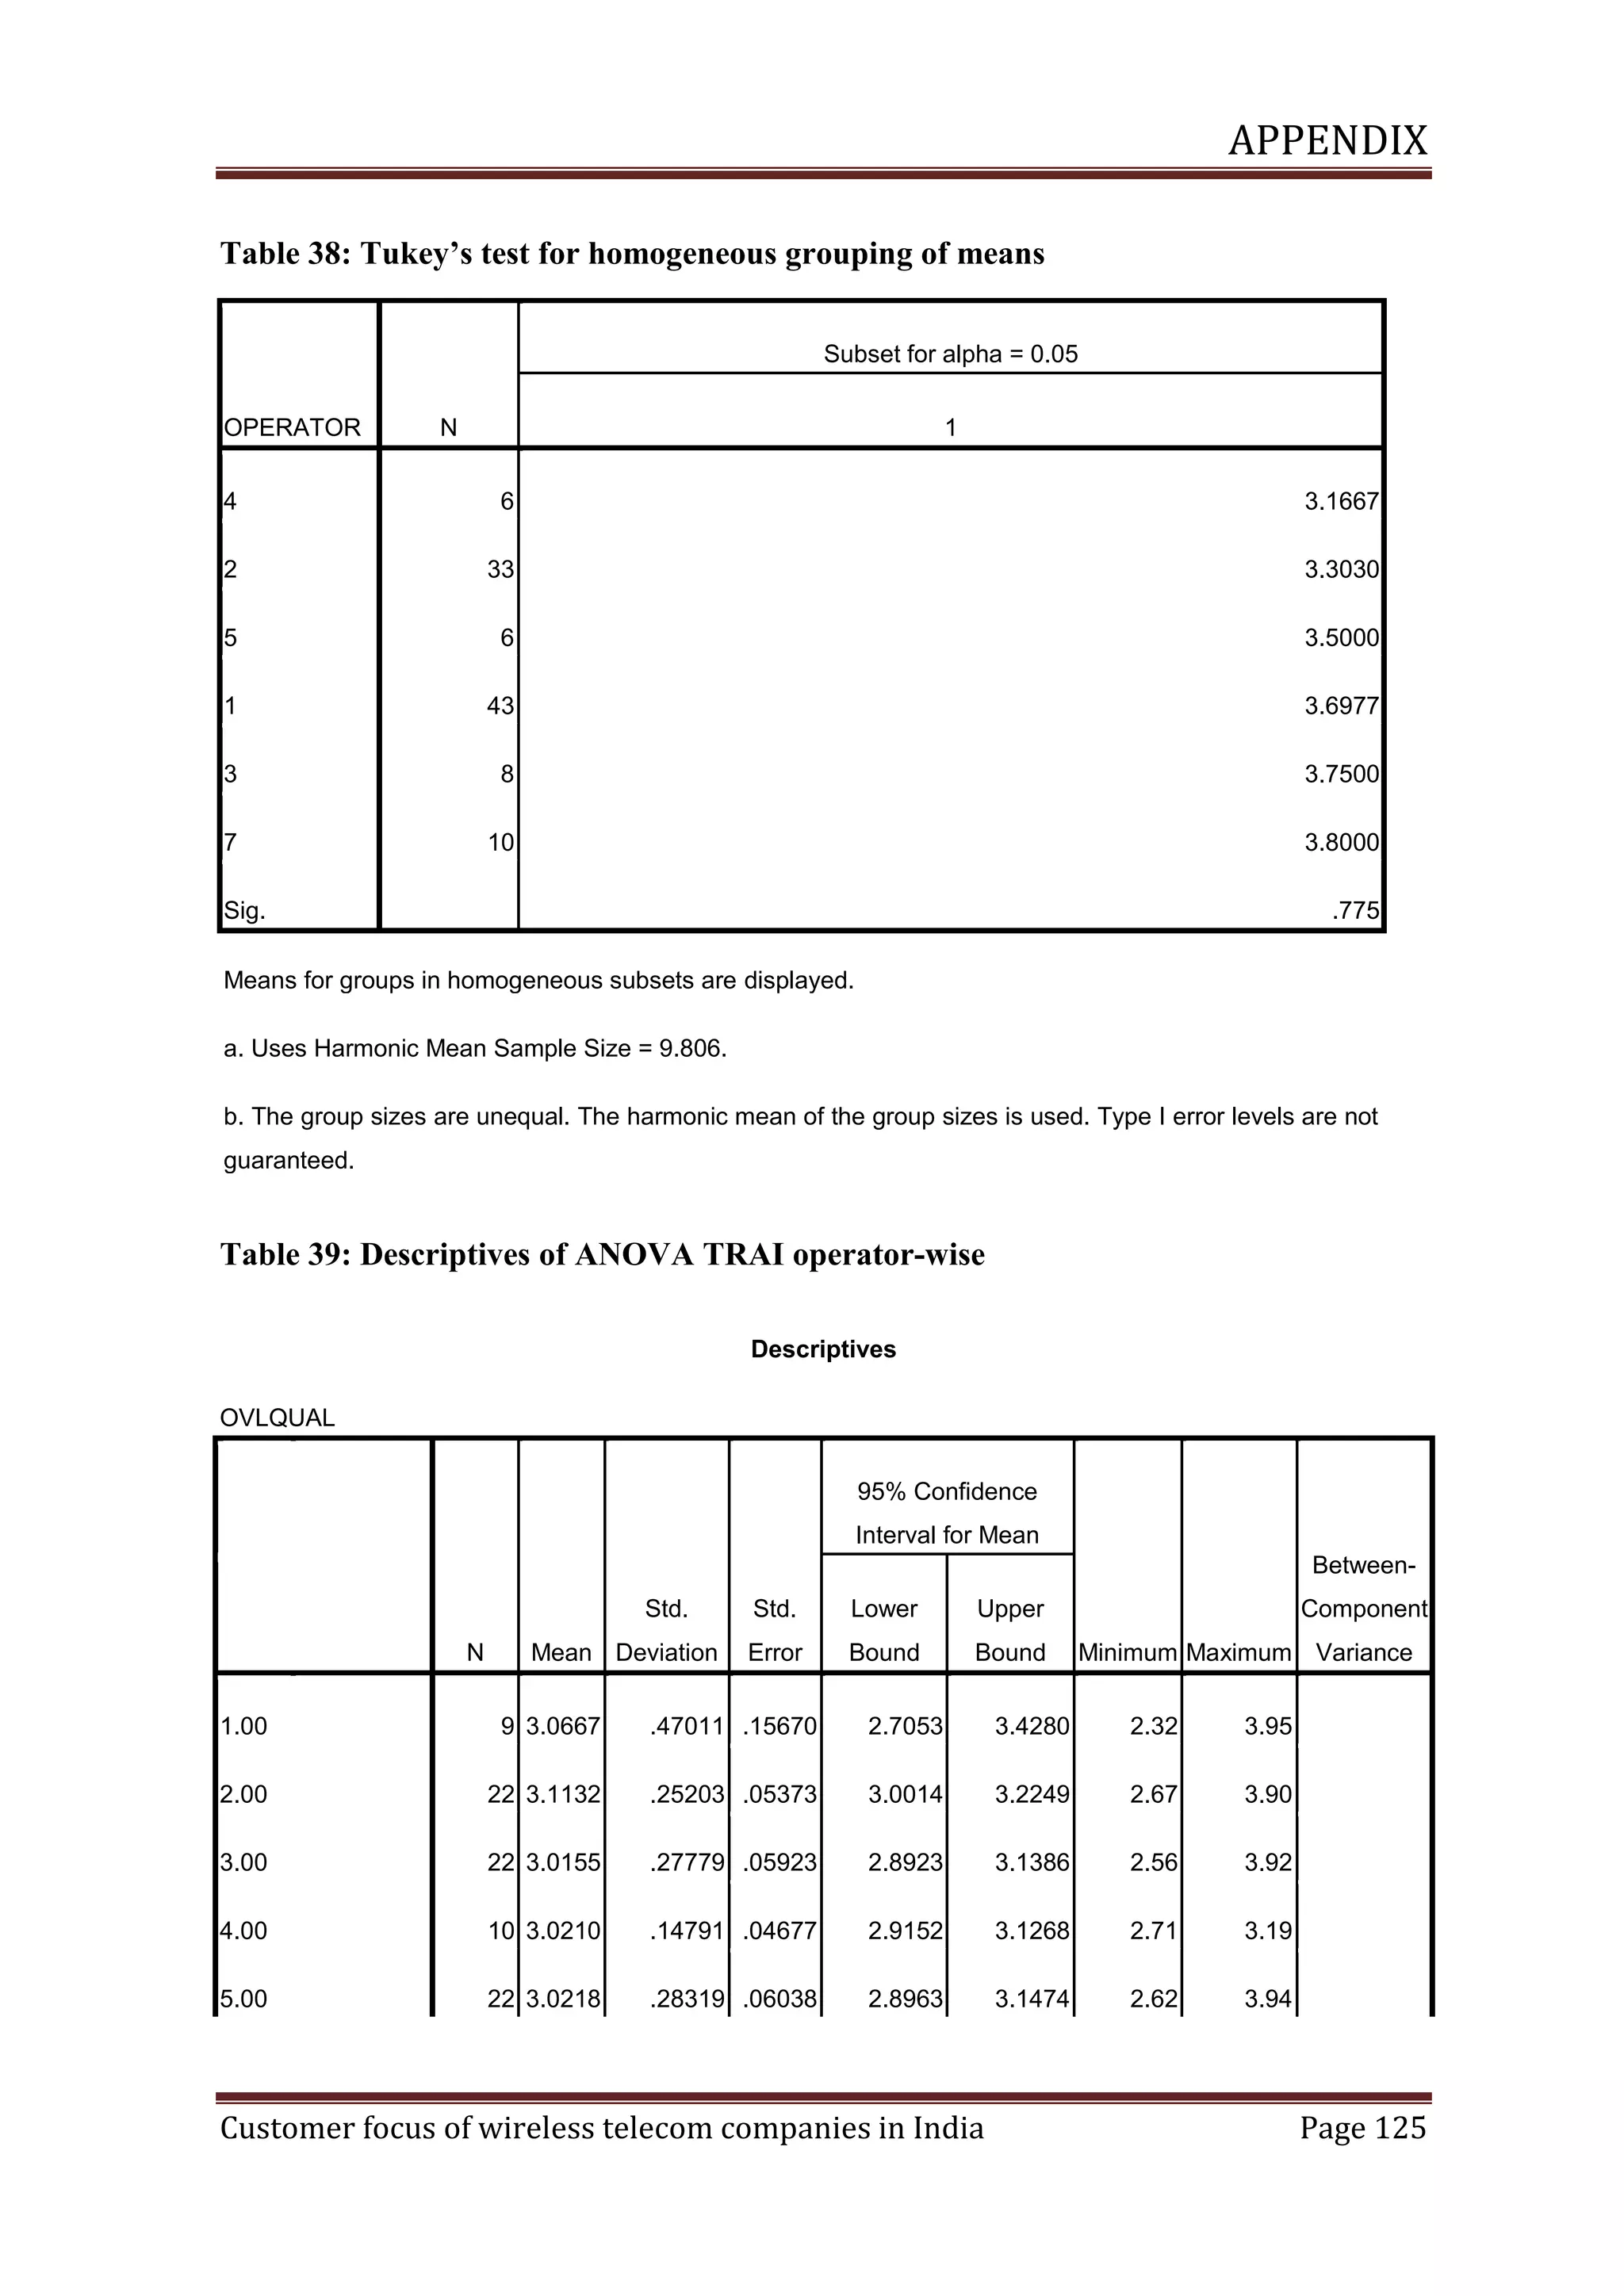
3.2 Oneway ANOVA Test
Oneway ANOVA test helps us in comparing the satisfaction levels between different
groups, thus contributing in proving whether satisfaction levels are similar or homogeneous
across the groups.
According to Joaquim P. Marques de Sá [20], ANOVA or analysis of variance is the test of
hypothesis that three or more means are the same or not. It produces an F-statistic that
compares the amount of systematic variance in the data to the amount of unsystematic
variance in the data. It is done by producing a one-way analysis of variance for a
quantitative dependent variable by a single factor (independent) variable. This technique is
an extension of the two-sample t test.
The assumptions made are each group is an independent random sample from a normal
population. Analysis of variance is robust to departures from normality, although the data
should be symmetric. The groups should come from populations with equal variances. To
test this assumption, we use Levene's homogeneity-of-variance test.
Customer focus of wireless telecom companies in India
Page 16](https://image.slidesharecdn.com/satyafinalproject-140224205709-phpapp02/75/Satya-final-project-33-2048.jpg)
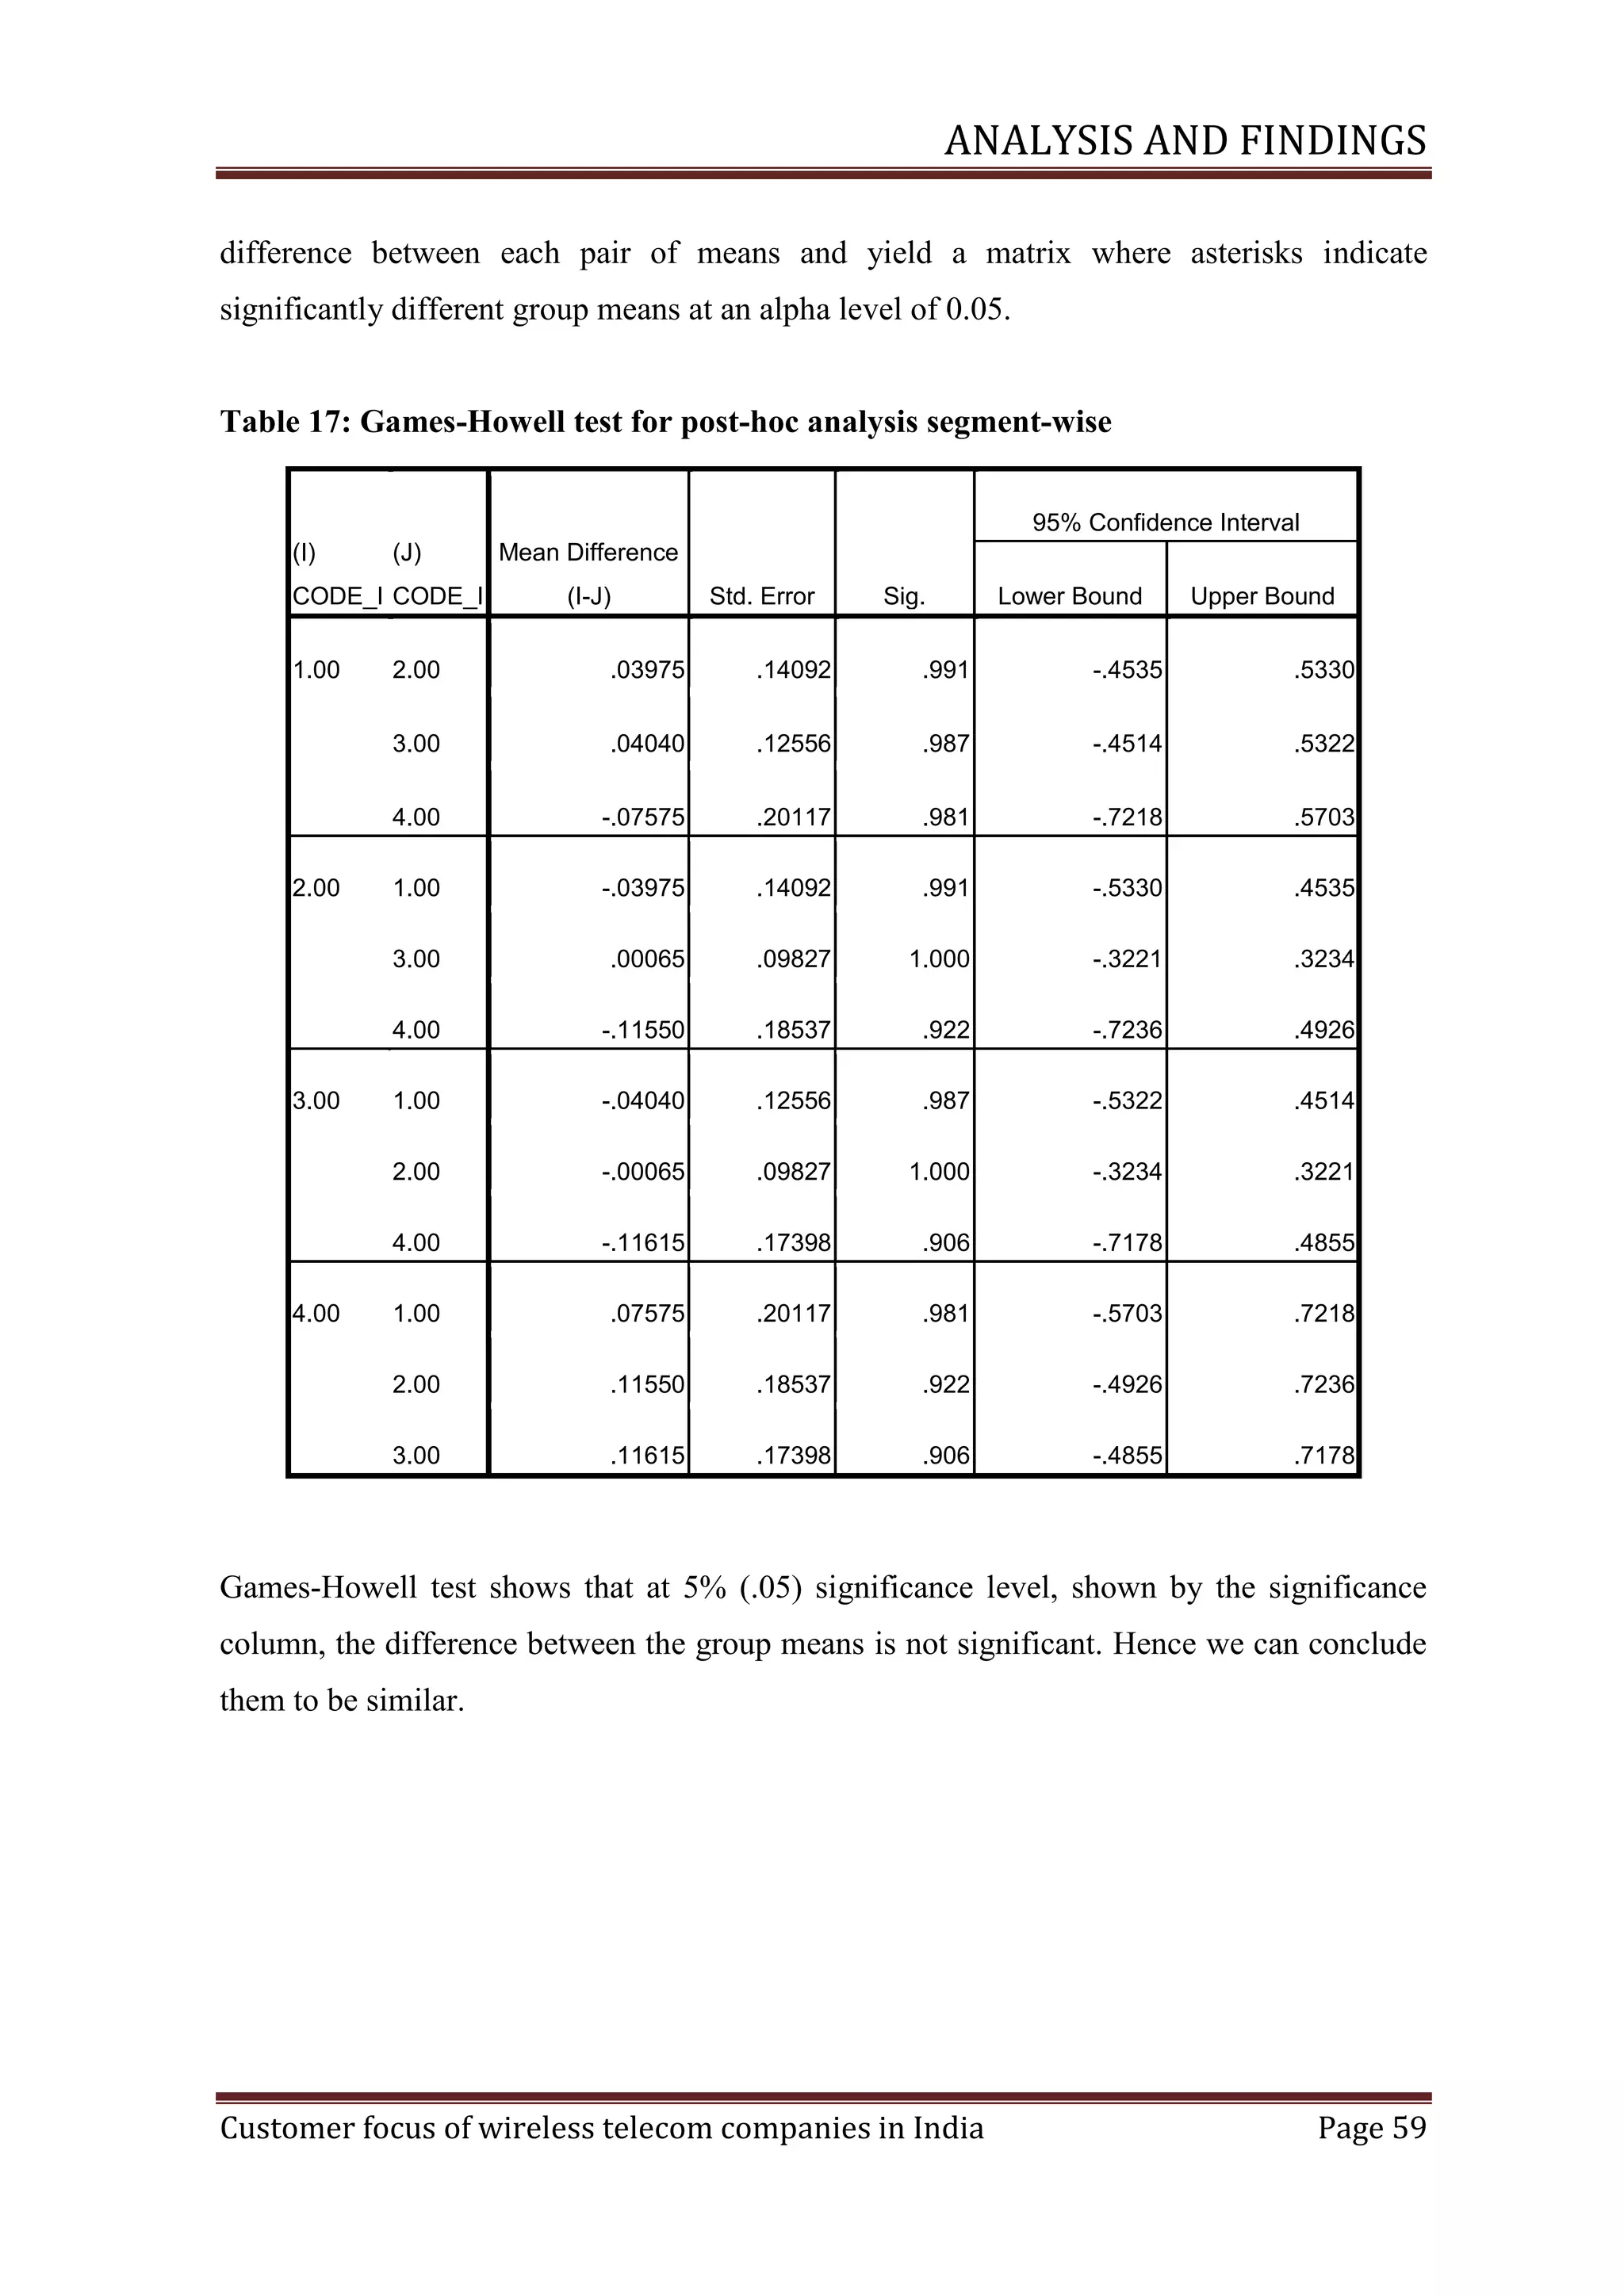
![THEORETICAL BACKGROUND
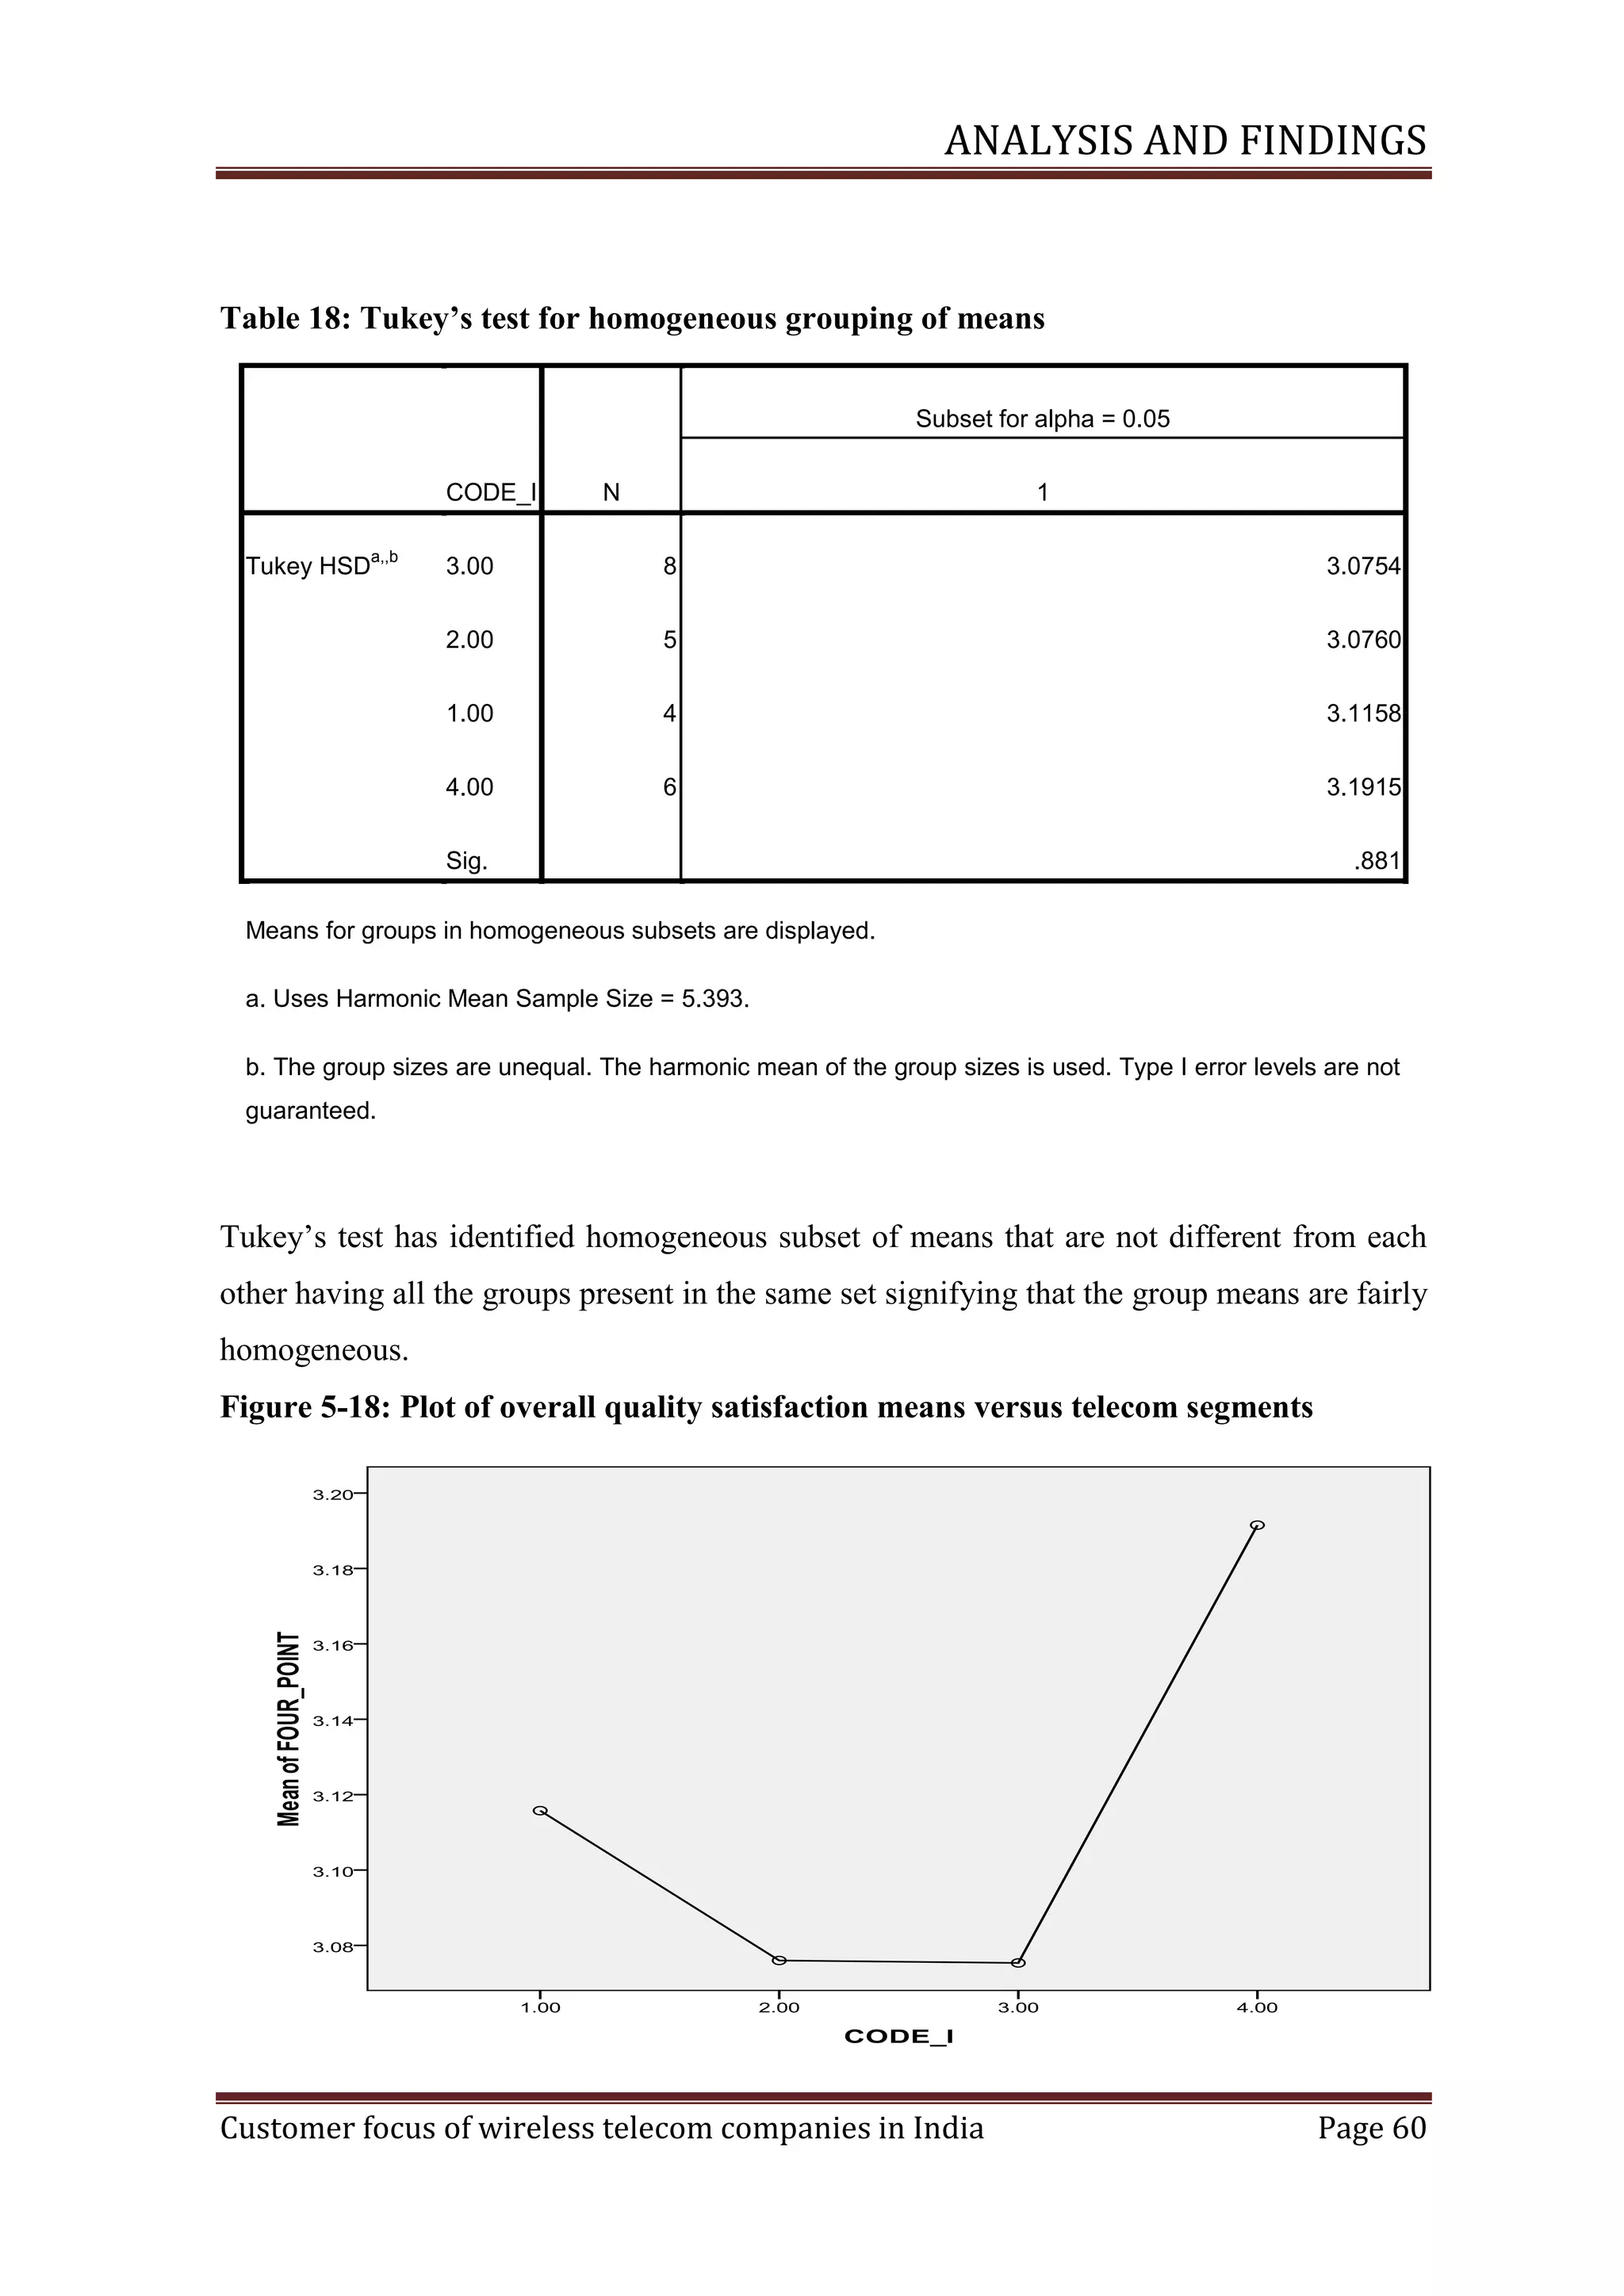
In addition to determining the differences existing among the means, we can also know
which means differ. Post hoc range tests and pair wise multiple comparisons can determine
which means differ. Range tests identify homogeneous subsets of means that are not
different from each other. Pair wise multiple comparisons test the difference between each
pair of means and yield a matrix where asterisks indicate significantly different group
means at an alpha level of 0.05.
Tukey‘s test uses the Studentized range statistic to make all of the pair wise comparisons
between groups. It provides a homogeneous set of means which are significantly not
different. Games-Howell test is a pair wise comparison test that is sometimes liberal. This
test is appropriate when the variances are unequal.
Thus using Oneway ANOVA we will be able test for the equality of satisfaction scores
given by different populations. It will help us finding if the population characteristic of
satisfaction is similar across the country.
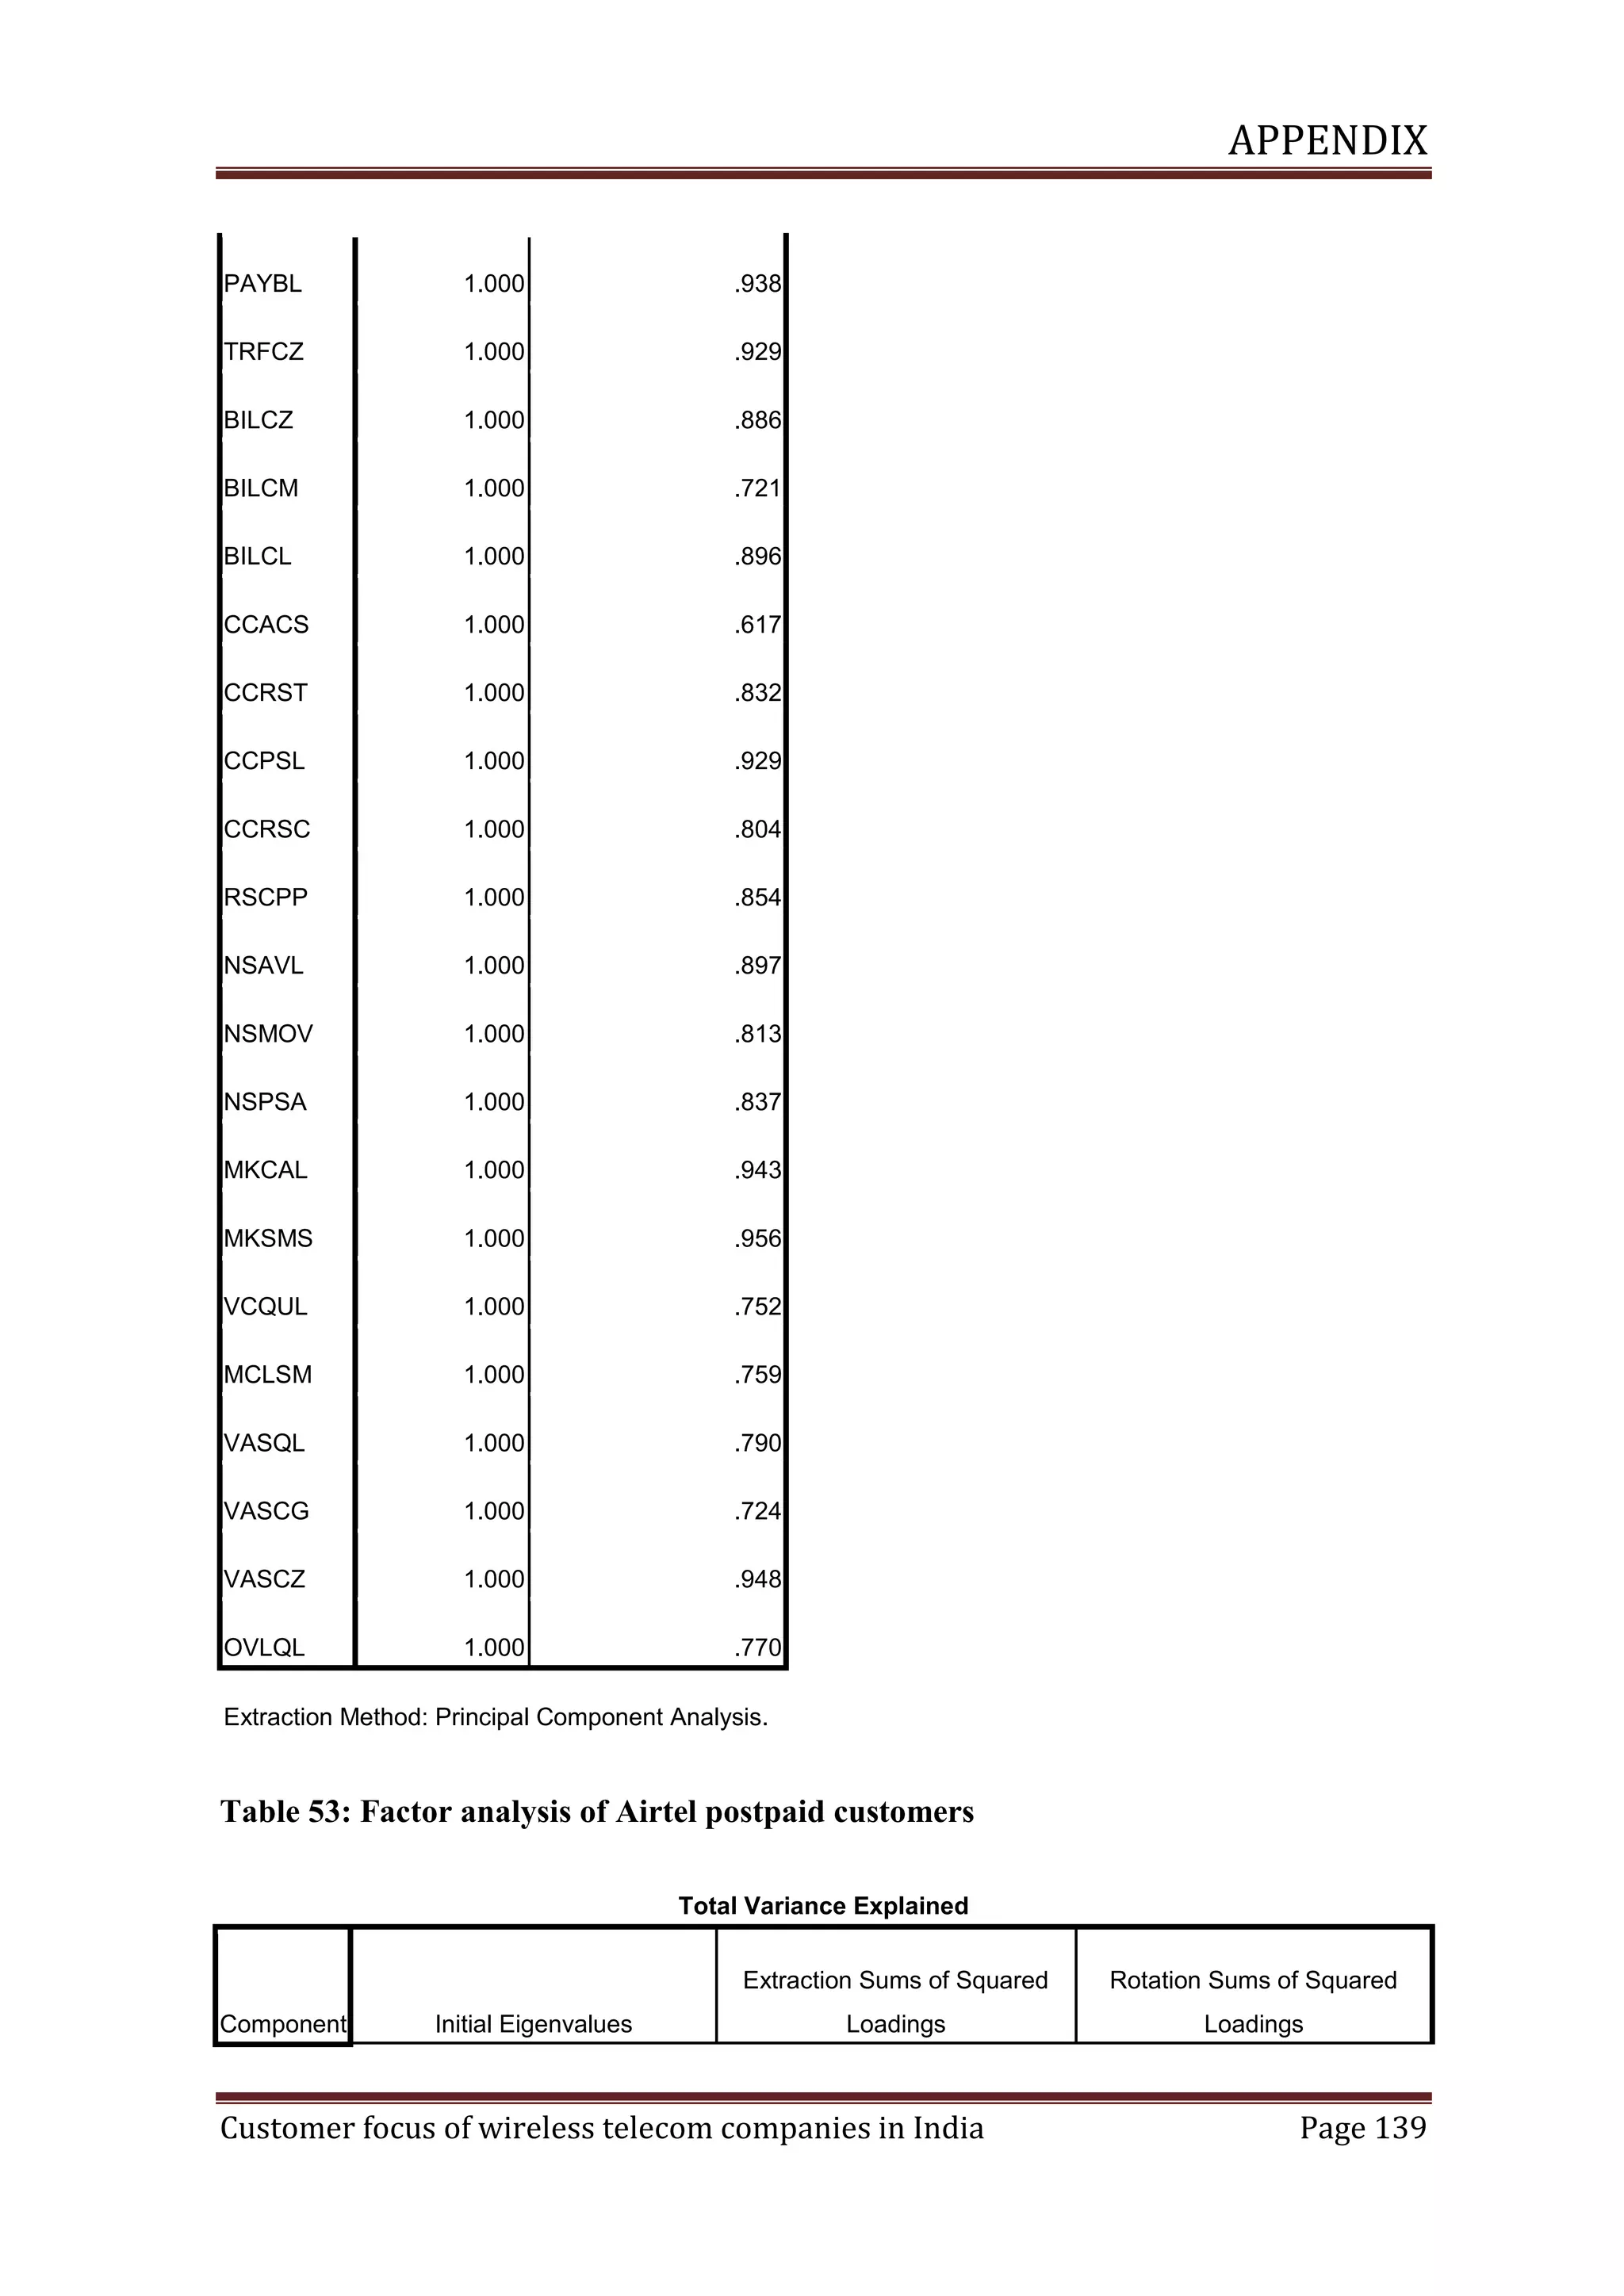
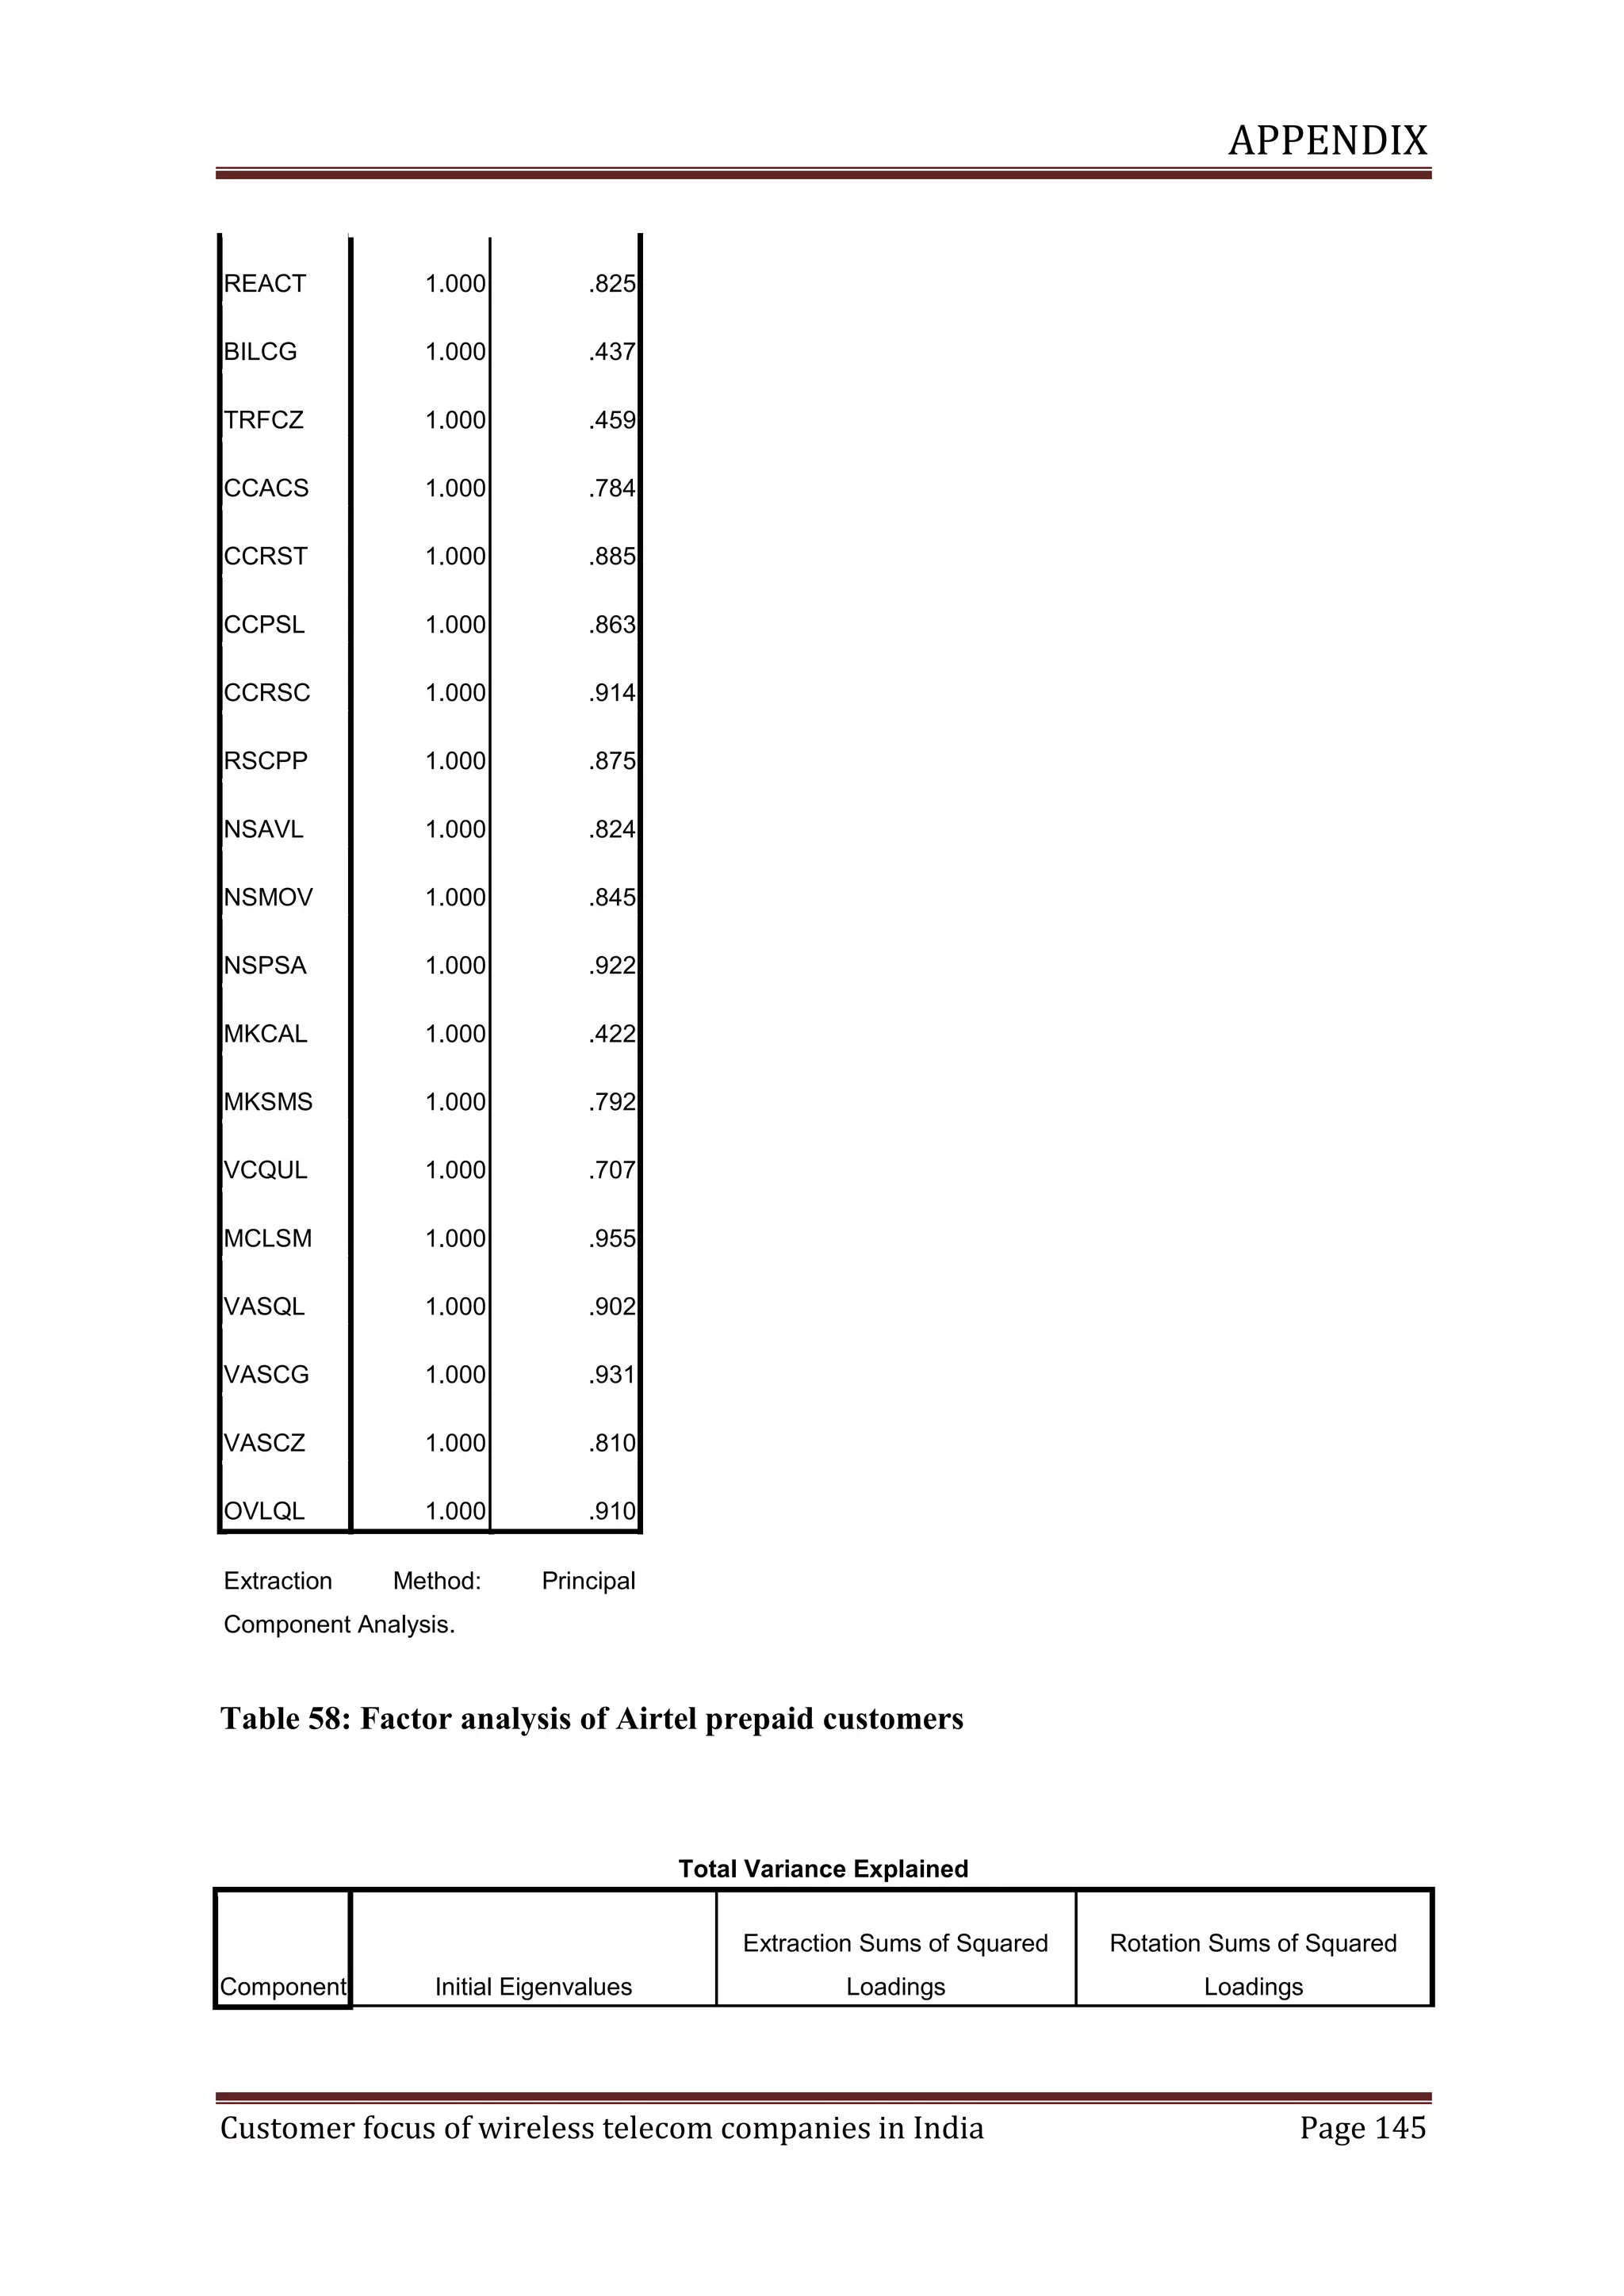
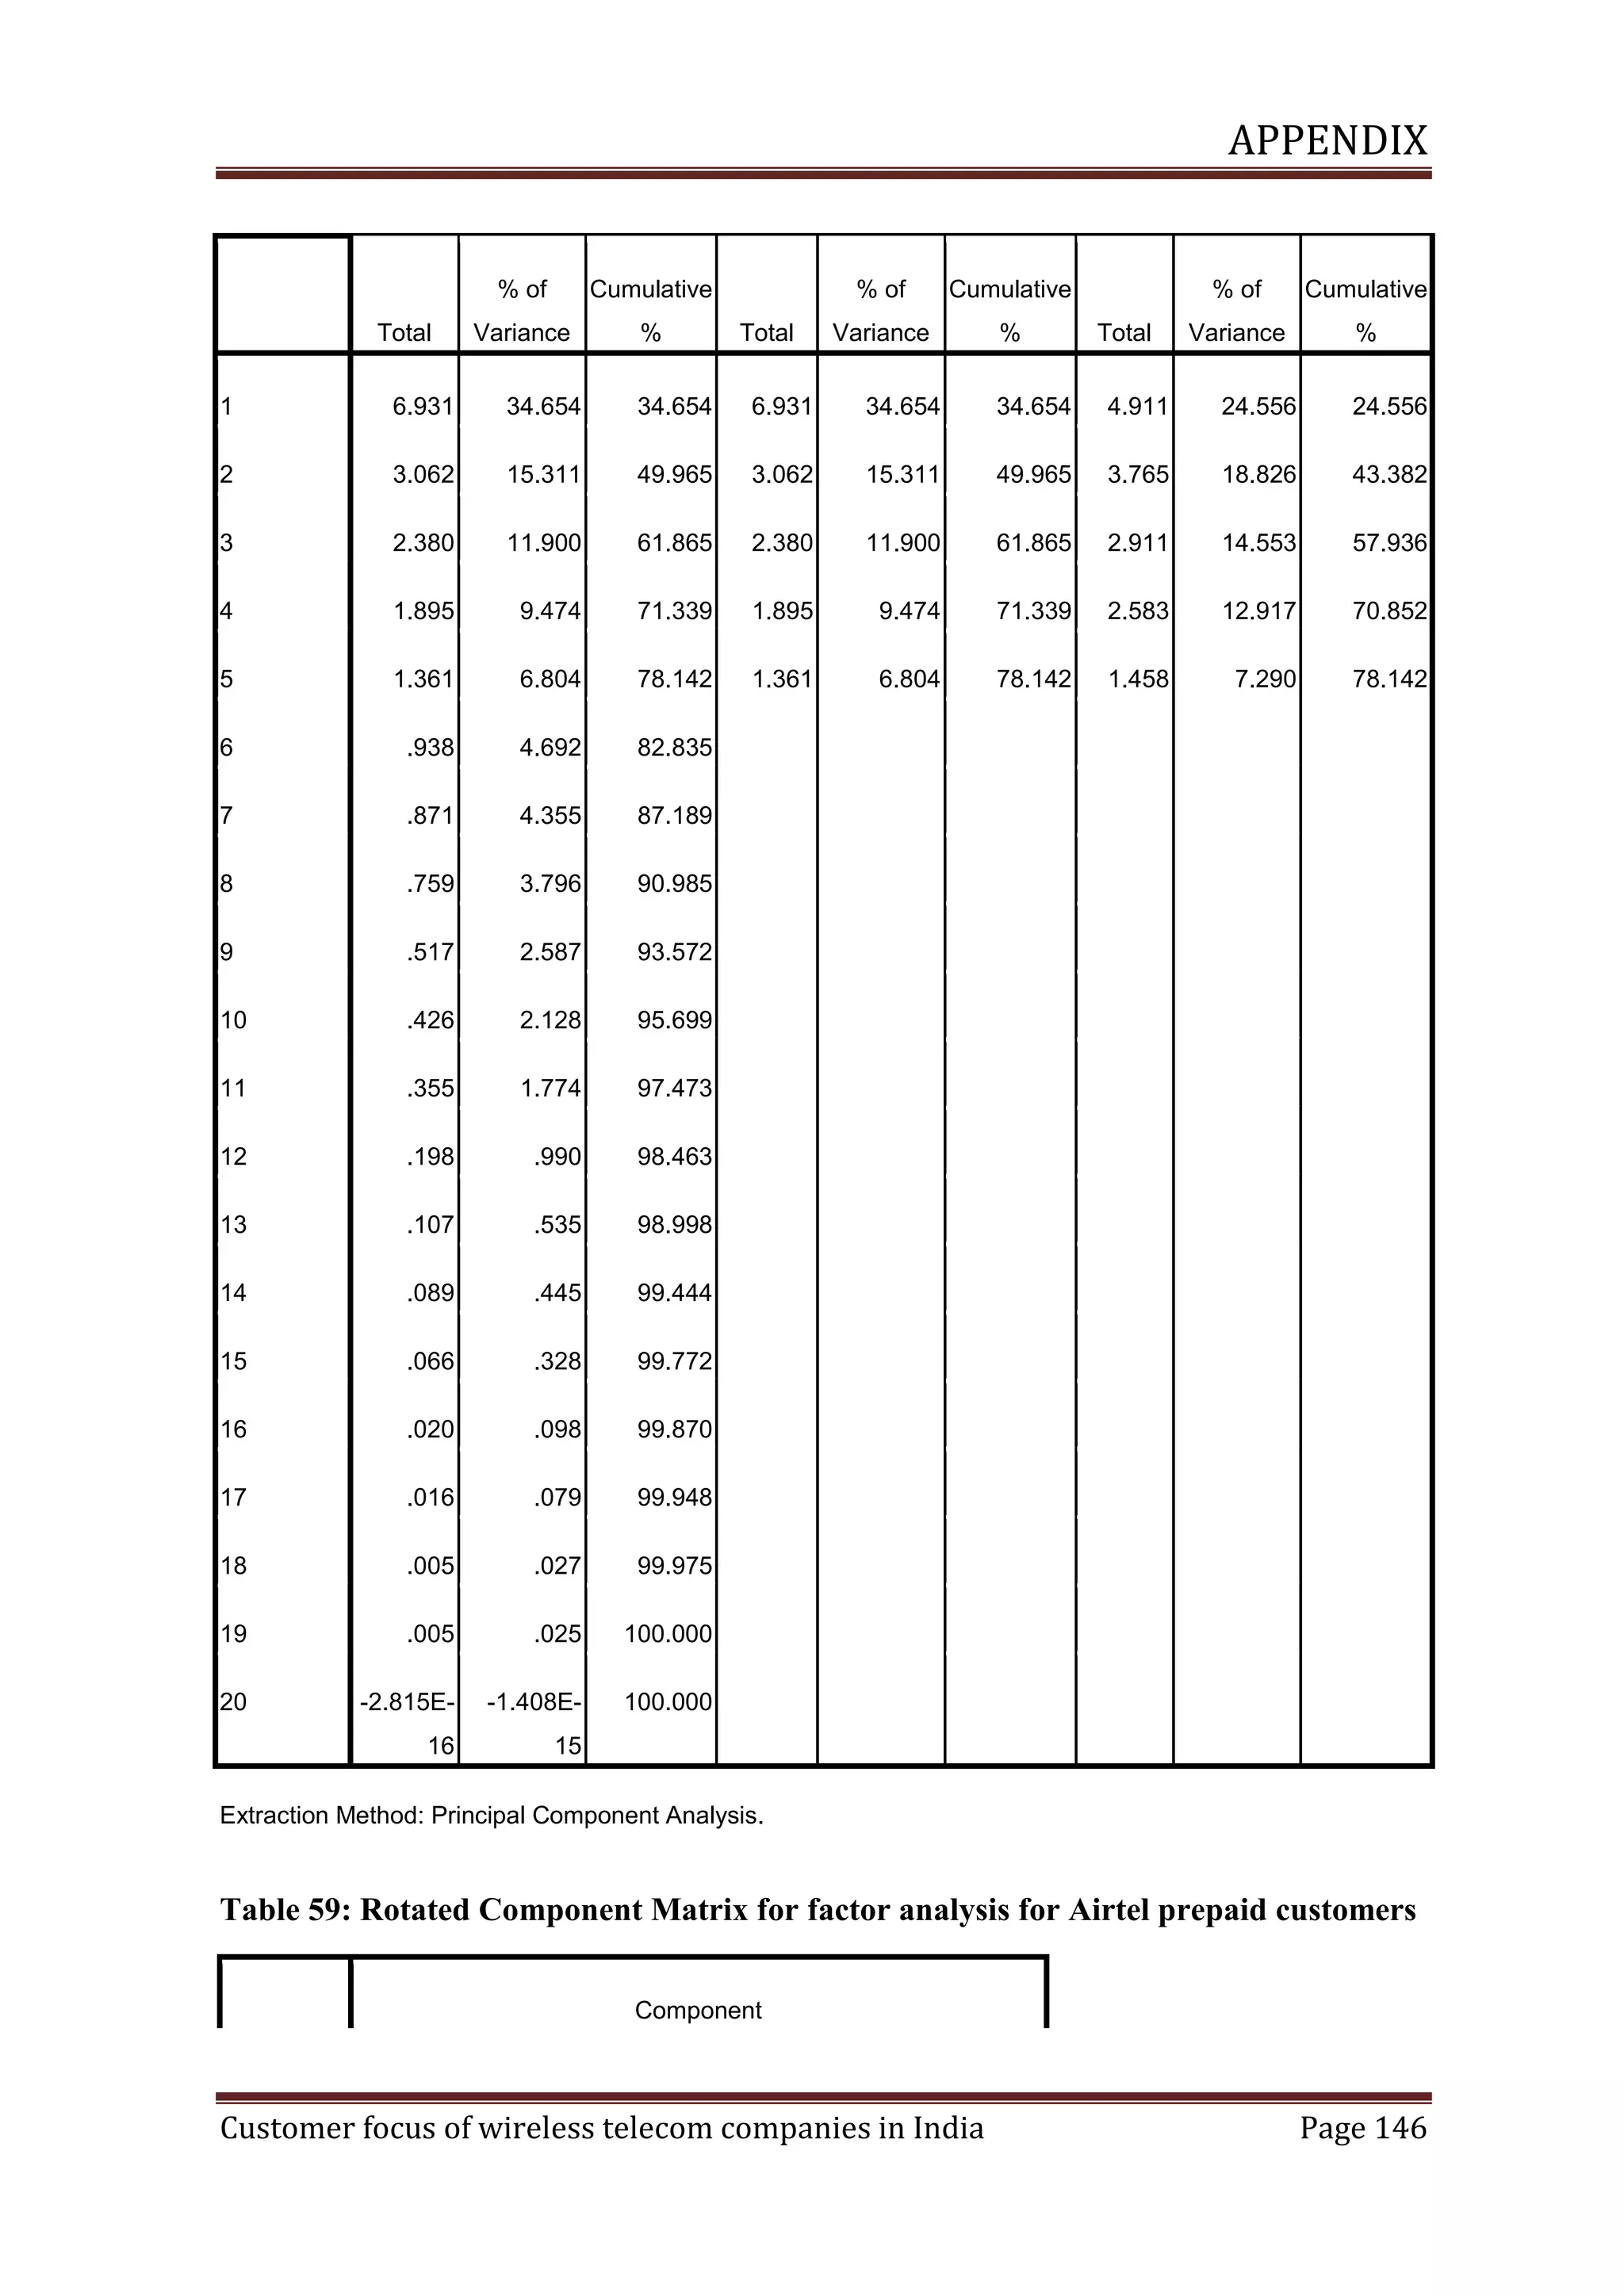
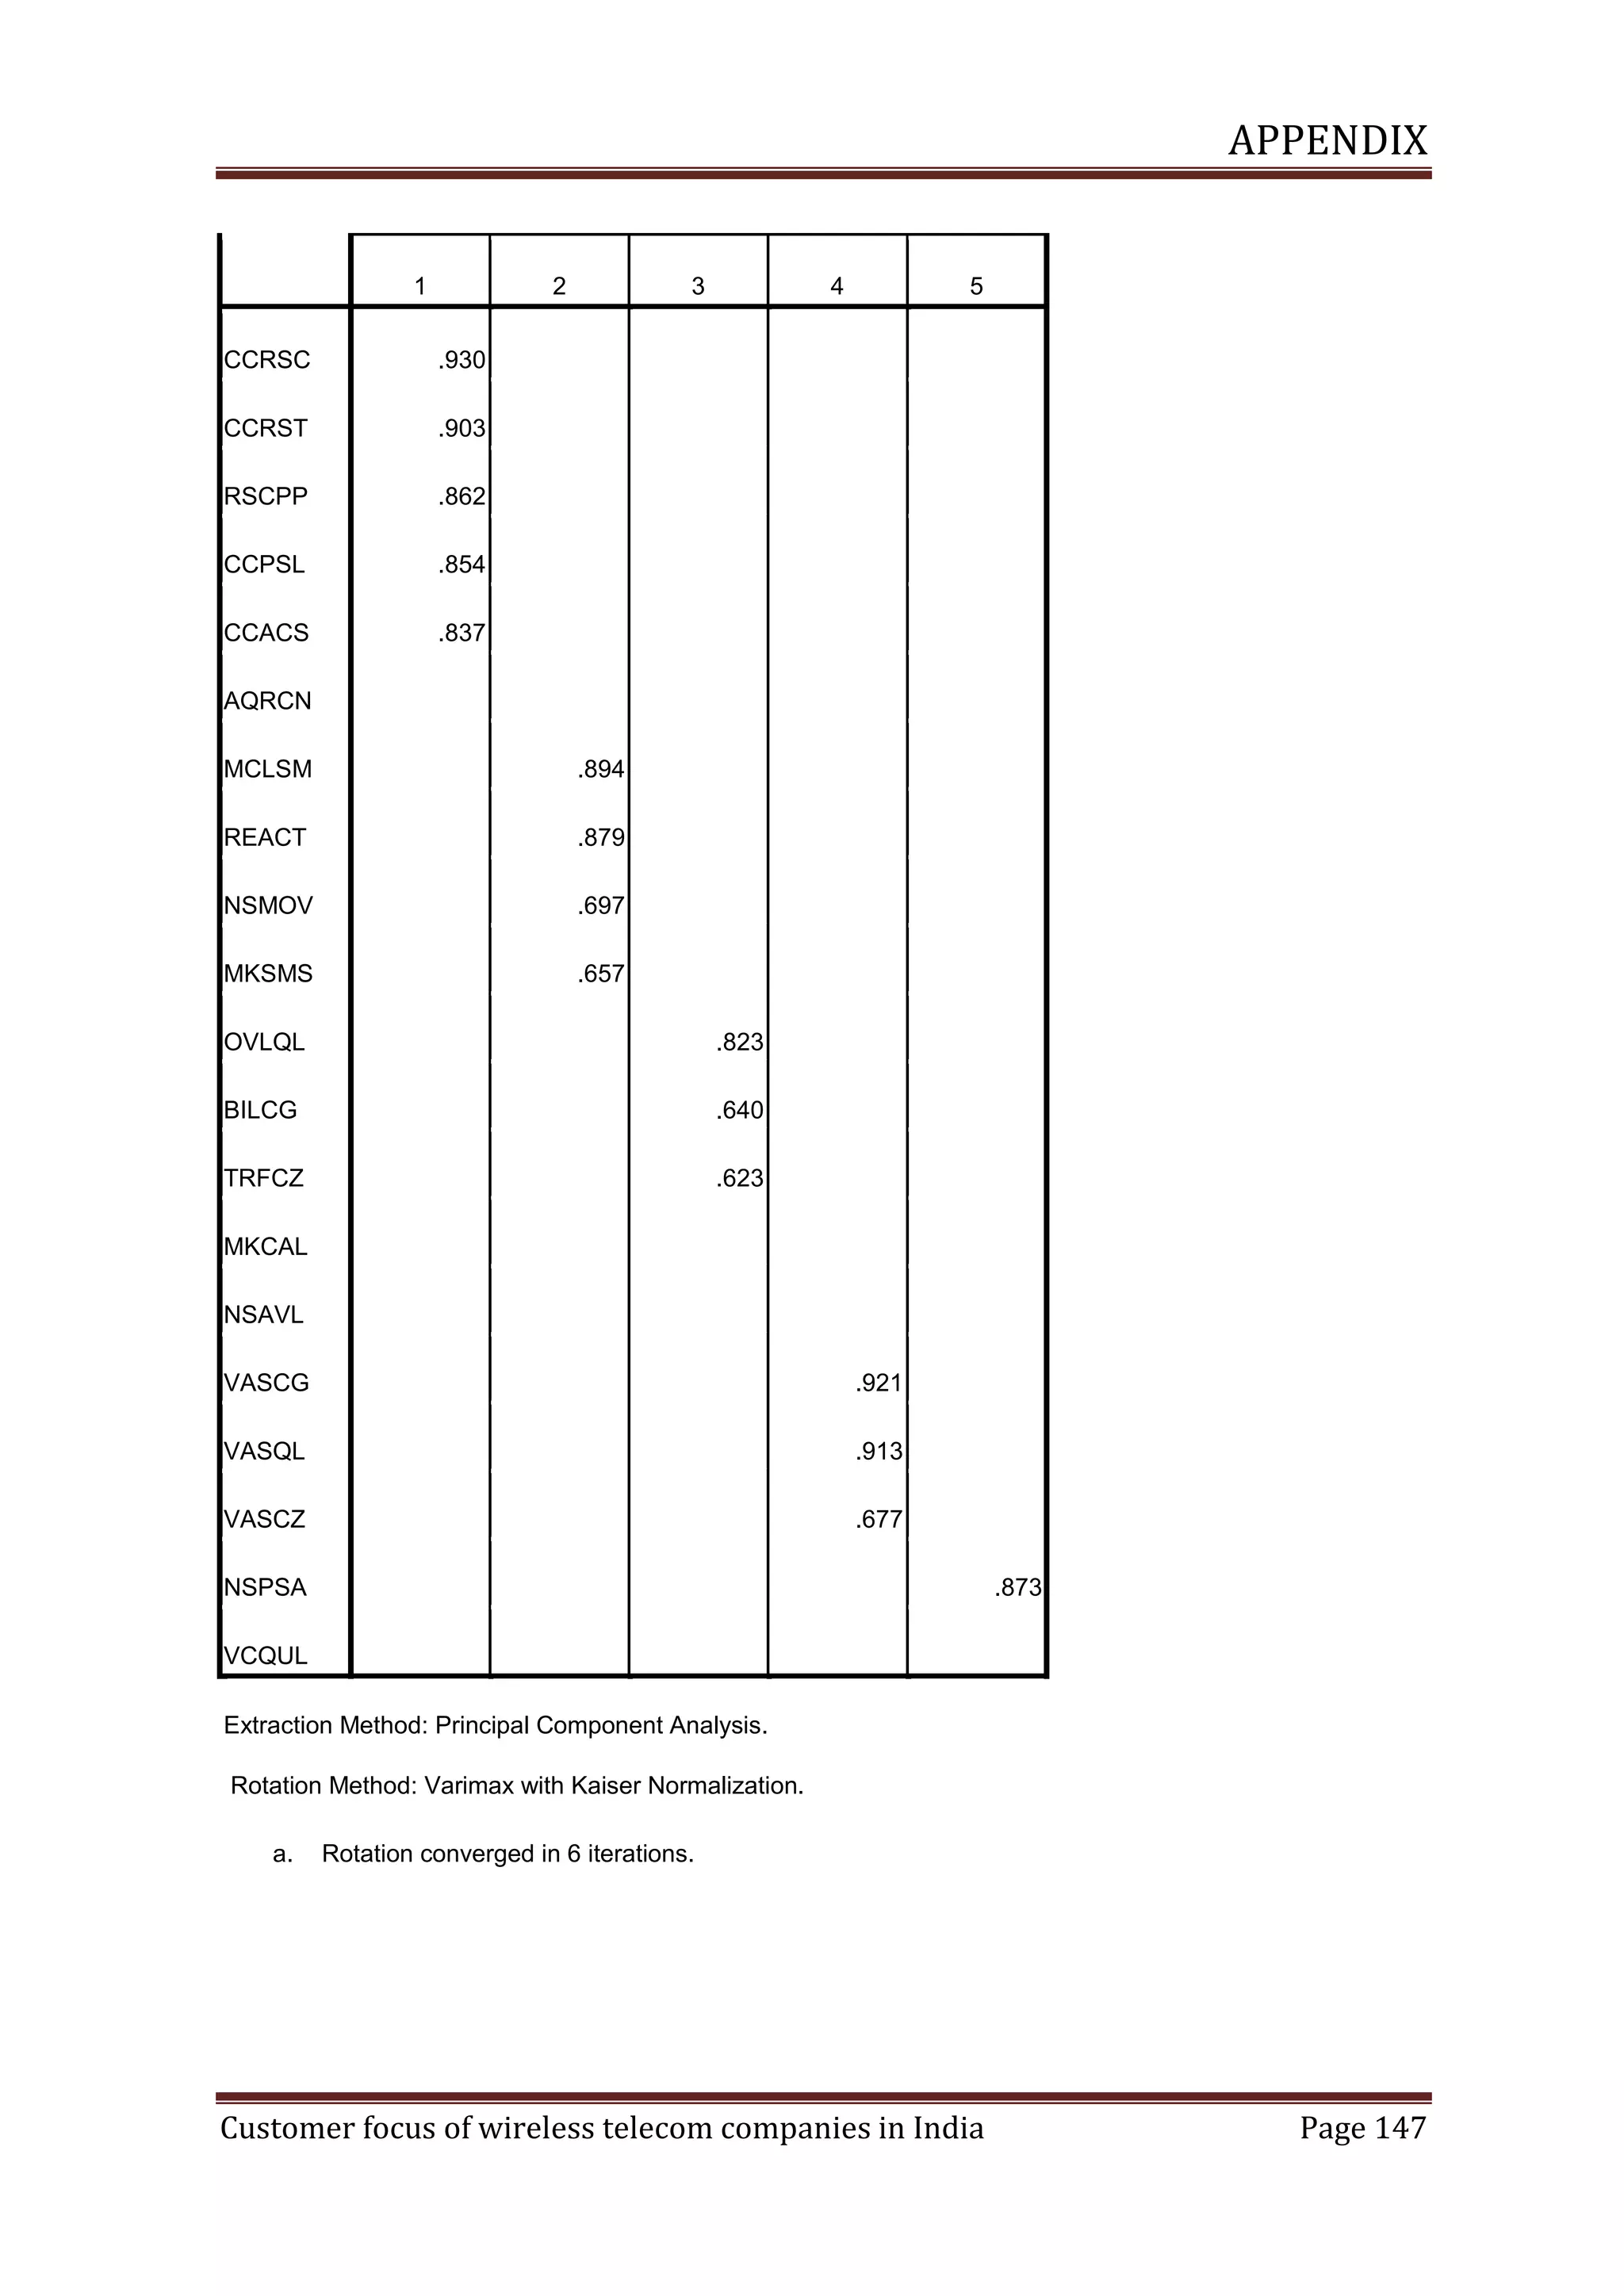
3.3 Factor analysis
The study uses factor analysis to reduce the number of variables affecting overall
satisfaction into factors which can explain the underlying behaviour of overall satisfaction.
According to SPSS also known as Statistical Package for Social Sciences
[23]
, Factor
analysis attempts to identify underlying variables, or factors, and that explain the pattern of
correlations within a set of observed variables. Factor analysis is often used in data
reduction to identify a small number of factors that explain most of the variance that is
observed in a much larger number of manifest variables. Factor analysis can also be used to
generate hypotheses regarding causal mechanisms or to screen variables for subsequent
analysis (for example, to identify co-linearity prior to performing a linear regression
analysis).
The assumptions made are that the data should have a bivariate normal distribution for each
pair of variables, and observations should be independent. The factor analysis model
specifies that variables are determined by common factors (the factors estimated by the
model) and unique factors (which do not overlap between observed variables); the
Customer focus of wireless telecom companies in India
Page 17](https://image.slidesharecdn.com/satyafinalproject-140224205709-phpapp02/75/Satya-final-project-34-2048.jpg)
![THEORETICAL BACKGROUND
computed estimates are based on the assumption that all unique factors are uncorrelated
with each other and with the common factors.
The method used is Principal Components Analysis. It is a factor extraction method used to
form uncorrelated linear combinations of the observed variables. The first component has
maximum variance. Successive components explain progressively smaller portions of the
variance and are all uncorrelated with each other. Principal components analysis is used to
obtain the initial factor solution.
Scree plot is the plot of the variance that is associated with each factor. This plot is used to
determine how many factors should be kept. Typically the plot shows a distinct break
between the steep slope of the large factors and the gradual trailing of the rest (the scree).
Varimax Method is an orthogonal rotation method that minimizes the number of variables
that have high loadings on each factor. This method simplifies the interpretation of the
factors.
Thus using factor analysis we will able to find the underlying factors behind the satisfaction
of customers from telecom services. Using these factors we can be able to build a model for
satisfaction from telecom services.
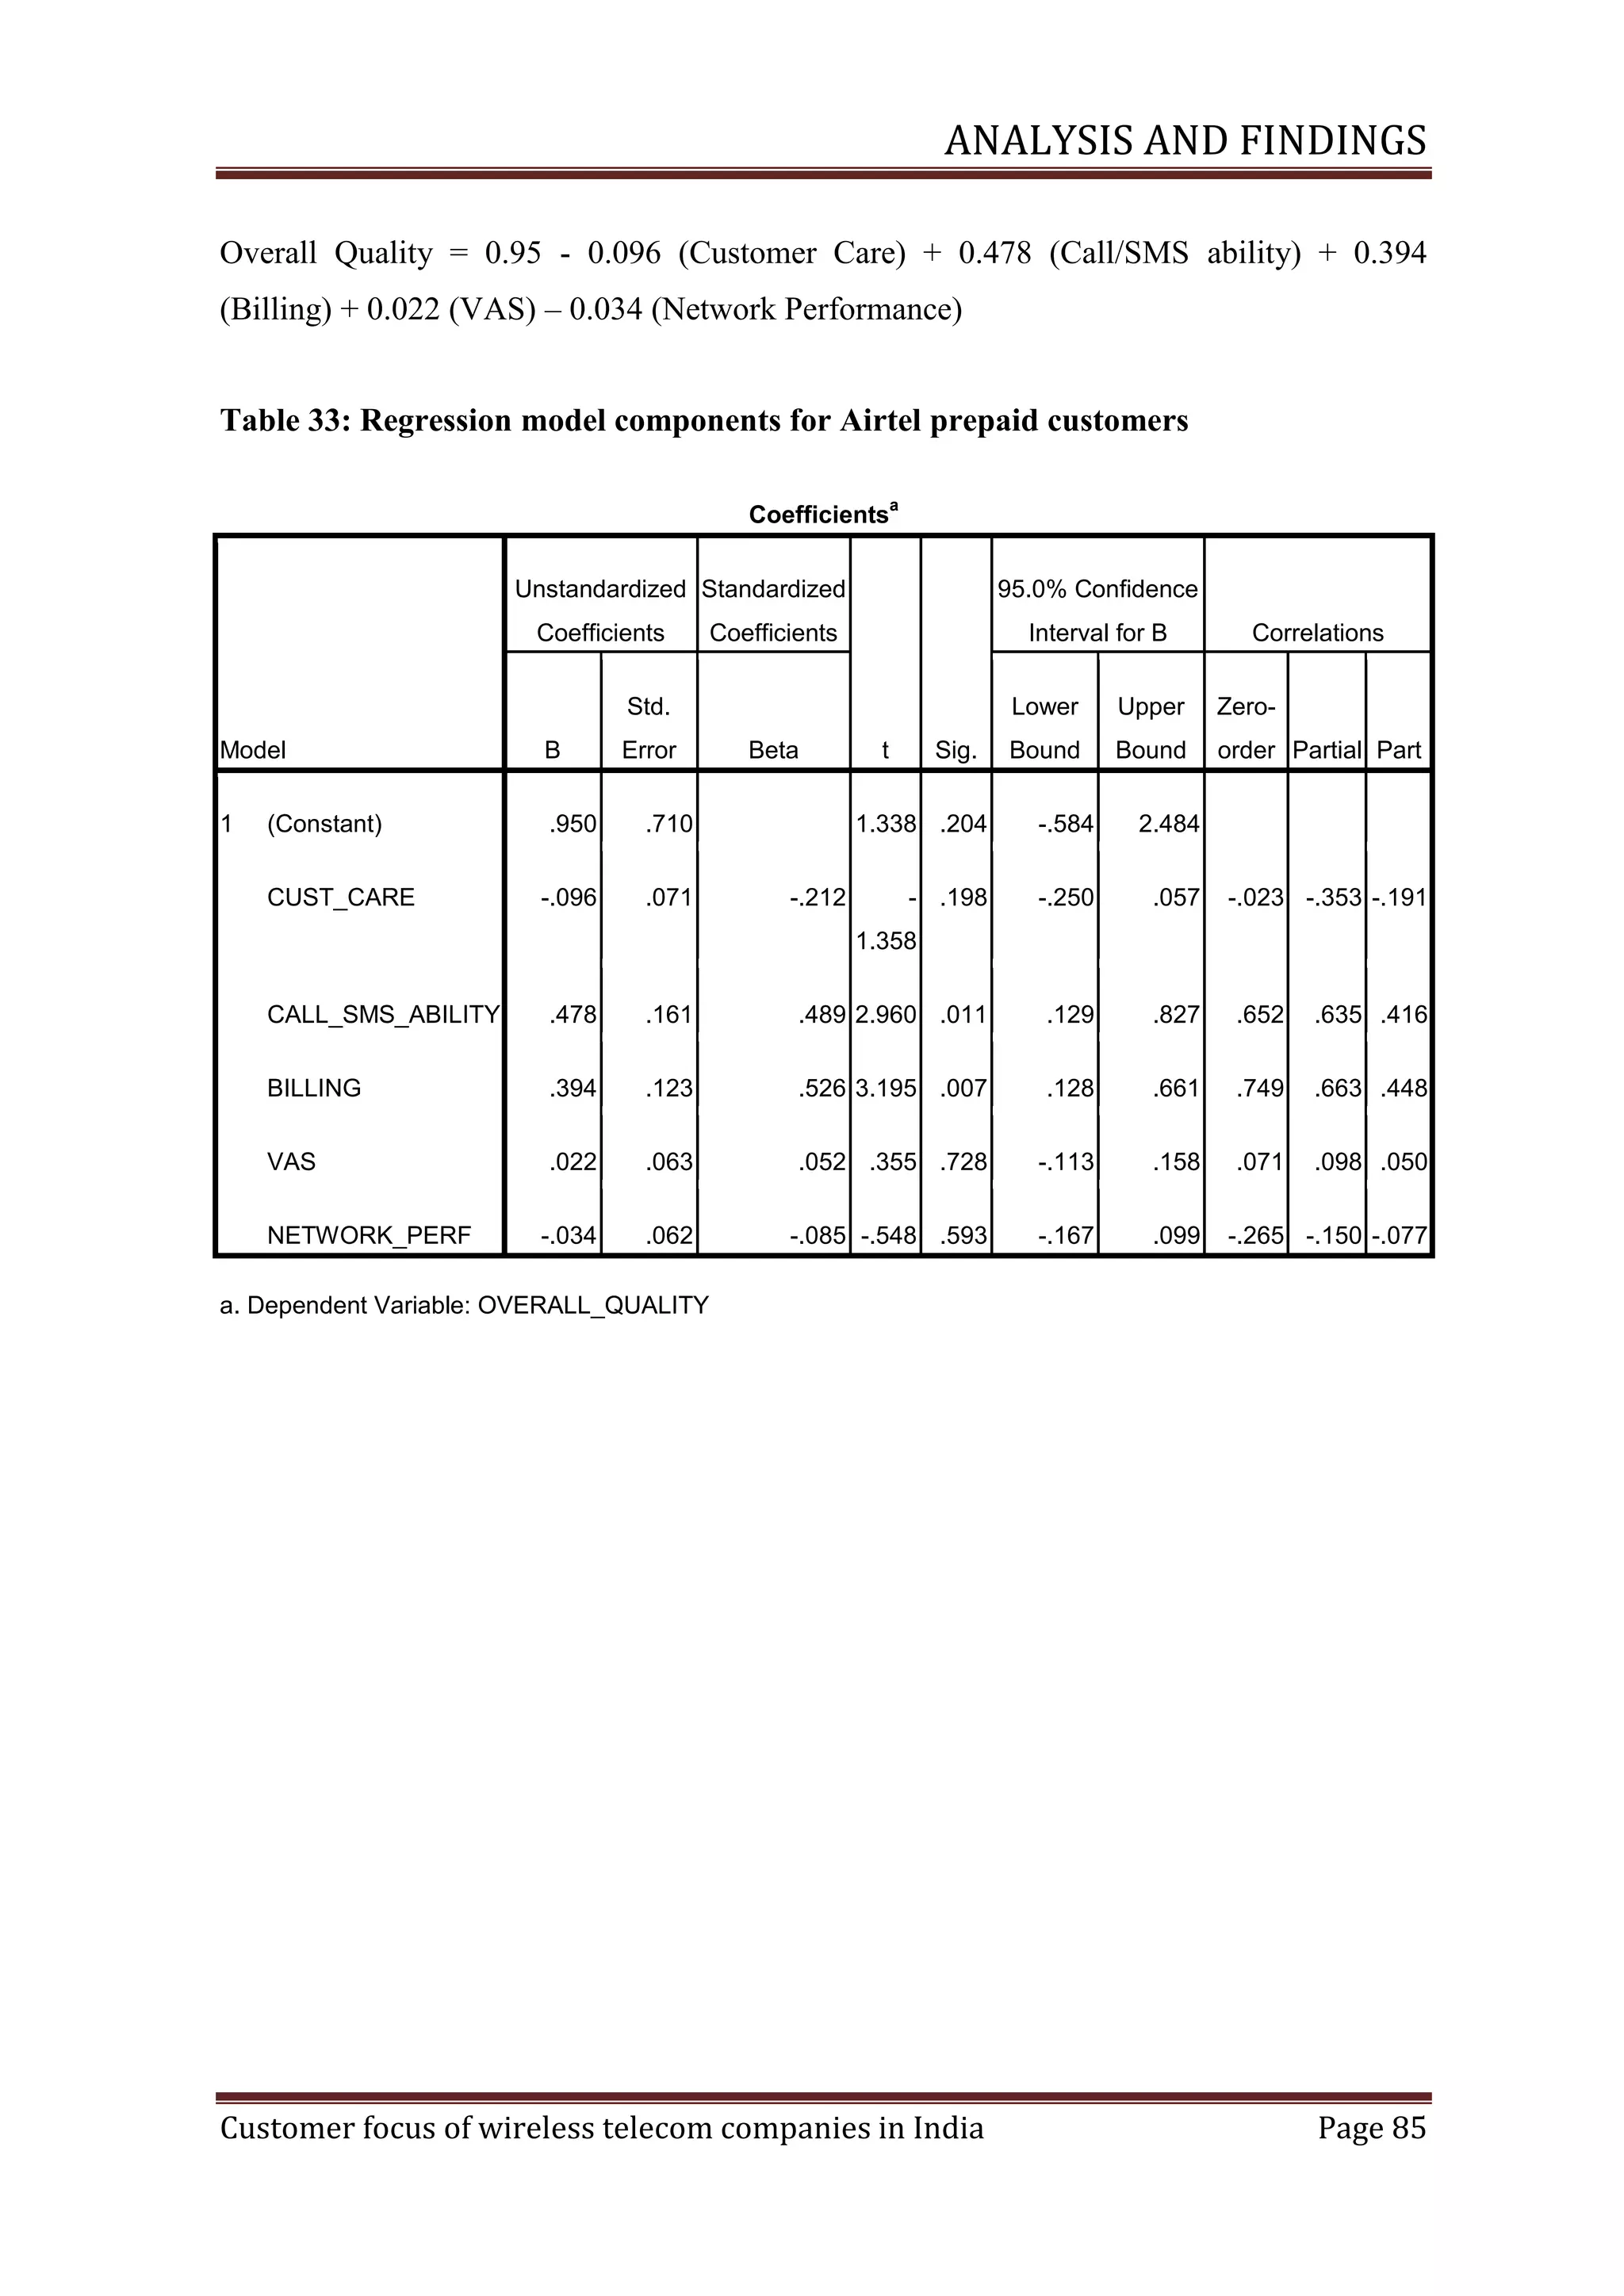
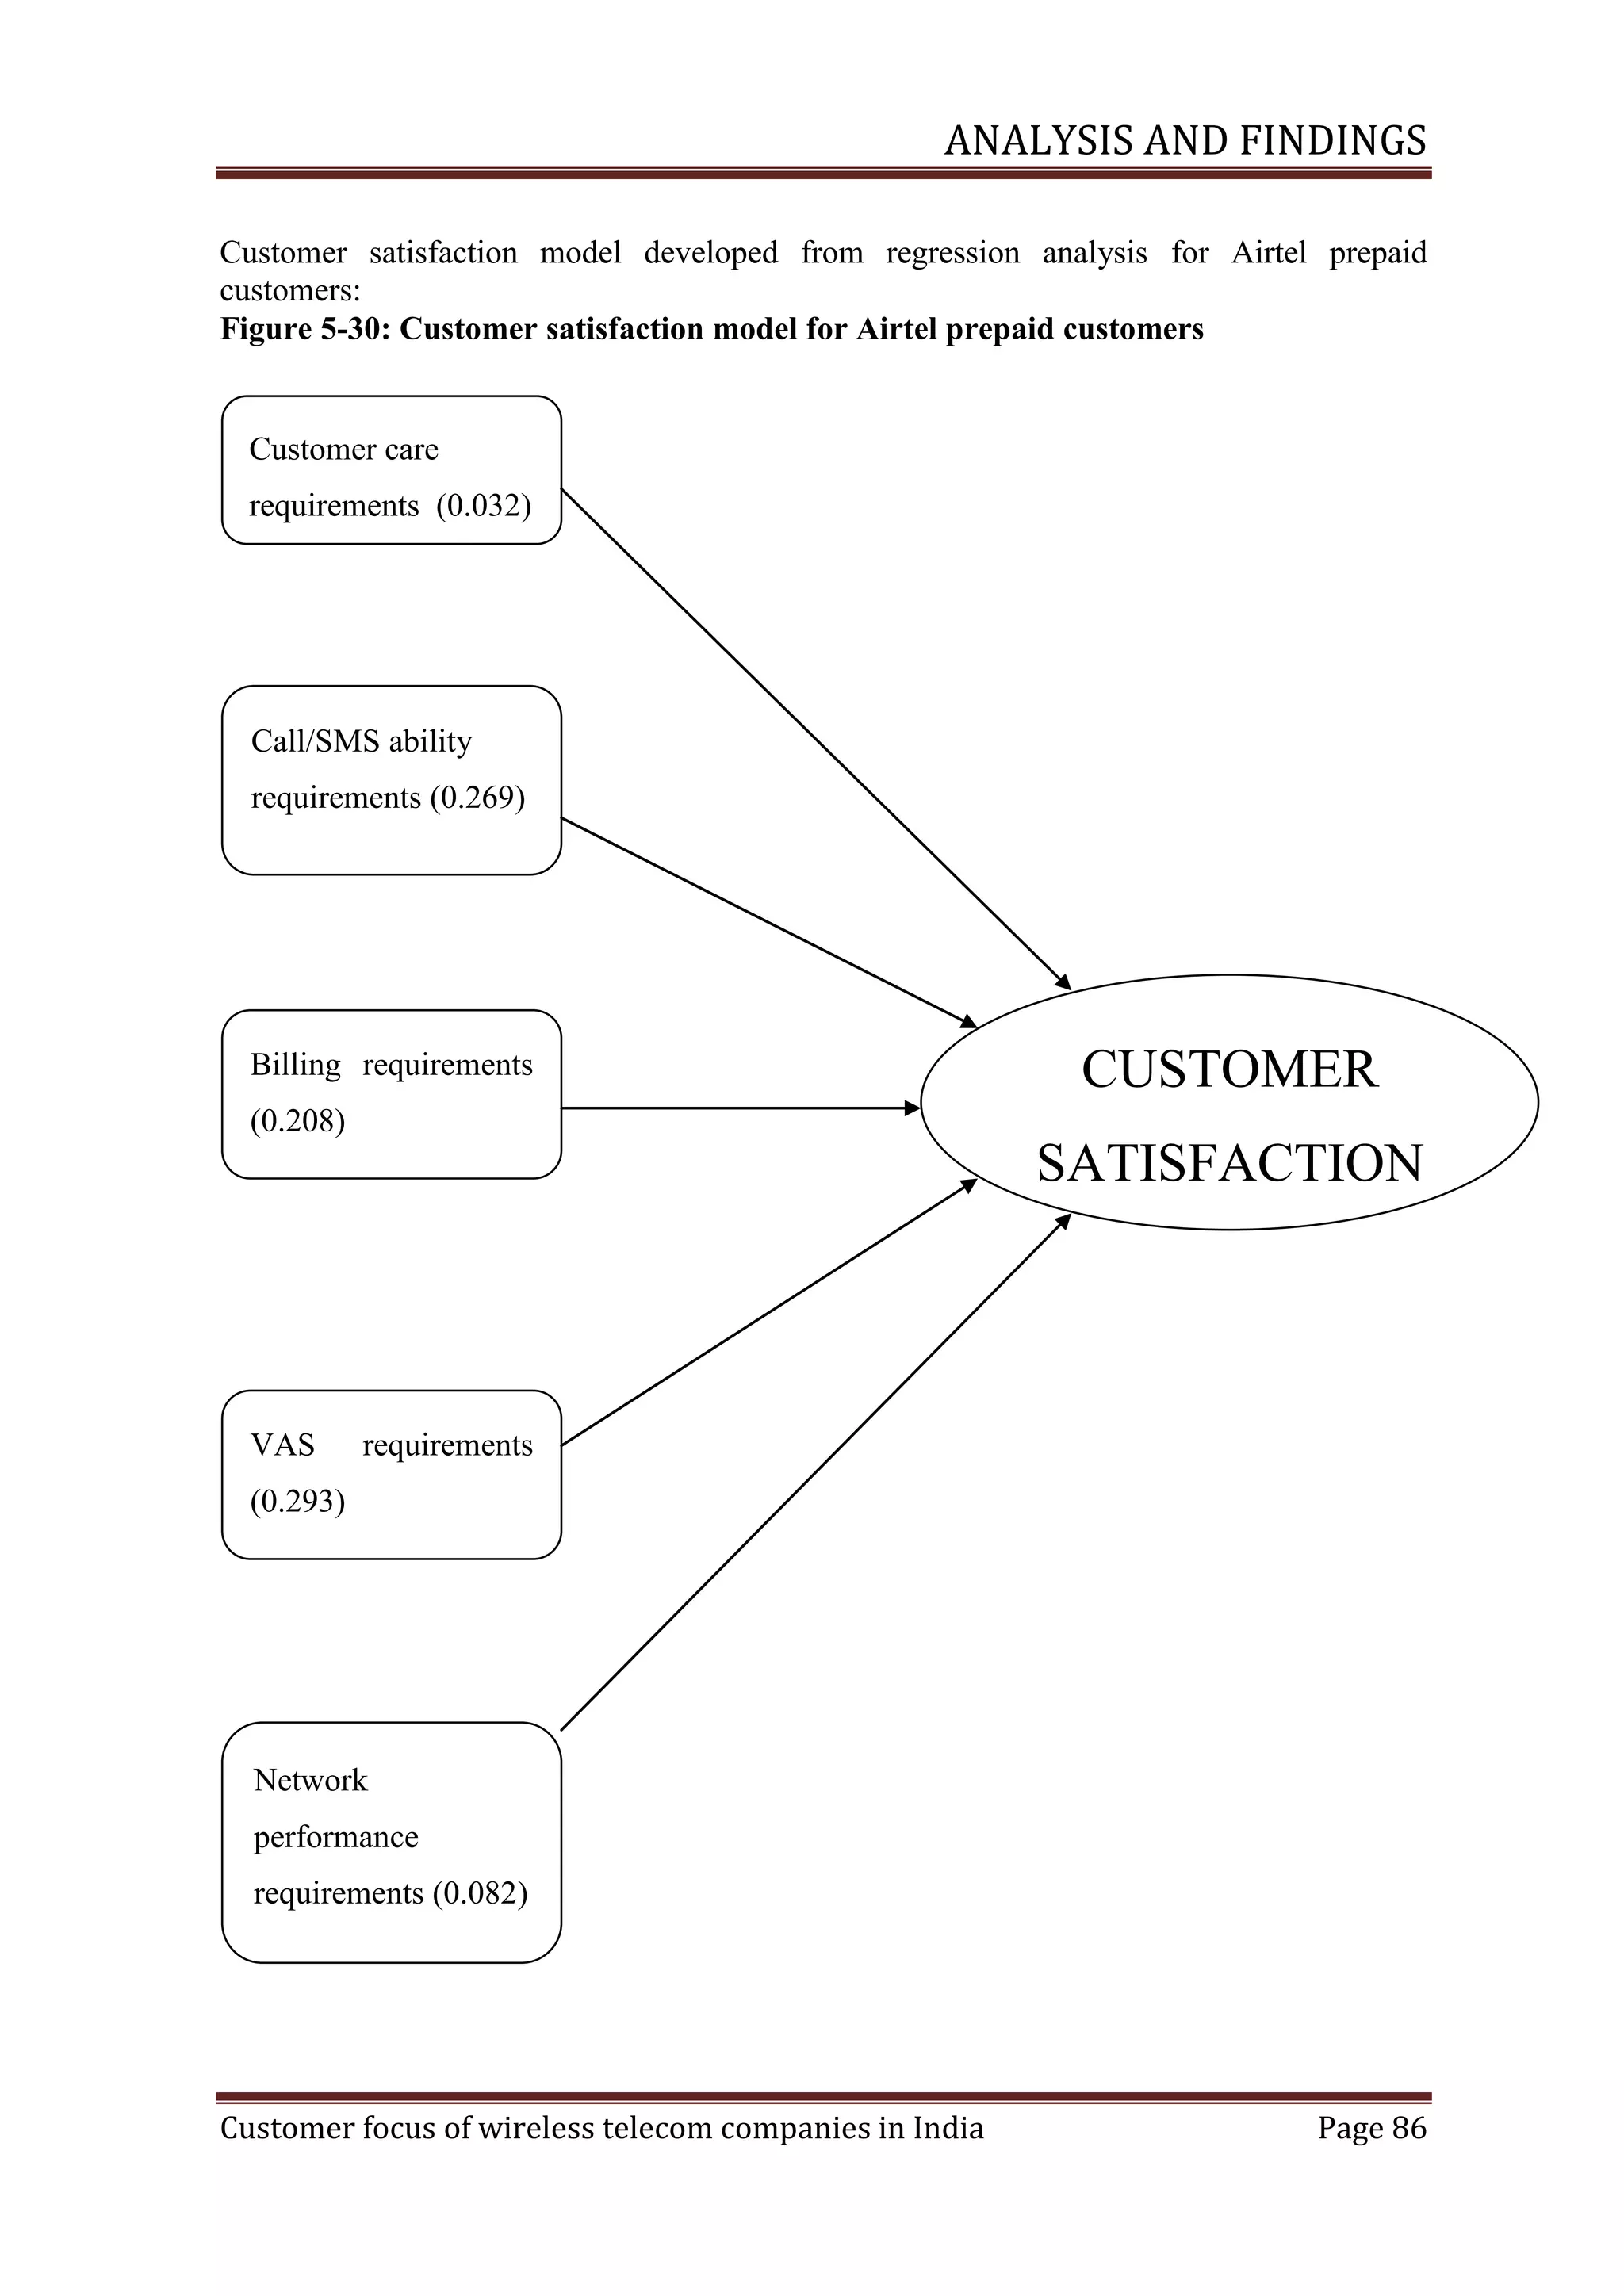
3.4 Multivariate regression analysis
Multivariate regression analysis has been used in the study to find the relationship between
factors affecting overall satisfaction and the overall satisfaction level.
According to Field [10], Linear Regression estimates the coefficients of the linear equation,
involving one or more independent variables that best predict the value of the dependent
variable.
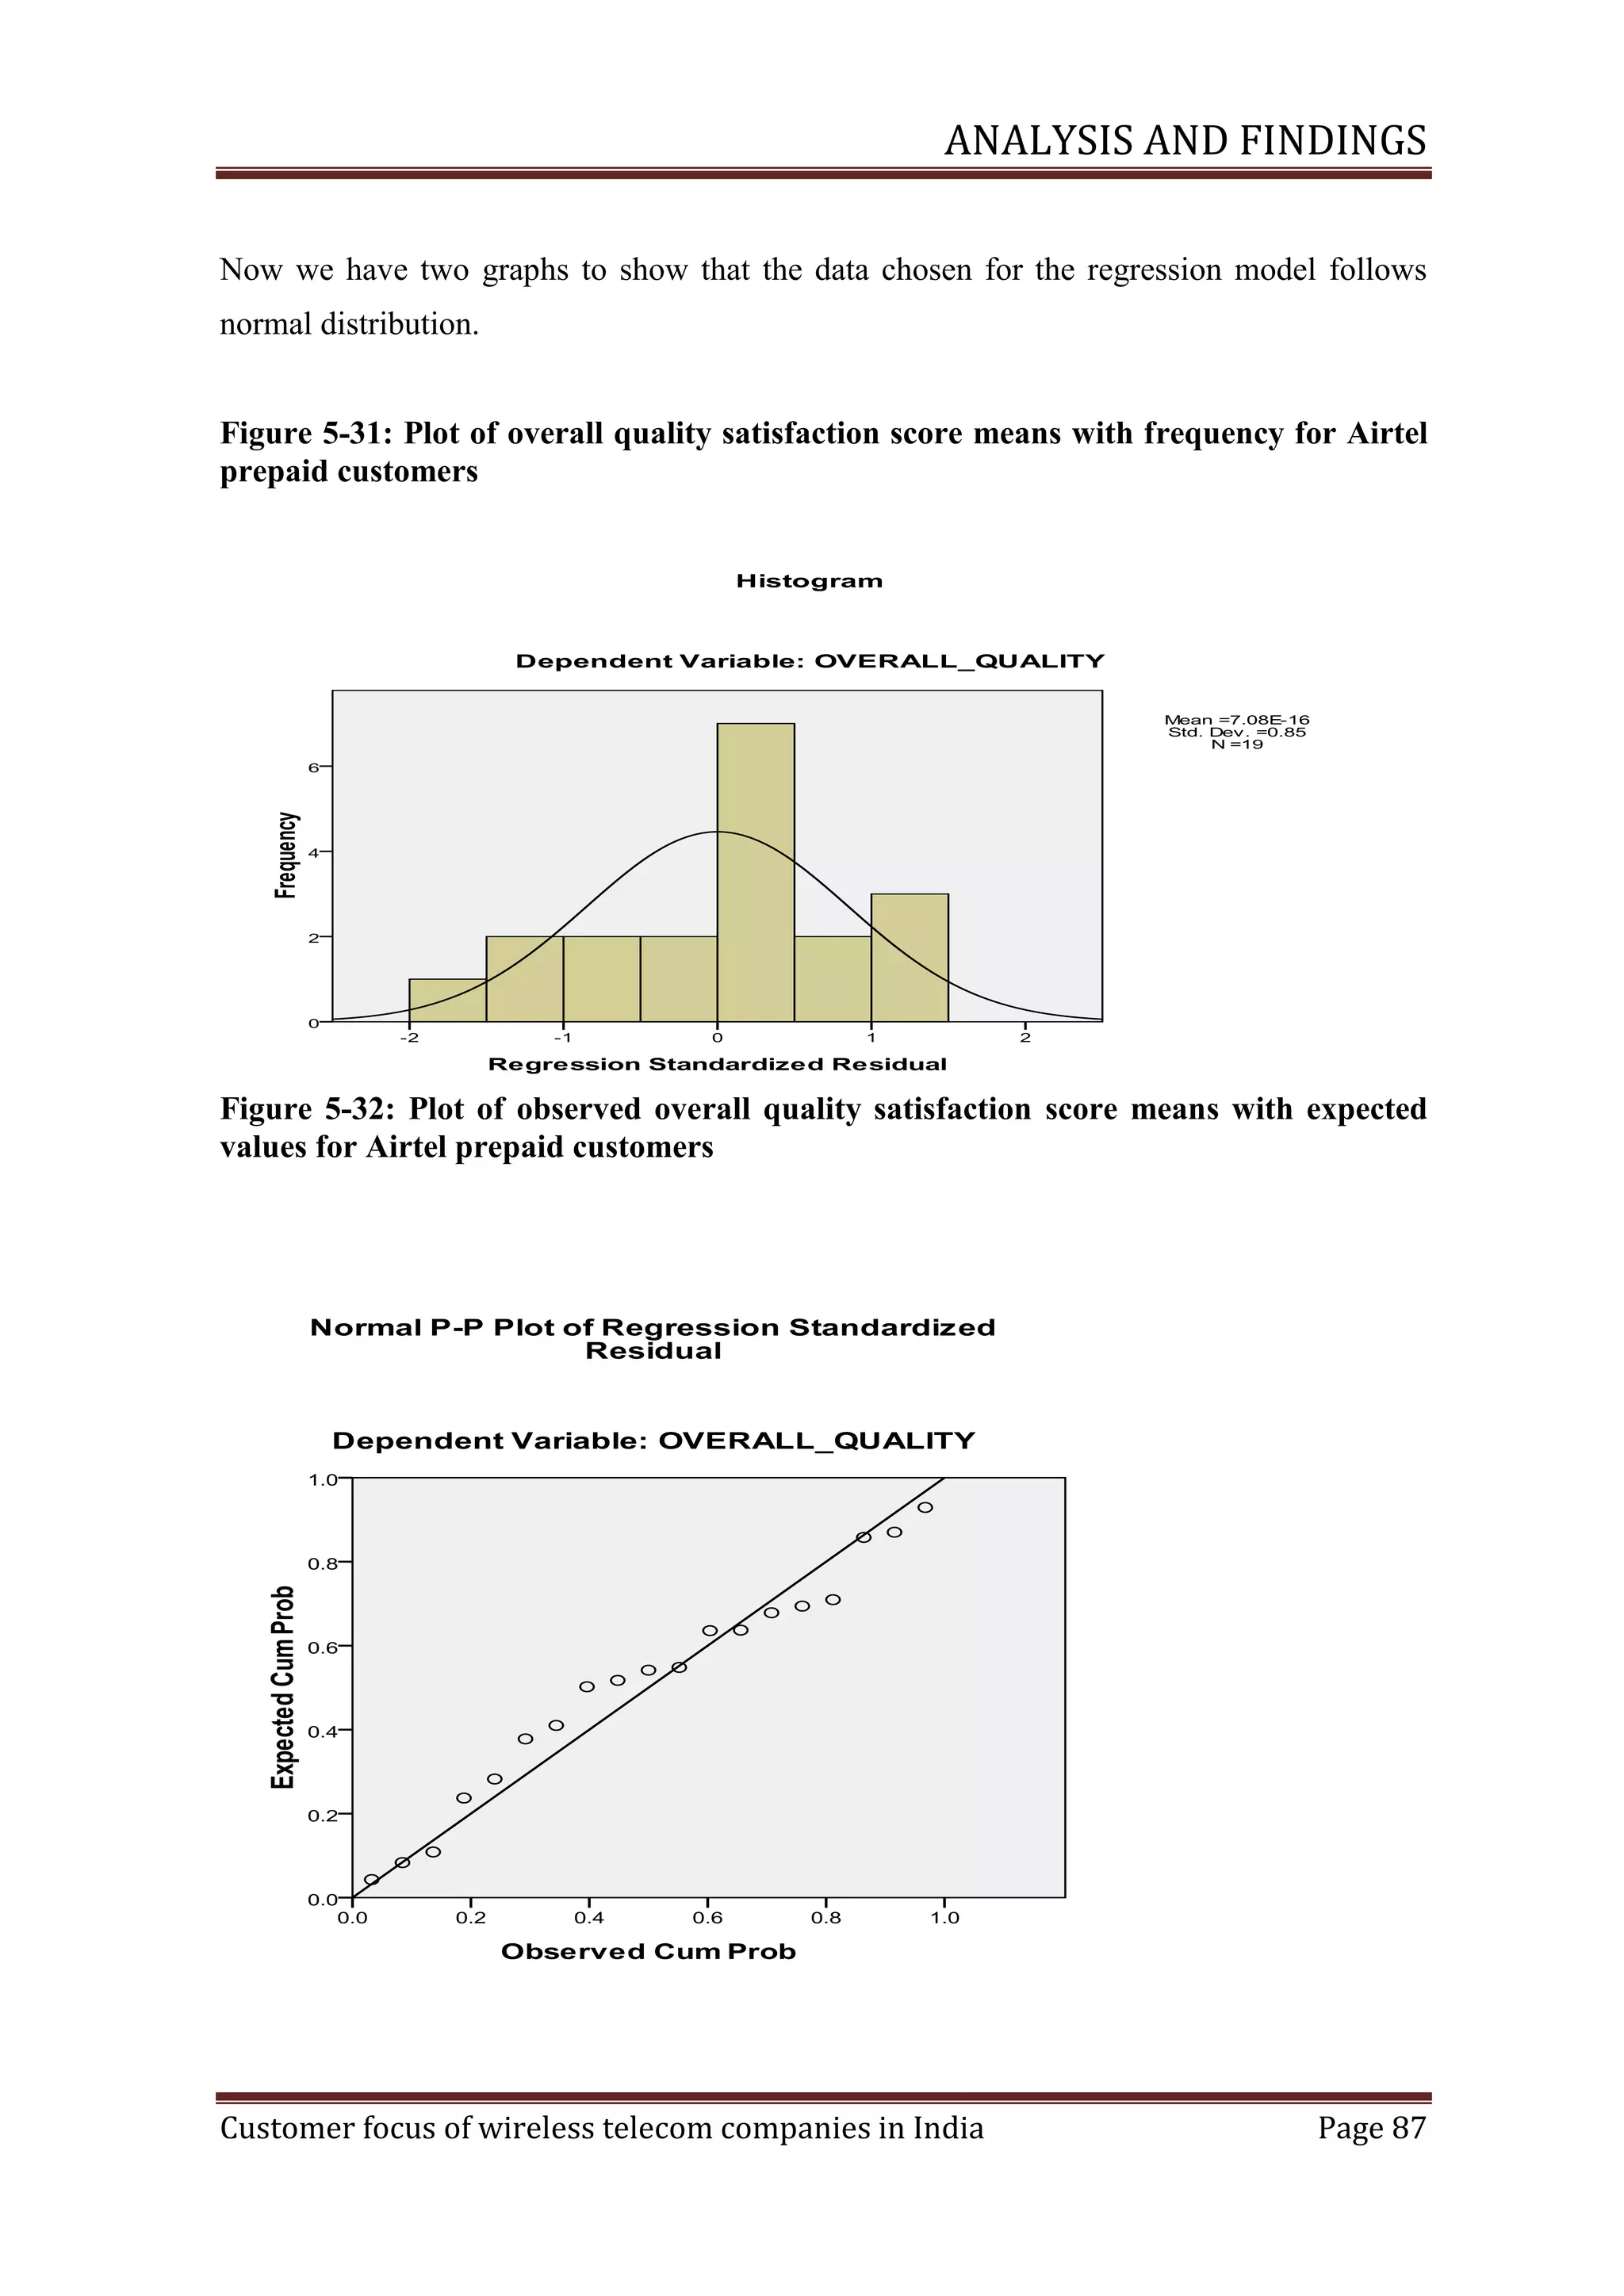
The assumptions for using this analysis are that for each value of the independent variable,
the distribution of the dependent variable must be normal. The variance of the distribution
of the dependent variable should be constant for all values of the independent variable. The
relationship between the dependent variable and each independent variable should be linear,
and all observations should be independent.
Customer focus of wireless telecom companies in India
Page 18](https://image.slidesharecdn.com/satyafinalproject-140224205709-phpapp02/75/Satya-final-project-35-2048.jpg)


![ANALYSIS AND FINDINGS
which can make maximum impact on people‘s lives as they are having above 90 million
subscribers.
5.2.2 Partners
According to their official website, the major partners of Bharti Airtel are:
Table 12:Airtel’sstrategicpartners
Network
Network Equipment
Nokia Siemens, Ericsson, Huawei
Equipment
Telemedia
&
Distance Services
Long Nokia Siemens, Wipro, Cisco, Alcatel
Lucent, ECI, Tellabs
Information Technology
IBM
Call Centre Operations
IBM
Daksh,
Hinduja
TMT,
Teleperformance,
Mphasis, Firstsource & Aegis
Equity Partner {Strategic}
Singtel
5.2.3 Swot analysis
According to Datamonitor [8], Bharti Airtel being in a highly competitive telecom industry
is still the leading provider of telecom services in India. Integrated operations and strategic
partnerships provide a competitive advantage to the company as it allows the company to
control the quality of services delivery and brand offerings. However, increasing
competition in the Indian telecom market could affect its market share in coming years.
Customer focus of wireless telecom companies in India
Page 39](https://image.slidesharecdn.com/satyafinalproject-140224205709-phpapp02/75/Satya-final-project-58-2048.jpg)


This document is a project report submitted by Satya Narayan Behera to fulfill requirements for a Master of Business Administration degree from Sri Sathya Sai University. The project analyzes the customer focus of wireless telecom companies in India. It includes chapters on an introduction to the wireless telecom industry, literature review on key concepts like customer focus and satisfaction, theoretical frameworks for analysis, methodology used in the study including data collection and analysis techniques, findings from analyzing survey and regulatory data on customer satisfaction with major operators, and conclusions and recommendations. The overall goal is to evaluate telecom service providers' focus on customers and quality of service in India's competitive telecom environment.


![Coded Agents – with UiPath SDK + LangGraph [Virtual Hands-on Workshop]](https://cdn.slidesharecdn.com/ss_thumbnails/codedagentsdeck-251215155422-5497c599-thumbnail.jpg?width=640&height=640&fit=bounds)


