This document contains data comparing the 2011 targets and 2010 results for three Malaysian public examinations - UPSR, PMR, and SPM - in Penang state versus the national averages. For each exam and subject, it provides the 2010 pass rate for Penang and nationally, the 2011 Penang target pass rate, and the 2010 and 2011 GPMP (grade point average) targets for Penang and nationally. It also compares the overall 2010 results and 2011 targets for Penang versus the national level.
This document provides labor force statistics for the United States, Indiana, and various metropolitan and county areas within Indiana. It includes data on labor force, employment, unemployment, and unemployment rates for January 2013, December 2012 (revised), and January 2012 (benchmark). The reader is advised to use caution when viewing the monthly estimates as indicators of economic change due to irregular fluctuations.
The document provides demographic information about the Mackay Regional Council area in Queensland, Australia from the 2006 census and 2008 population estimates. It includes:
1) The estimated resident population of the Mackay Regional Council LGA was 112,607 persons in 2008, with an average annual growth rate of 3.2% between 2003 and 2008.
2) The largest urban center is Mackay with a population of 74,236 persons, and the LGA population is projected to reach 166,958 persons by 2026.
3) At the 2006 census, 3,933 persons identified as Indigenous, making up 3.9% of the total LGA population.
This document is a monthly report from November 2008. It includes 7 sections that analyze financial data from 2007 and provide accounting examples. The report summarizes the company's financial performance in November, compares 2007 and 2008 sales data, and gives hypothetical examples to demonstrate accounting principles for assets, liabilities, equity, and net income calculations.
Real Estate Market and Home Sales Report for Magnolia TX | December 2013Ken Brand
This real estate report summarizes home sales data in Magnolia, TX for the past two years. It provides monthly breakdowns of average and median home sale prices, average price per square foot, and average days on the market. It also includes data on inventory levels and number of homes sold each month to give context to the housing market dynamics.
Dokumen ini memberikan langkah-langkah untuk menghasilkan blog melalui platform Blogspot. Langkah pertama adalah mendaftar akaun Gmail untuk mendapatkan alamat email. Langkah kedua adalah log masuk ke Blogspot menggunakan email dan buat blog dengan memilih template dan nama blog.
Sasaran UPSR, PMR, SPM & STPM 2011 JPN PULAU PINANGnorshipa
This document contains data comparing the 2011 targets and 2010 results for three Malaysian public examinations - UPSR, PMR, and SPM - in the state of Penang against national averages. For each exam and subject, it provides the 2010 pass rate for Penang and nationally, the 2011 Penang target pass rate, and the 2010 Penang and national average grades. It also aggregates some of the data and lists the 2011 targets for overall pass rates and average grades for each exam in Penang and nationally.
This document analyzes the results of the 2011 Lower Secondary Assessment (PMR) exam administered by SMK Seri Mahkota, Kuantan. It provides data on the overall pass rates from 2006 to 2011, showing that the 2011 pass rate was 70.81% with 13.09% achieving straight As. Pass rates for the various subjects like Bahasa, Science, and Mathematics from 2006 to 2011 are also presented, with most around 90-95%. The top 8 students who achieved straight As are also listed.
This document analyzes the results of the 2011 Sijil Pelajaran Malaysia (SPM) or Malaysian Certificate of Education examinations for SMK Seri Mahkota, Kuantan. It provides data on the number of candidates, pass rates, and average school grades over several years. Pass rates for various subjects are also shown and the top 19 students from 2011 are listed.
This document compares student assessment results from 2012 at SK Abang Aing in Sri Aman, Sarawak, Malaysia. It shows the percentage of students who passed UPSR exams in 2011 and three practice exams in 2012 for subjects like Bahasa Malaysia comprehension and writing, English, Mathematics, and Science. The overall pass rate and average grade point increased from the first practice exam to the UPSR 2012 exam, with the percentage of students achieving 5As also increasing.
This document provides equations and procedures for calculating variance, standard deviation, t-tests, and interpreting t-test results. It includes:
1) Formulas for variance (s2) and standard deviation (s) in terms of the mean (X) and sample size (N).
2) Steps for conducting a t-test using means, variances, sample sizes of two samples and degrees of freedom.
3) Instructions for using Excel's t-test function and selecting parameters like one-tailed or two-tailed and paired vs unpaired data.
4) A t-value distribution table to compare the calculated t-value to for estimating the p-value and determining statistical significance
This document contains tables showing student exam results from several subjects in multiple years. It includes the percentage of students who passed or failed each subject and the average grade point score (GPS) received. Overall pass rates ranged from around 60-100% across subjects and years. Subjects with lower average pass rates included English, Mathematics, and Science. GPS scores were highest for subjects like Moral Education and lowest for subjects where pass rates were under 70%.
This document contains exam results from several subjects - Bahasa Malaysia (comprehension and writing), English, Mathematics, Science, Arabic, Islamic Studies, Jawi and Moral Education - across multiple years. It provides the percentage of students who passed and failed each subject, as well as the average grade point score (GPS) for each subject each year. Overall pass rates varied from year to year and across subjects, with some subjects like Moral Education having a 100% pass rate while others had higher fail rates.
This document contains exam results from several subjects - Bahasa Malaysia (comprehension and writing), English, Mathematics, Science, Arabic, Islamic Studies, Jawi and Moral Education - across multiple years. It provides the percentage of students who passed and failed each subject, as well as the average grade point score (GPS) for each subject each year. Overall pass rates varied from year to year and by subject, with some subjects like Moral Education having a 100% pass rate while others had higher fail rates.
The document summarizes Malaysia's trade performance and furniture exports from 2004-2007. Total Malaysian exports grew around 3-5% annually while furniture exports grew around 6-8% yearly over this period. The top export destinations for Malaysian furniture were the US, Japan, Australia, and others, with wooden and metal furniture comprising the majority of exports. Office and kitchen furniture saw some of the strongest export growth rates to countries like India, UAE, and Australia.
Bengkel pasaran perabot & produk kayu di antarabangsa 29 july2008-melakaZaini Ithnin
The document summarizes Malaysia's trade performance and furniture exports from 2004-2007. Total Malaysian exports grew from RM588.97 billion in 2006 to RM605.15 billion in 2007. Furniture exports specifically grew from RM8.08 billion to RM8.55 billion over the same period. The top export destinations for Malaysian furniture were the US, Japan, Australia, and the UK. Wooden furniture made up the majority of exports, particularly wooden seats, bedroom furniture, and kitchen cabinets.
Bengkel pasaran perabot & produk kayu di antarabangsa 29 july2008-melakaClean Agent Sdn Bhd
The document summarizes Malaysia's trade performance and furniture exports from 2004-2007. Total Malaysian exports grew from RM588.97 billion in 2006 to RM605.15 billion in 2007. Furniture exports specifically grew from RM8.08 billion to RM8.55 billion over the same period. The top export destinations for Malaysian furniture were the US, Japan, Australia, and the UK. Wooden furniture made up the majority of exports, with wooden seats, kitchen furniture, and office furniture being key product types.
แนวทางการดำเนินงานกองทุนฟื้นฟูสมรรถภาพทางการแพทย์ โดย ดร.ทพ.วิรัตน์ เอื้องพูล...Nithimar Or
This document outlines a goal, mission, and action plan. It includes a progress report comparing metrics from 2552-2553 and sets targets for 2553. The action plan focuses on early intervention, training caregivers, and establishing a sub-acute program. Progress markers establish expectations to see implementation of the plan, demonstrated outcomes, and ultimately achievement of the overall goal.
The document summarizes Malaysia's furniture trade from 2004-2007. It shows that Malaysia's total furniture exports grew from RM7.05 billion in 2004 to RM8.55 billion in 2007. The top export destination was the USA, though its share declined in 2007. Wooden furniture comprised the majority of exports, with wooden seats and office furniture being the fastest growing segments. Imports remained relatively flat during this period.
This study aimed to develop a model of excellent teacher thinking based on data from 105 excellent teachers in Malaysia. The study found that teacher expectations and subject expertise were the most significant predictors of teaching performance, explaining 31.1% of the variance. Specifically, teacher expectations had the highest contribution to performance. The model shows that an excellent teacher's thinking incorporates teaching philosophy, pedagogical knowledge, management style, objectives, and expectations. Of these, expectations were found to be most vital for excellent teaching.
This document provides the conference program for the SGGS International Students' Conference 2010, held from June 13-16. The program includes details on events each day such as plenary sessions, workshops, cultural presentations, tours and meals. Some of the key topics to be discussed at plenary sessions include promoting global sustainability, optimizing student potential, and promoting global gender equality and peace. The conference will also include social activities like an icebreaker, games, and a farewell dinner with cultural presentations.
This document is a registration form for the SGGS International Students' Conference 2010 being held in Penang, Malaysia from June 13-16, 2010. It requests information such as the name and contact details of participating schools and student delegates. It also provides instructions on payment methods and participation opportunities for student delegates at the conference, including serving as chairpersons, rapporteurs, or presenters.
The document provides an overview of computer systems and their components. It can be summarized as follows:
1) A computer system consists of four major hardware components: input devices, output devices, a processor, and storage devices. It requires both hardware and software to function, with software providing instructions to tell the hardware what to do.
2) Input devices such as keyboards and mice are used to enter data into the system. Processing is carried out by the central processing unit (CPU). Output devices like monitors and printers are used to display or print the processed data. Storage devices hold data, programs and files for future use.
3) The information processing cycle involves a user inputting data, the processor carrying out
The document provides an overview of information and communication technology (ICT). It defines ICT as the use of electronic computers, communication devices, and software to process and transmit information. The document then describes the evolution of computers through 5 generations from the 1940s to present. It discusses the development of hardware technologies over these generations like vacuum tubes, transistors, integrated circuits, and microprocessors. It also outlines the impact of ICT on different sectors like education, banking, industry, commerce, and society.
The document provides an overview of computer systems and their components. It can be summarized as follows:
1) A computer system consists of four major hardware components: input devices, output devices, a processor, and storage devices. It requires both hardware and software to function, with software providing instructions to tell the hardware what to do.
2) Common input devices include keyboards, mice, and scanners. Output devices display processed data through monitors, printers, and speakers. Storage holds data and programs, while the processor controls activities and executes instructions.
3) The information processing cycle involves a user inputting data, the processor accessing stored programs and data to process the input, and output devices presenting the processed output back
More Related Content
Similar to Sasaran upsr, pmr, spm & stpm 2011 jpn pulau pinang
This document compares student assessment results from 2012 at SK Abang Aing in Sri Aman, Sarawak, Malaysia. It shows the percentage of students who passed UPSR exams in 2011 and three practice exams in 2012 for subjects like Bahasa Malaysia comprehension and writing, English, Mathematics, and Science. The overall pass rate and average grade point increased from the first practice exam to the UPSR 2012 exam, with the percentage of students achieving 5As also increasing.
This document provides equations and procedures for calculating variance, standard deviation, t-tests, and interpreting t-test results. It includes:
1) Formulas for variance (s2) and standard deviation (s) in terms of the mean (X) and sample size (N).
2) Steps for conducting a t-test using means, variances, sample sizes of two samples and degrees of freedom.
3) Instructions for using Excel's t-test function and selecting parameters like one-tailed or two-tailed and paired vs unpaired data.
4) A t-value distribution table to compare the calculated t-value to for estimating the p-value and determining statistical significance
This document contains tables showing student exam results from several subjects in multiple years. It includes the percentage of students who passed or failed each subject and the average grade point score (GPS) received. Overall pass rates ranged from around 60-100% across subjects and years. Subjects with lower average pass rates included English, Mathematics, and Science. GPS scores were highest for subjects like Moral Education and lowest for subjects where pass rates were under 70%.
This document contains exam results from several subjects - Bahasa Malaysia (comprehension and writing), English, Mathematics, Science, Arabic, Islamic Studies, Jawi and Moral Education - across multiple years. It provides the percentage of students who passed and failed each subject, as well as the average grade point score (GPS) for each subject each year. Overall pass rates varied from year to year and across subjects, with some subjects like Moral Education having a 100% pass rate while others had higher fail rates.
This document contains exam results from several subjects - Bahasa Malaysia (comprehension and writing), English, Mathematics, Science, Arabic, Islamic Studies, Jawi and Moral Education - across multiple years. It provides the percentage of students who passed and failed each subject, as well as the average grade point score (GPS) for each subject each year. Overall pass rates varied from year to year and by subject, with some subjects like Moral Education having a 100% pass rate while others had higher fail rates.
The document summarizes Malaysia's trade performance and furniture exports from 2004-2007. Total Malaysian exports grew around 3-5% annually while furniture exports grew around 6-8% yearly over this period. The top export destinations for Malaysian furniture were the US, Japan, Australia, and others, with wooden and metal furniture comprising the majority of exports. Office and kitchen furniture saw some of the strongest export growth rates to countries like India, UAE, and Australia.
Bengkel pasaran perabot & produk kayu di antarabangsa 29 july2008-melakaZaini Ithnin
The document summarizes Malaysia's trade performance and furniture exports from 2004-2007. Total Malaysian exports grew from RM588.97 billion in 2006 to RM605.15 billion in 2007. Furniture exports specifically grew from RM8.08 billion to RM8.55 billion over the same period. The top export destinations for Malaysian furniture were the US, Japan, Australia, and the UK. Wooden furniture made up the majority of exports, particularly wooden seats, bedroom furniture, and kitchen cabinets.
Bengkel pasaran perabot & produk kayu di antarabangsa 29 july2008-melakaClean Agent Sdn Bhd
The document summarizes Malaysia's trade performance and furniture exports from 2004-2007. Total Malaysian exports grew from RM588.97 billion in 2006 to RM605.15 billion in 2007. Furniture exports specifically grew from RM8.08 billion to RM8.55 billion over the same period. The top export destinations for Malaysian furniture were the US, Japan, Australia, and the UK. Wooden furniture made up the majority of exports, with wooden seats, kitchen furniture, and office furniture being key product types.
แนวทางการดำเนินงานกองทุนฟื้นฟูสมรรถภาพทางการแพทย์ โดย ดร.ทพ.วิรัตน์ เอื้องพูล...Nithimar Or
This document outlines a goal, mission, and action plan. It includes a progress report comparing metrics from 2552-2553 and sets targets for 2553. The action plan focuses on early intervention, training caregivers, and establishing a sub-acute program. Progress markers establish expectations to see implementation of the plan, demonstrated outcomes, and ultimately achievement of the overall goal.
The document summarizes Malaysia's furniture trade from 2004-2007. It shows that Malaysia's total furniture exports grew from RM7.05 billion in 2004 to RM8.55 billion in 2007. The top export destination was the USA, though its share declined in 2007. Wooden furniture comprised the majority of exports, with wooden seats and office furniture being the fastest growing segments. Imports remained relatively flat during this period.
Similar to Sasaran upsr, pmr, spm & stpm 2011 jpn pulau pinang (12)
This study aimed to develop a model of excellent teacher thinking based on data from 105 excellent teachers in Malaysia. The study found that teacher expectations and subject expertise were the most significant predictors of teaching performance, explaining 31.1% of the variance. Specifically, teacher expectations had the highest contribution to performance. The model shows that an excellent teacher's thinking incorporates teaching philosophy, pedagogical knowledge, management style, objectives, and expectations. Of these, expectations were found to be most vital for excellent teaching.
This document provides the conference program for the SGGS International Students' Conference 2010, held from June 13-16. The program includes details on events each day such as plenary sessions, workshops, cultural presentations, tours and meals. Some of the key topics to be discussed at plenary sessions include promoting global sustainability, optimizing student potential, and promoting global gender equality and peace. The conference will also include social activities like an icebreaker, games, and a farewell dinner with cultural presentations.
This document is a registration form for the SGGS International Students' Conference 2010 being held in Penang, Malaysia from June 13-16, 2010. It requests information such as the name and contact details of participating schools and student delegates. It also provides instructions on payment methods and participation opportunities for student delegates at the conference, including serving as chairpersons, rapporteurs, or presenters.
The document provides an overview of computer systems and their components. It can be summarized as follows:
1) A computer system consists of four major hardware components: input devices, output devices, a processor, and storage devices. It requires both hardware and software to function, with software providing instructions to tell the hardware what to do.
2) Input devices such as keyboards and mice are used to enter data into the system. Processing is carried out by the central processing unit (CPU). Output devices like monitors and printers are used to display or print the processed data. Storage devices hold data, programs and files for future use.
3) The information processing cycle involves a user inputting data, the processor carrying out
The document provides an overview of information and communication technology (ICT). It defines ICT as the use of electronic computers, communication devices, and software to process and transmit information. The document then describes the evolution of computers through 5 generations from the 1940s to present. It discusses the development of hardware technologies over these generations like vacuum tubes, transistors, integrated circuits, and microprocessors. It also outlines the impact of ICT on different sectors like education, banking, industry, commerce, and society.
The document provides an overview of computer systems and their components. It can be summarized as follows:
1) A computer system consists of four major hardware components: input devices, output devices, a processor, and storage devices. It requires both hardware and software to function, with software providing instructions to tell the hardware what to do.
2) Common input devices include keyboards, mice, and scanners. Output devices display processed data through monitors, printers, and speakers. Storage holds data and programs, while the processor controls activities and executes instructions.
3) The information processing cycle involves a user inputting data, the processor accessing stored programs and data to process the input, and output devices presenting the processed output back
The document provides an overview of information and communication technology (ICT). It defines ICT as the use of electronic computers, communication devices, and software to process and transmit information. The document then describes the evolution of computers through 5 generations from the 1940s to present. It discusses the development of hardware technologies over these generations like vacuum tubes, transistors, integrated circuits, and microprocessors. It also outlines how ICT is used in education, banking, industry, commerce, and its impact on society.
Exploiting Artificial Intelligence for Empowering Researchers and Faculty, In...Dr. Vinod Kumar Kanvaria
Exploiting Artificial Intelligence for Empowering Researchers and Faculty,
International FDP on Fundamentals of Research in Social Sciences
at Integral University, Lucknow, 06.06.2024
By Dr. Vinod Kumar Kanvaria
ISO/IEC 27001, ISO/IEC 42001, and GDPR: Best Practices for Implementation and...PECB
Denis is a dynamic and results-driven Chief Information Officer (CIO) with a distinguished career spanning information systems analysis and technical project management. With a proven track record of spearheading the design and delivery of cutting-edge Information Management solutions, he has consistently elevated business operations, streamlined reporting functions, and maximized process efficiency.
Certified as an ISO/IEC 27001: Information Security Management Systems (ISMS) Lead Implementer, Data Protection Officer, and Cyber Risks Analyst, Denis brings a heightened focus on data security, privacy, and cyber resilience to every endeavor.
His expertise extends across a diverse spectrum of reporting, database, and web development applications, underpinned by an exceptional grasp of data storage and virtualization technologies. His proficiency in application testing, database administration, and data cleansing ensures seamless execution of complex projects.
What sets Denis apart is his comprehensive understanding of Business and Systems Analysis technologies, honed through involvement in all phases of the Software Development Lifecycle (SDLC). From meticulous requirements gathering to precise analysis, innovative design, rigorous development, thorough testing, and successful implementation, he has consistently delivered exceptional results.
Throughout his career, he has taken on multifaceted roles, from leading technical project management teams to owning solutions that drive operational excellence. His conscientious and proactive approach is unwavering, whether he is working independently or collaboratively within a team. His ability to connect with colleagues on a personal level underscores his commitment to fostering a harmonious and productive workplace environment.
Date: May 29, 2024
Tags: Information Security, ISO/IEC 27001, ISO/IEC 42001, Artificial Intelligence, GDPR
-------------------------------------------------------------------------------
Find out more about ISO training and certification services
Training: ISO/IEC 27001 Information Security Management System - EN | PECB
ISO/IEC 42001 Artificial Intelligence Management System - EN | PECB
General Data Protection Regulation (GDPR) - Training Courses - EN | PECB
Webinars: https://pecb.com/webinars
Article: https://pecb.com/article
-------------------------------------------------------------------------------
For more information about PECB:
Website: https://pecb.com/
LinkedIn: https://www.linkedin.com/company/pecb/
Facebook: https://www.facebook.com/PECBInternational/
Slideshare: http://www.slideshare.net/PECBCERTIFICATION
How to Fix the Import Error in the Odoo 17Celine George
An import error occurs when a program fails to import a module or library, disrupting its execution. In languages like Python, this issue arises when the specified module cannot be found or accessed, hindering the program's functionality. Resolving import errors is crucial for maintaining smooth software operation and uninterrupted development processes.
How to Add Chatter in the odoo 17 ERP ModuleCeline George
In Odoo, the chatter is like a chat tool that helps you work together on records. You can leave notes and track things, making it easier to talk with your team and partners. Inside chatter, all communication history, activity, and changes will be displayed.
How to Manage Your Lost Opportunities in Odoo 17 CRMCeline George
Odoo 17 CRM allows us to track why we lose sales opportunities with "Lost Reasons." This helps analyze our sales process and identify areas for improvement. Here's how to configure lost reasons in Odoo 17 CRM
Walmart Business+ and Spark Good for Nonprofits.pdfTechSoup
"Learn about all the ways Walmart supports nonprofit organizations.
You will hear from Liz Willett, the Head of Nonprofits, and hear about what Walmart is doing to help nonprofits, including Walmart Business and Spark Good. Walmart Business+ is a new offer for nonprofits that offers discounts and also streamlines nonprofits order and expense tracking, saving time and money.
The webinar may also give some examples on how nonprofits can best leverage Walmart Business+.
The event will cover the following::
Walmart Business + (https://business.walmart.com/plus) is a new shopping experience for nonprofits, schools, and local business customers that connects an exclusive online shopping experience to stores. Benefits include free delivery and shipping, a 'Spend Analytics” feature, special discounts, deals and tax-exempt shopping.
Special TechSoup offer for a free 180 days membership, and up to $150 in discounts on eligible orders.
Spark Good (walmart.com/sparkgood) is a charitable platform that enables nonprofits to receive donations directly from customers and associates.
Answers about how you can do more with Walmart!"
Pride Month Slides 2024 David Douglas School District
Sasaran upsr, pmr, spm & stpm 2011 jpn pulau pinang
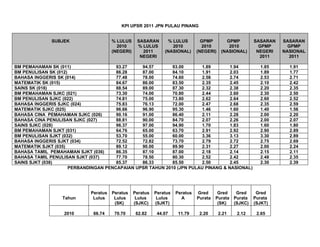
1. KPI UPSR 2011 JPN PULAU PINANG
SUBJEK % LULUS SASARAN % LULUS GPMP GPMP SASARAN SASARAN
2010 % LULUS 2010 2010 2010 GPMP GPMP
(NEGERI) 2011 (NASIONAL) (NEGERI) (NASIONAL) NEGERI NASIONAL
NEGERI 2011 2011
BM PEMAHAMAN SK (011) 93.27 94.57 93.00 1.89 1.94 1.85 1.91
BM PENULISAN SK (012) 86.28 87.00 84.10 1.91 2.03 1.89 1.77
BAHASA INGGERIS SK (014) 77.48 78.00 74.60 2.58 2.74 2.53 2.71
MATEMATIK SK (015) 84.67 86.00 83.50 2.35 2.45 2.10 2.42
SAINS SK (018) 88.54 89.00 87.30 2.32 2.38 2.20 2.35
BM PEMAHAMAN SJKC (021) 73.30 74.00 70.80 2.44 2.60 2.30 2.50
BM PENULISAN SJKC (022) 74.81 75.00 73.80 2.62 2.64 2.60 2.52
BAHASA INGGERIS SJKC (024) 75.83 76.13 72.00 2.47 2.68 2.35 2.59
MATEMATIK SJKC (025) 96.66 96.90 95.30 1.46 1.60 1.40 1.56
BAHASA CINA PEMAHAMAN SJKC (026) 90.16 91.00 86.40 2.11 2.28 2.00 2.20
BAHASA CINA PENULISAN SJKC (027) 88.81 90.00 84.70 2.07 2.26 2.00 2.07
SAINS SJKC (028) 96.37 97.00 94.90 1.70 1.83 1.60 1.80
BM PEMAHAMAN SJKT (031) 64.76 65.00 63.70 2.91 2.92 2.90 2.89
BM PENULISAN SJKT (032) 53.70 55.00 60.00 3.36 3.13 3.30 2.89
BAHASA INGGERIS SJKT (034) 72.52 72.82 73.70 2.79 2.72 2.75 2.69
MATEMATIK SJKT (035) 89.12 90.00 89.90 2.31 2.27 2.00 2.24
BAHASA TAMIL PEMAHAMAN SJKT (036) 86.35 87.10 87.00 2.18 2.14 2.15 2.11
BAHASA TAMIL PENULISAN SJKT (037) 77.70 78.50 80.30 2.52 2.42 2.48 2.35
SAINS SJKT (038) 85.37 86.33 85.50 2.50 2.45 2.30 2.39
PERBANDINGAN PENCAPAIAN UPSR TAHUN 2010 (JPN PULAU PINANG & NASIONAL)
Peratus Peratus Peratus Peratus Peratus Gred Gred Gred Gred
Tahun Lulus Lulus Lulus Lulus A Purata Purata Purata Purata
(SK) (SJKC) (SJKT) (SK) (SJKC) (SJKT)
2010 66.74 70.70 62.82 44.07 11.79 2.20 2.21 2.12 2.65
2. (Pulau Pinang)
2010 64.40 67.02 56.86 49.60 10.02 2.30 2.31 2.27 2.58
(Nasional)
PERBANDINGAN SASARAN UPSR TAHUN 2011 (JPN PULAU PINANG & NASIONAL)
Peratus Peratus Peratus Peratus Peratus Gred Gred Gred Gred
Tahun Lulus Lulus Lulus Lulus A Purata Purata Purata Purata
(SK) (SJKC) (SJKT) (SK) (SJKC) (SJKT)
2011 76.70 85.00 75.00 70.00 14.79 2.15 2.10 2.00 2.50
(Pulau Pinang)
2011 70.00 75.00 70.00 65.00 11.00 2.29 2.29 2.08 2.56
(Nasional)
KPI PMR 2011 JPN PULAU PINANG
MATA PELAJARAN % LULUS SASARAN % LULUS GPMP GPMP SASARAN SASARAN
2010 % LULUS 2010 2010 2010 GPMP GPMP
(NEGERI) 2011 (NASIONAL) (NEGERI) (NASIONAL) NEGERI NASIONAL
NEGERI 2011 2011
BAHASA MELAYU 91.90 92.25 94.1 2.44 2.34 2.42 2.32
BAHASA INGGERIS 79.52 80.52 75.8 2.87 3.16 2.83 3.14
3. MATEMATIK 90.18 92.00 91.7 2.64 2.81 2.62 2.79
SAINS 92.46 93.68 94.3 2.75 2.86 2.69 2.84
SEJARAH 90.82 93.00 92.7 2.85 2.83 2.75 2.81
GEOGRAFI 89.04 91.54 89.6 2.86 2.90 2.75 2.86
KHB KEMAHIRAN TEKNIKAL 89.51 90.00 95.8 2.64 2.38 2.60 2.36
KHB EKONOMI RUMAHTANGGA 97.06 97.56 98.9 2.60 2.39 2.59 2.35
KHB PERTANIAN 98.06 98.26 96.8 2.77 2.67 2.72 2.65
KHB PERDAGANGAN & KEUSAHAWANAN 95.44 96.00 96.8 2.57 2.47 2.50 2.44
BAHASA CINA 87.03 89.99 87.0 2.61 2.76 2.58 2.70
BAHASA TAMIL 74.56 76.00 74.9 3.09 3.11 2.98 3.01
PERBANDINGAN PENCAPAIAN PMR TAHUN 2010 (JPN PULAU PINANG & NASIONAL)
Peratus Peratus Gred
Tahun Lulus A Purata
2010 68.29 9.38 2.70
(Pulau Pinang)
2010 67.41 7.02 2.74
(Nasional)
4. PERBANDINGAN SASARAN PMR TAHUN 2011 (JPN PULAU PINANG & NASIONAL)
Peratus Peratus Gred
Tahun Lulus A Purata
2011 71.00 11.00 2.65
(Pulau Pinang)
2011 70.41 - 2.72
(Nasional)
KPI SPM 2011 JPN PULAU PINANG
MATA PELAJARAN % LULUS SASARAN % LULUS GPMP GPMP SASARAN SASARAN
2010 % LULUS 2010 2010 2010 GPMP GPMP
(NEGERI) 2011 (NASIONAL) (NEGERI) (NASIONAL) NEGERI NASIONAL
NEGERI 2011 2011
BAHASA MELAYU 88.21 4.17
BAHASA INGGERIS 81.16 5.52
MATEMATIK 78.50 4.68
SAINS 87.00 5.75
SEJARAH 70.00 5.50
GEOGRAFI 80.98 6.48
MATEMATIK TAMBAHAN 83.50 4.89
FIZIK 98.25 4.26
5. KIMIA 93.73 4.85
BIOLOGI 97.58 4.50
BAHASA CINA 97.97 3.84
BAHASA TAMIL 95.53 4.49
PENDIDIKAN SENI VISUAL 97.00 4.00
PENDIDIKAN MUZIK 90.00 3.00
SAINS PERTANIAN 68.00 6.26
PERDAGANGAN 75.00 6.00
PRINSIP PERAKAUNAN 79.00 5.00
EKONOMI ASAS 75.00 5.00
EKONOMI RUMAHTANGGA 89.00 4.00
LUKISAN KEJURUTERAAN 91.00 4.61
REKA CIPTA 95.00 3.60
TEKNOLOGI KEJURUTERAAN 87.17 5.20
ICT 97.00 3.79
PENDIDIKAN MORAL 82.00 4.00
PERBANDINGAN PENCAPAIAN SPM TAHUN 2010 (JPN PULAU PINANG & NASIONAL)
Peratus Peratus Gred
Tahun Lulus A Purata
2010
(Pulau Pinang)
2010 (Nasional)
6. PERBANDINGAN SASARAN SPM TAHUN 2011 (JPN PULAU PINANG & NASIONAL)
Peratus Peratus Gred
Tahun Lulus A Purata
2011
(Pulau Pinang)
2011
(Nasional)
KPI STPM 2011 JPN PULAU PINANG
MATA PELAJARAN % LULUS GPMP % LULUS SASARAN
2010 2010 2010 % LULUS
(NEGERI) (NEGERI) (KEBANGSAAN) 2011
NEGERI
PENGAJIAN AM 93.64
BAHASA MALAYSIA 76.39
BAHASA CINA 84.31
BAHASA TAMIL 62.50
BAHASA ARAB 66.64
LITERATURE IN ENGLISH 96.65
KESUSASTERAAN MELAYU 79.73
7. SYARIAH 89.42
USULUDDIN 85.40
SEJARAH 72.08
GEOGRAFI 73.19
EKONOMI 76.11
PENGAJIAN PERNIAGAAN 75.93
PERAKAUNAN 80.85
MATEMATIK S 77.72
MATEMATIK T 77.61
MATEMATIK T LANJUTAN 100.00
KOMPUTER 81.67
FIZIK 84.33
KIMIA 83.88
BIOLOGI 87.23
SAINS SUKAN 100.00
SENI VISUAL 93.00
8. PERBANDINGAN PENCAPAIAN STPM TAHUN 2010 (JPN PULAU PINANG & NASIONAL)
Peratus Peratus Gred
Tahun Lulus A Purata
2010
(Pulau Pinang)
2010 (Nasional)
PERBANDINGAN SASARAN STPM TAHUN 2011 (JPN PULAU PINANG & NASIONAL)
Peratus Peratus Gred
Tahun Lulus A Purata
2011
(Pulau Pinang)
2011
(Nasional)