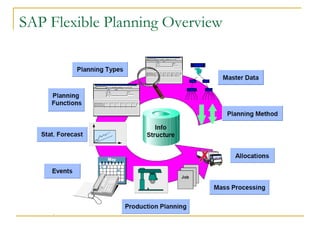
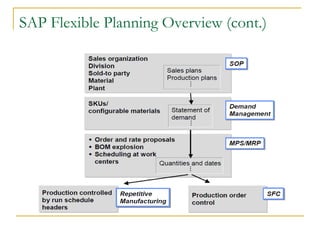
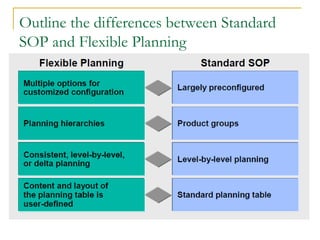
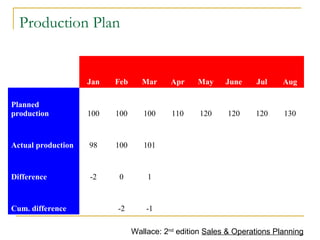
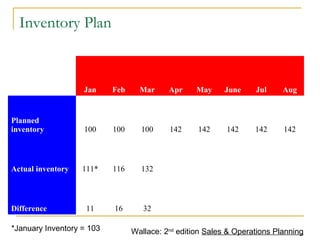
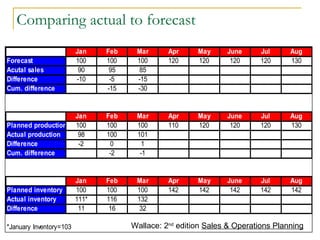
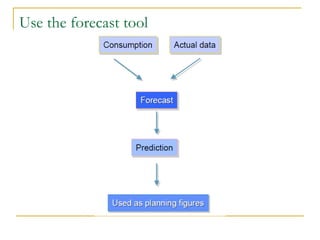
Flexible Planning
By : Mohamed El Kady
Sales & operations Planning
Agenda
 SAP Flexible Planning Overview
 Outline the differences between Standard SOP and
Flexible Planning
 Create sales and production plans
 Use the forecast tool
 Create planning types, macros and events
 Perform resource planning and rough-cut capacity
analysis
 Use mass processing
 Transfer planning results to Demand Management
SAP Flexible Planning Overview
SAP Flexible Planning Overview (cont.)
 Sales & Operations Planning (SOP) is a flexible
forecasting and planning tool with which sales ,
production, and other supply chain and logistics targets
can be set.
 The basis for this is provided by historical, existing,
and/or estimated future data.
 Resource planning can also be carried out to determine
the amounts of the work center capacities and other
resources required to meet these targets.
 SOP supports both the high-level planning of complex
planning hierarchies and the detailed planning of finished
products
SAP Flexible Planning Overview (cont.)
Outline the differences between Standard
SOP and Flexible Planning
Outline the differences between Standard
SOP and Flexible Planning (Cont.)
 Sales & Operations Planning is made up of two
elements: flexible planning and standard SOP.
 The above table shows you the differences between
them.
 To access flexible planning, select Logistics Logistics
Controlling Flexible planning.
 To access standard SOP, select Logistics Production
SOP.
 You can copy the planning table of standard SOP and
then modify it to suit your company's needs.
Create sales and production plans
 Takes a monthly look at product groups at
least 6- 12 months across the planning
horizon.
 Some companies go out as far as 18 months.
Sales Plan
  Jan Feb Mar Apr May June Jul Aug
Forecast 100 100 100 120 120 120 120 130
Actual sales 90 95 85          
Difference -10 -5 -15          
Cum. difference   -15 -30          
Wallace: 2nd
edition Sales & Operations Planning
Production Plan
  Jan Feb Mar Apr May June Jul Aug
Planned
production 100 100 100 110 120 120 120 130
Actual production 98 100 101          
Difference -2 0 1          
Cum. difference   -2 -1          
Wallace: 2nd
edition Sales & Operations Planning
Inventory Plan
  Jan Feb Mar Apr May June Jul Aug
Planned
inventory 100 100 100 142 142 142 142 142
Actual inventory 111* 116 132          
Difference 11 16 32          
*January Inventory = 103 Wallace: 2nd
edition Sales & Operations Planning
Jan Feb Mar Apr May June Jul Aug
Forecast 100 100 100 120 120 120 120 130
Acutal sales 90 95 85
Difference -10 -5 -15
Cum. difference -15 -30
Jan Feb Mar Apr May June Jul Aug
Planned production 100 100 100 110 120 120 120 130
Actual production 98 100 101
Difference -2 0 1
Cum. difference -2 -1
Jan Feb Mar Apr May June Jul Aug
Planned inventory 100 100 100 142 142 142 142 142
Actual inventory 111* 116 132
Difference 11 16 32
*January Inventory=103
Comparing actual to forecast
Wallace: 2nd
edition Sales & Operations Planning
Use the forecast tool
Use the forecast tool (Cont.)
 Forecast Models for Different Historical Patterns:
 Constant Constant model
 Constant model with smoothing factor adaptation
 Moving average model
 Weighted moving average model
 Trend Trend model
 (1st-order exponential smoothing)
 2nd-order exponential smoothing model (with and without
parameter optimization)
 Moving average model
 Weighted moving average model
Use the forecast tool (Cont.)
Create planning types, macros and events
 The actions you perform to create a planning type are as
follows:
 creating planning type info
 assigning a key figure to a line
 creating lines in the planning table
 defining line attributes
 defining macros
 using special operators to define macros for stock balance,
production, days' supply, and historical totals
 translating planning type, freely defined line, and macro texts
Create planning types, macros and events
 You can specify that a macro is to be carried out
automatically for a particular planning type.
 There are three ways to execute a macro automatically:
 The initial macro is run whenever you call up the planning table.
 The default macro is run whenever you regenerate the planning
table, (for example, when you press ENTER), or when you
call up or save the planning table. Caution: This can
result in the macro running several times.
 The final macro is run immediately before the data is saved
Create planning types, macros and events
(cont.)
 Events allow you to predict the impact of one-time
events that cannot be deduced from historical data.
Examples of events include:
 Price changes such as promotions
 Special deals with major customers and vendors
 Competitor sales activities
 Management overrides
 Facts based on market intelligence
 You define an event either as a series of percentage
changes ("proportional" events) or as one ormore whole
numbers ("cumulative" events).
Perform resource planning and rough-cut
capacity analysis
Perform resource planning and rough-cut
capacity analysis(Cont.)
 You use rough-cut planning profiles to plan critical
resources. These might be:
 Bottleneck work center
 Material capacities
 Costs of goods transportation or a marketing campaign
 The following resource types are supported:
 Work center capacities
 Materials
 Production resources/tools
 Costs
Perform resource planning and rough-cut
capacity analysis(Cont.)
Perform resource planning and rough-cut
capacity analysis(Cont.)
 You define the determination of capacity load in the
rough-cut planning profile.
 The available capacity is read from the bottleneck work
center defined in the resource table of the rough-cut
profile.
 The capacity load is calculated multiplying the planned
quantity by the total time maintained for the work center
in the rough-cut profile.
 The time span of the profile header is just to model the
capacity load to produce x base quantities on the bases
of time.
Mass Processing
Mass Processing(Cont.)
 Four planning activities can be carried out using the
sequence depicted above:
 Executing a macro
 Forecasting
 Copying key figures from one info structure to another
 Transfer to or from CO-PA
 Transferring SOP data to Demand Management.
Transfer planning results to demand
anagement
Transfer planning results to Demand
Management (cont.)
 You can carry out the transfer of data to Demand
Management either online or in the background.
 There are three basic options for transferring SOP data
to Demand Management:
 You transfer material data from the info structure. Use mass
processing to transfer a range of materials.
 You transfer material data from a product group. The data is
either transferred direct from the materials, or as
proportions of the product group.
 You transfer one material's data. The data is either transferred
direct from the material, or as a proportion of the owner
product group.
Transfer planning results to Demand
Management (cont.)
 A material can be a member of more than one product
group. This means that it can be transferred to Demand
Management more than once. The system issues a
warning if you try to transfer a material from a product
group that has not been marked as the MRP product
group for that material.
 When you carry out the transfer, planned independent
requirements are created in Demand Management
Questions?

SAP Flexible Planning

  • 1.
    Flexible Planning By :Mohamed El Kady Sales & operations Planning
  • 2.
    Agenda  SAP FlexiblePlanning Overview  Outline the differences between Standard SOP and Flexible Planning  Create sales and production plans  Use the forecast tool  Create planning types, macros and events  Perform resource planning and rough-cut capacity analysis  Use mass processing  Transfer planning results to Demand Management
  • 3.
  • 4.
    SAP Flexible PlanningOverview (cont.)  Sales & Operations Planning (SOP) is a flexible forecasting and planning tool with which sales , production, and other supply chain and logistics targets can be set.  The basis for this is provided by historical, existing, and/or estimated future data.  Resource planning can also be carried out to determine the amounts of the work center capacities and other resources required to meet these targets.  SOP supports both the high-level planning of complex planning hierarchies and the detailed planning of finished products
  • 5.
    SAP Flexible PlanningOverview (cont.)
  • 6.
    Outline the differencesbetween Standard SOP and Flexible Planning
  • 7.
    Outline the differencesbetween Standard SOP and Flexible Planning (Cont.)  Sales & Operations Planning is made up of two elements: flexible planning and standard SOP.  The above table shows you the differences between them.  To access flexible planning, select Logistics Logistics Controlling Flexible planning.  To access standard SOP, select Logistics Production SOP.  You can copy the planning table of standard SOP and then modify it to suit your company's needs.
  • 8.
    Create sales andproduction plans  Takes a monthly look at product groups at least 6- 12 months across the planning horizon.  Some companies go out as far as 18 months.
  • 9.
    Sales Plan   JanFeb Mar Apr May June Jul Aug Forecast 100 100 100 120 120 120 120 130 Actual sales 90 95 85           Difference -10 -5 -15           Cum. difference   -15 -30           Wallace: 2nd edition Sales & Operations Planning
  • 10.
    Production Plan   JanFeb Mar Apr May June Jul Aug Planned production 100 100 100 110 120 120 120 130 Actual production 98 100 101           Difference -2 0 1           Cum. difference   -2 -1           Wallace: 2nd edition Sales & Operations Planning
  • 11.
    Inventory Plan   JanFeb Mar Apr May June Jul Aug Planned inventory 100 100 100 142 142 142 142 142 Actual inventory 111* 116 132           Difference 11 16 32           *January Inventory = 103 Wallace: 2nd edition Sales & Operations Planning
  • 12.
    Jan Feb MarApr May June Jul Aug Forecast 100 100 100 120 120 120 120 130 Acutal sales 90 95 85 Difference -10 -5 -15 Cum. difference -15 -30 Jan Feb Mar Apr May June Jul Aug Planned production 100 100 100 110 120 120 120 130 Actual production 98 100 101 Difference -2 0 1 Cum. difference -2 -1 Jan Feb Mar Apr May June Jul Aug Planned inventory 100 100 100 142 142 142 142 142 Actual inventory 111* 116 132 Difference 11 16 32 *January Inventory=103 Comparing actual to forecast Wallace: 2nd edition Sales & Operations Planning
  • 13.
  • 14.
    Use the forecasttool (Cont.)
  • 15.
    Use the forecasttool (Cont.)  Forecast Models for Different Historical Patterns:  Constant Constant model  Constant model with smoothing factor adaptation  Moving average model  Weighted moving average model  Trend Trend model  (1st-order exponential smoothing)  2nd-order exponential smoothing model (with and without parameter optimization)  Moving average model  Weighted moving average model
  • 16.
    Use the forecasttool (Cont.)
  • 17.
    Use the forecasttool (Cont.)
  • 18.
    Create planning types,macros and events
  • 19.
    Create planning types,macros and events  The actions you perform to create a planning type are as follows:  creating planning type info  assigning a key figure to a line  creating lines in the planning table  defining line attributes  defining macros  using special operators to define macros for stock balance, production, days' supply, and historical totals  translating planning type, freely defined line, and macro texts
  • 20.
    Create planning types,macros and events
  • 21.
    Create planning types,macros and events  You can specify that a macro is to be carried out automatically for a particular planning type.  There are three ways to execute a macro automatically:  The initial macro is run whenever you call up the planning table.  The default macro is run whenever you regenerate the planning table, (for example, when you press ENTER), or when you call up or save the planning table. Caution: This can result in the macro running several times.  The final macro is run immediately before the data is saved
  • 22.
    Create planning types,macros and events
  • 23.
    Create planning types,macros and events (cont.)  Events allow you to predict the impact of one-time events that cannot be deduced from historical data. Examples of events include:  Price changes such as promotions  Special deals with major customers and vendors  Competitor sales activities  Management overrides  Facts based on market intelligence  You define an event either as a series of percentage changes ("proportional" events) or as one ormore whole numbers ("cumulative" events).
  • 24.
    Perform resource planningand rough-cut capacity analysis
  • 25.
    Perform resource planningand rough-cut capacity analysis(Cont.)  You use rough-cut planning profiles to plan critical resources. These might be:  Bottleneck work center  Material capacities  Costs of goods transportation or a marketing campaign  The following resource types are supported:  Work center capacities  Materials  Production resources/tools  Costs
  • 26.
    Perform resource planningand rough-cut capacity analysis(Cont.)
  • 27.
    Perform resource planningand rough-cut capacity analysis(Cont.)  You define the determination of capacity load in the rough-cut planning profile.  The available capacity is read from the bottleneck work center defined in the resource table of the rough-cut profile.  The capacity load is calculated multiplying the planned quantity by the total time maintained for the work center in the rough-cut profile.  The time span of the profile header is just to model the capacity load to produce x base quantities on the bases of time.
  • 28.
  • 29.
    Mass Processing(Cont.)  Fourplanning activities can be carried out using the sequence depicted above:  Executing a macro  Forecasting  Copying key figures from one info structure to another  Transfer to or from CO-PA  Transferring SOP data to Demand Management.
  • 30.
    Transfer planning resultsto demand anagement
  • 31.
    Transfer planning resultsto Demand Management (cont.)  You can carry out the transfer of data to Demand Management either online or in the background.  There are three basic options for transferring SOP data to Demand Management:  You transfer material data from the info structure. Use mass processing to transfer a range of materials.  You transfer material data from a product group. The data is either transferred direct from the materials, or as proportions of the product group.  You transfer one material's data. The data is either transferred direct from the material, or as a proportion of the owner product group.
  • 32.
    Transfer planning resultsto Demand Management (cont.)  A material can be a member of more than one product group. This means that it can be transferred to Demand Management more than once. The system issues a warning if you try to transfer a material from a product group that has not been marked as the MRP product group for that material.  When you carry out the transfer, planned independent requirements are created in Demand Management
  • 33.