More Related Content Similar to San francisco residential dec 2010 dec 2012 Similar to San francisco residential dec 2010 dec 2012 (20) More from Ronny Budiutama More from Ronny Budiutama (20) 1. Ronny Budiutama undefined
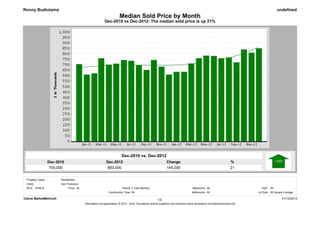
Median Sold Price by Month
Dec-2010 vs Dec-2012: The median sold price is up 21%
Dec-2010 vs. Dec-2012
Dec-2010 Dec-2012 Change %
705,000 850,000 145,000 21
Property Types: Residential
Cities: San Francisco
MLS: SFMLS Price: All Period: 2 Year Monthly Bedrooms: All SqFt: All
Construction Type: All Bathrooms: All Lot Size: All Square Footage
Clarus MarketMetrics® 1/2 01/14/2013
Information not guaranteed. © 2013 - 2014 Terradatum and its suppliers and licensors (www.terradatum.com/about/licensors.td).
2. Ronny Budiutama undefined
Median Sold Price by Month
Dec-2010 vs Dec-2012: The median sold price is up 21%
Time Period Sold Median Price Units Avg DOM
Dec-12 850,000 199 59
Nov-12 810,000 270 42
Oct-12 840,000 253 44
Sep-12 722,500 178 46
Aug-12 766,500 240 50
Jul-12 759,000 216 47
Jun-12 780,000 267 60
May-12 783,000 236 47
Apr-12 760,000 221 54
Mar-12 711,500 223 65
Feb-12 635,000 182 63
Jan-12 635,000 130 81
Dec-11 610,000 231 63
Nov-11 682,500 232 57
Oct-11 743,000 201 54
Sep-11 652,325 211 65
Aug-11 697,620 209 64
Jul-11 735,000 205 62
Jun-11 743,450 265 59
May-11 709,500 222 63
Apr-11 701,000 197 67
Mar-11 759,500 216 65
Feb-11 621,000 124 83
Jan-11 610,000 161 71
Dec-10 705,000 231 66
Clarus MarketMetrics® 2/2 01/14/2013
Information not guaranteed. © 2013 - 2014 Terradatum and its suppliers and licensors (www.terradatum.com/about/licensors.td).
3. Ronny Budiutama undefined
Median For Sale vs Median Sold
Dec-2010 vs Dec-2012: The median price of for sale properties is up 26% and the median price of sold properties is up 21%
Dec-2010 vs. Dec-2012 Dec-2010 vs. Dec-2012
Dec-2010 Dec-2012 Change % Dec-2010 Dec-2012 Change %
659,900 830,000 170,100 26 705,000 850,000 145,000 21
Property Types: Residential
Cities: San Francisco
MLS: SFMLS Price: All Period: 2 Year Monthly Bedrooms: All SqFt: All
Construction Type: All Bathrooms: All Lot Size: All Square Footage
Clarus MarketMetrics® 1/2 01/14/2013
Information not guaranteed. © 2013 - 2014 Terradatum and its suppliers and licensors (www.terradatum.com/about/licensors.td).
4. Ronny Budiutama undefined
Median For Sale vs Median Sold
Dec-2010 vs Dec-2012: The median price of for sale properties is up 26% and the median price of sold properties is up 21%
For Sale # Properties Sold # Properties Price Difference
Time Period Median For Sale Median Sold
Dec-12 830,000 381 850,000 199 20,000
Nov-12 849,000 533 810,000 270 -39,000
Oct-12 829,000 703 840,000 253 11,000
Sep-12 850,000 673 722,500 178 -127,500
Aug-12 799,000 597 766,500 240 -32,500
Jul-12 789,000 629 759,000 216 -30,000
Jun-12 799,000 637 780,000 267 -19,000
May-12 750,000 706 783,000 236 33,000
Apr-12 699,800 703 760,000 221 60,200
Mar-12 699,000 734 711,500 223 12,500
Feb-12 699,000 689 635,000 182 -64,000
Jan-12 649,475 636 635,000 130 -14,475
Dec-11 659,000 640 610,000 231 -49,000
Nov-11 678,000 833 682,500 232 4,500
Oct-11 668,000 1,013 743,000 201 75,000
Sep-11 674,497 1,056 652,325 211 -22,172
Aug-11 650,000 971 697,620 209 47,620
Jul-11 659,000 1,001 735,000 205 76,000
Jun-11 678,000 976 743,450 265 65,450
May-11 689,000 914 709,500 222 20,500
Apr-11 699,000 924 701,000 197 2,000
Mar-11 675,000 919 759,500 216 84,500
Feb-11 666,500 820 621,000 124 -45,500
Jan-11 649,000 763 610,000 161 -39,000
Dec-10 659,900 819 705,000 231 45,100
Clarus MarketMetrics® 2/2 01/14/2013
Information not guaranteed. © 2013 - 2014 Terradatum and its suppliers and licensors (www.terradatum.com/about/licensors.td).
5. Ronny Budiutama undefined
Sold Properties by Month
Dec-2010 vs Dec-2012: The number of Sold properties is down -14%
Dec-2010 vs. Dec-2012
Dec-2010 Dec-2012 Change %
231 199 -32 -14
Property Types: Residential
Cities: San Francisco
MLS: SFMLS Price: All Period: 2 Year Monthly Bedrooms: All SqFt: All
Construction Type: All Bathrooms: All Lot Size: All Square Footage
Clarus MarketMetrics® 1/2 01/14/2013
Information not guaranteed. © 2013 - 2014 Terradatum and its suppliers and licensors (www.terradatum.com/about/licensors.td).
6. Ronny Budiutama undefined
Sold Properties by Month
Dec-2010 vs Dec-2012: The number of Sold properties is down -14%
Full Market Bank Properties Non-Bank Properties
Time Period Units Median Price Avg DOM Units % Bank Median Price Units % Non-Bank Median Price
Dec-12 199 850,000 59 22 11.1 505,000 177 88.9 920,000
Nov-12 270 810,000 42 27 10.0 495,000 243 90.0 855,000
Oct-12 253 840,000 44 26 10.3 512,000 227 89.7 918,000
Sep-12 178 722,500 46 30 16.9 467,500 148 83.1 779,000
Aug-12 240 766,500 50 32 13.3 485,000 208 86.7 810,750
Jul-12 216 759,000 47 43 19.9 385,000 173 80.1 890,000
Jun-12 267 780,000 60 55 20.6 500,000 212 79.4 842,500
May-12 236 783,000 47 31 13.1 480,000 205 86.9 839,000
Apr-12 221 760,000 54 38 17.2 437,000 183 82.8 801,000
Mar-12 223 711,500 65 52 23.3 465,000 171 76.7 780,000
Feb-12 182 635,000 63 41 22.5 460,000 141 77.5 700,000
Jan-12 130 635,000 81 41 31.5 488,000 89 68.5 730,000
Dec-11 231 610,000 63 47 20.3 471,000 184 79.7 685,500
Nov-11 232 682,500 57 36 15.5 432,500 196 84.5 749,750
Oct-11 201 743,000 54 34 16.9 458,500 167 83.1 792,000
Sep-11 211 652,325 65 49 23.2 450,000 162 76.8 732,000
Aug-11 209 697,620 64 45 21.5 430,000 164 78.5 751,750
Jul-11 205 735,000 62 36 17.6 453,000 169 82.4 825,000
Jun-11 265 743,450 59 44 16.6 459,500 221 83.4 765,000
May-11 222 709,500 63 48 21.6 451,000 174 78.4 757,500
Apr-11 197 701,000 67 42 21.3 434,000 155 78.7 825,000
Mar-11 216 759,500 65 44 20.4 462,500 172 79.6 811,000
Feb-11 124 621,000 83 42 33.9 506,000 82 66.1 730,000
Jan-11 161 610,000 71 38 23.6 422,000 123 76.4 660,000
Dec-10 231 705,000 66 39 16.9 482,500 192 83.1 777,000
Clarus MarketMetrics® 2/2 01/14/2013
Information not guaranteed. © 2013 - 2014 Terradatum and its suppliers and licensors (www.terradatum.com/about/licensors.td).
7. Ronny Budiutama undefined
Under Contract Properties by Month
Dec-2010 vs Dec-2012: The number of Under Contract properties is up 3%
Dec-2010 vs. Dec-2012
Dec-2010 Dec-2012 Change %
147 152 5 3
Property Types: Residential
Cities: San Francisco
Price: All Bedrooms: All Bathrooms: All SqFt: All
MLS: SFMLS Period: 2 Year Monthly Construction Type: All Lot Size: All Square Footage
Clarus MarketMetrics® 1/2 01/14/2013
Information not guaranteed. © 2013 - 2014 Terradatum and its suppliers and licensors (www.terradatum.com/about/licensors.td).
8. Ronny Budiutama undefined
Under Contract Properties by Month
Dec-2010 vs Dec-2012: The number of Under Contract properties is up 3%
Full Market Bank Properties Non-Bank Properties
Time Period Units Median Price Avg DOM Units % Bank Median Price Units % Non-Bank Median Price
Dec-12 152 699,000 41 33 21.7 559,000 119 78.3 750,000
Nov-12 211 765,000 55 27 12.8 464,900 184 87.2 804,000
Oct-12 295 799,000 36 28 9.5 464,950 267 90.5 815,000
Sep-12 227 799,000 42 27 11.9 457,900 200 88.1 849,000
Aug-12 199 699,000 36 22 11.1 415,000 177 88.9 749,000
Jul-12 237 729,000 46 34 14.3 494,450 203 85.7 779,000
Jun-12 204 699,000 47 33 16.2 399,999 171 83.8 799,000
May-12 277 738,000 55 52 18.8 446,250 225 81.2 799,000
Apr-12 221 700,000 50 38 17.2 493,900 183 82.8 799,000
Mar-12 256 717,450 51 51 19.9 425,000 205 80.1 799,000
Feb-12 214 704,231 65 51 23.8 450,000 163 76.2 775,000
Jan-12 167 649,000 67 46 27.5 420,000 121 72.5 780,000
Dec-11 134 604,500 76 30 22.4 494,450 104 77.6 677,000
Nov-11 216 614,000 71 51 23.6 429,000 165 76.4 699,000
Oct-11 248 660,000 66 59 23.8 469,900 189 76.2 775,000
Sep-11 219 700,000 61 33 15.1 488,000 186 84.9 787,000
Aug-11 214 679,000 62 45 21.0 444,900 169 79.0 738,000
Jul-11 223 649,888 57 48 21.5 434,777 175 78.5 725,000
Jun-11 221 699,000 64 43 19.5 429,900 178 80.5 762,000
May-11 239 725,000 57 39 16.3 449,000 200 83.7 798,000
Apr-11 213 729,000 57 35 16.4 488,000 178 83.6 793,500
Mar-11 229 699,000 67 62 27.1 434,900 167 72.9 799,000
Feb-11 192 739,000 64 39 20.3 469,900 153 79.7 799,000
Jan-11 150 630,315 82 52 34.7 446,200 98 65.3 703,200
Dec-10 147 630,000 81 41 27.9 419,900 106 72.1 674,500
Clarus MarketMetrics® 2/2 01/14/2013
Information not guaranteed. © 2013 - 2014 Terradatum and its suppliers and licensors (www.terradatum.com/about/licensors.td).
9. Ronny Budiutama undefined
New Properties by Month
Dec-2010 vs Dec-2012: The number of New properties is down -12%
Dec-2010 vs. Dec-2012
Dec-2010 Dec-2012 Change %
103 91 -12 -12
Property Types: Residential
Cities: San Francisco
MLS: SFMLS Price: All Period: 2 Year Monthly Bedrooms: All SqFt: All
Construction Type: All Bathrooms: All Lot Size: All Square Footage
Clarus MarketMetrics® 1/2 01/14/2013
Information not guaranteed. © 2013 - 2014 Terradatum and its suppliers and licensors (www.terradatum.com/about/licensors.td).
10. Ronny Budiutama undefined
New Properties by Month
Dec-2010 vs Dec-2012: The number of New properties is down -12%
Full Market Bank Properties Non-Bank Properties
Time Period Units Median Price Units % Bank Median Price Units % Non-Bank Median Price
Dec-12 91 675,000 22 24.2 543,450 69 75.8 699,000
Nov-12 176 787,000 23 13.1 559,000 153 86.9 799,000
Oct-12 292 789,000 32 11.0 501,700 260 89.0 799,475
Sep-12 321 850,000 32 10.0 454,500 289 90.0 939,000
Aug-12 256 792,000 27 10.5 449,900 229 89.5 825,000
Jul-12 255 699,000 33 12.9 498,000 222 87.1 762,500
Jun-12 260 829,000 30 11.5 450,000 230 88.5 871,000
May-12 265 829,000 43 16.2 449,000 222 83.8 949,000
Apr-12 267 720,000 48 18.0 486,400 219 82.0 799,000
Mar-12 297 725,000 49 16.5 431,700 248 83.5 818,500
Feb-12 262 749,000 51 19.5 424,900 211 80.5 830,000
Jan-12 249 675,000 61 24.5 415,000 188 75.5 791,652
Dec-11 121 559,900 47 38.8 474,900 74 61.2 644,000
Nov-11 151 678,000 39 25.8 459,999 112 74.2 749,500
Oct-11 260 678,500 52 20.0 402,375 208 80.0 727,500
Sep-11 397 735,000 74 18.6 462,450 323 81.4 798,000
Aug-11 289 649,000 58 20.1 468,900 231 79.9 715,000
Jul-11 330 692,000 62 18.8 492,450 268 81.2 738,500
Jun-11 349 698,000 78 22.3 430,550 271 77.7 775,000
May-11 279 699,000 65 23.3 430,000 214 76.7 761,500
Apr-11 293 779,000 43 14.7 475,000 250 85.3 849,499
Mar-11 345 699,000 75 21.7 439,900 270 78.3 798,500
Feb-11 287 690,000 72 25.1 450,550 215 74.9 799,000
Jan-11 274 686,500 69 25.2 467,500 205 74.8 750,000
Dec-10 103 560,000 46 44.7 494,450 57 55.3 695,000
Clarus MarketMetrics® 2/2 01/14/2013
Information not guaranteed. © 2013 - 2014 Terradatum and its suppliers and licensors (www.terradatum.com/about/licensors.td).
11. Ronny Budiutama undefined
For Sale Properties by Month
Dec-2010 vs Dec-2012: The number of For Sale properties is down -53%
Dec-2010 vs. Dec-2012
Dec-2010 Dec-2012 Change %
819 381 -438 -53
Property Types: Residential
Cities: San Francisco
MLS: SFMLS Price: All Period: 2 Year Monthly Bedrooms: All SqFt: All
Construction Type: All Bathrooms: All Lot Size: All Square Footage
Clarus MarketMetrics® 1/2 01/14/2013
Information not guaranteed. © 2013 - 2014 Terradatum and its suppliers and licensors (www.terradatum.com/about/licensors.td).
12. Ronny Budiutama undefined
For Sale Properties by Month
Dec-2010 vs Dec-2012: The number of For Sale properties is down -53%
Full Market Bank Properties Non-Bank Properties
Time Period Units Median Price Avg DOM Units % Bank Median Price Units % Non-Bank Median Price
Dec-12 381 830,000 71 60 15.7 559,450 321 84.3 900,000
Nov-12 533 849,000 61 68 12.8 502,195 465 87.2 900,000
Oct-12 703 829,000 55 82 11.7 485,000 621 88.3 899,000
Sep-12 673 850,000 54 84 12.5 459,950 589 87.5 949,000
Aug-12 597 799,000 60 83 13.9 450,000 514 86.1 877,000
Jul-12 629 789,000 63 102 16.2 479,450 527 83.8 889,000
Jun-12 637 799,000 65 116 18.2 450,000 521 81.8 925,000
May-12 706 750,000 69 156 22.1 454,750 550 77.9 899,000
Apr-12 703 699,800 70 162 23.0 466,944 541 77.0 825,000
Mar-12 734 699,000 70 177 24.1 449,500 557 75.9 799,000
Feb-12 689 699,000 80 194 28.2 450,000 495 71.8 799,000
Jan-12 636 649,475 91 201 31.6 450,000 435 68.4 775,000
Dec-11 640 659,000 108 191 29.8 470,000 449 70.2 749,000
Nov-11 833 678,000 94 216 25.9 457,000 617 74.1 750,000
Oct-11 1,013 668,000 81 259 25.6 455,000 754 74.4 749,000
Sep-11 1,056 674,497 75 263 24.9 467,900 793 75.1 759,000
Aug-11 971 650,000 80 257 26.5 459,000 714 73.5 749,000
Jul-11 1,001 659,000 76 268 26.8 449,900 733 73.2 759,000
Jun-11 976 678,000 77 265 27.2 435,000 711 72.8 786,000
May-11 914 689,000 77 233 25.5 448,888 681 74.5 799,000
Apr-11 924 699,000 74 223 24.1 449,950 701 75.9 799,000
Mar-11 919 675,000 74 258 28.1 448,944 661 71.9 795,000
Feb-11 820 666,500 80 238 29.0 454,600 582 71.0 796,225
Jan-11 763 649,000 94 234 30.7 449,925 529 69.3 775,000
Dec-10 819 659,900 104 231 28.2 435,000 588 71.8 779,000
Clarus MarketMetrics® 2/2 01/14/2013
Information not guaranteed. © 2013 - 2014 Terradatum and its suppliers and licensors (www.terradatum.com/about/licensors.td).
13. Ronny Budiutama undefined
Expired Properties by Month
Dec-2010 vs Dec-2012: The number of Expired properties is down -69%
Dec-2010 vs. Dec-2012
Dec-2010 Dec-2012 Change %
183 56 -127 -69
Property Types: Residential
Cities: San Francisco
MLS: SFMLS Price: All Period: 2 Year Monthly Bedrooms: All SqFt: All
Construction Type: All Bathrooms: All Lot Size: All Square Footage
Clarus MarketMetrics® 1/2 01/14/2013
14. Ronny Budiutama undefined
Expired Properties by Month
Dec-2010 vs Dec-2012: The number of Expired properties is down -69%
Full Market Bank Properties Non-Bank Properties
Units Median Price Avg DOM Units % Bank Median Price Units % Non-Bank Median Price
Dec-12 56 1,347,500 81 5 8.9 499,000 51 91.1 1,495,000
Nov-12 32 1,234,500 79 3 9.4 680,000 29 90.6 1,395,000
Oct-12 51 988,000 119 9 17.6 528,000 42 82.4 1,219,000
Sep-12 35 918,000 71 7 20.0 368,000 28 80.0 999,000
Aug-12 46 833,500 85 9 19.6 499,000 37 80.4 1,059,000
Jul-12 51 1,360,000 84 12 23.5 474,500 39 76.5 1,699,000
Jun-12 59 879,000 72 14 23.7 512,050 45 76.3 1,095,000
May-12 52 678,500 69 18 34.6 454,750 34 65.4 898,500
Apr-12 41 675,000 81 11 26.8 487,000 30 73.2 789,000
Mar-12 42 639,475 87 12 28.6 424,500 30 71.4 764,000
Feb-12 38 649,500 122 15 39.5 484,950 23 60.5 949,000
Jan-12 42 599,450 120 12 28.6 444,500 30 71.4 799,000
Dec-11 119 770,000 113 21 17.6 490,000 98 82.4 849,500
Nov-11 98 669,000 96 21 21.4 450,000 77 78.6 764,000
Oct-11 83 629,000 101 23 27.7 449,000 60 72.3 723,000
Sep-11 84 668,500 104 23 27.4 405,000 61 72.6 738,000
Aug-11 98 759,500 92 23 23.5 448,888 75 76.5 799,950
Jul-11 96 699,475 92 21 21.9 435,000 75 78.1 786,000
Jun-11 84 769,000 109 16 19.0 404,500 68 81.0 849,500
May-11 48 784,000 108 7 14.6 434,900 41 85.4 850,000
Apr-11 76 676,500 113 20 26.3 425,000 56 73.7 786,500
Mar-11 59 670,000 108 16 27.1 524,500 43 72.9 729,000
Feb-11 54 622,000 116 16 29.6 479,500 38 70.4 799,000
Jan-11 80 699,000 119 16 20.0 409,500 64 80.0 779,000
Dec-10 183 799,000 115 25 13.7 417,000 158 86.3 843,500
Clarus MarketMetrics® 2/2 01/14/2013
Information not guaranteed. © 2013 - 2014 Terradatum and its suppliers and licensors (www.terradatum.com/about/licensors.td).
15. Ronny Budiutama undefined
Supply & Demand by Month
Dec-2010 vs Dec-2012: The number of for sale properties is down -53% and the number of sold properties is down -14%
Dec-2010 vs. Dec-2012 Dec-2010 vs. Dec-2012
Dec-2010 Dec-2012 Change % Dec-2010 Dec-2012 Change %
819 381 -438 -53 231 199 -32 -14
Property Types: Residential
Cities: San Francisco
MLS: SFMLS Price: All Period: 2 Year Monthly Bedrooms: All SqFt: All
Construction Type: All Bathrooms: All Lot Size: All Square Footage
Clarus MarketMetrics® 1/2 01/14/2013
Information not guaranteed. © 2013 - 2014 Terradatum and its suppliers and licensors (www.terradatum.com/about/licensors.td).
16. Ronny Budiutama undefined
Supply & Demand by Month
Dec-2010 vs Dec-2012: The number of for sale properties is down -53% and the number of sold properties is down -14%
# Properties # Properties
Time Period For Sale Avg DOM Sold Avg DOM
Dec-12 381 71 199 59
Nov-12 533 61 270 42
Oct-12 703 55 253 44
Sep-12 673 54 178 46
Aug-12 597 60 240 50
Jul-12 629 63 216 47
Jun-12 637 65 267 60
May-12 706 69 236 47
Apr-12 703 70 221 54
Mar-12 734 70 223 65
Feb-12 689 80 182 63
Jan-12 636 91 130 81
Dec-11 640 108 231 63
Nov-11 833 94 232 57
Oct-11 1,013 81 201 54
Sep-11 1,056 75 211 65
Aug-11 971 80 209 64
Jul-11 1,001 76 205 62
Jun-11 976 77 265 59
May-11 914 77 222 63
Apr-11 924 74 197 67
Mar-11 919 74 216 65
Feb-11 820 80 124 83
Jan-11 763 94 161 71
Dec-10 819 104 231 66
Clarus MarketMetrics® 2/2 01/14/2013
Information not guaranteed. © 2013 - 2014 Terradatum and its suppliers and licensors (www.terradatum.com/about/licensors.td).
17. Ronny Budiutama undefined
The Average Days on Market by Month
Dec-2010 vs Dec-2012: The average days on market is down -49%
Dec-2010 vs. Dec-2012
Dec-2010 Dec-2012 Change %
81 41 -40 -49
Property Types: Residential
Cities: San Francisco
MLS: SFMLS Price: All Period: 2 Year Monthly Bedrooms: All SqFt: All
Construction Type: All Bathrooms: All Lot Size: All Square Footage
Clarus MarketMetrics® 1/2 01/14/2013
18. Ronny Budiutama undefined
The Average Days on Market by Month
Dec-2010 vs Dec-2012: The average days on market is down -49%
Time Period Avg DOM # UC Units
Dec-12 41 152
Nov-12 55 211
Oct-12 36 295
Sep-12 42 227
Aug-12 36 199
Jul-12 46 237
Jun-12 47 204
May-12 55 277
Apr-12 50 221
Mar-12 51 256
Feb-12 65 214
Jan-12 67 167
Dec-11 76 134
Nov-11 71 216
Oct-11 66 248
Sep-11 61 219
Aug-11 62 214
Jul-11 57 223
Jun-11 64 221
May-11 57 239
Apr-11 57 213
Mar-11 67 229
Feb-11 64 192
Jan-11 82 150
Dec-10 81 147
Clarus MarketMetrics® 2/2 01/14/2013
Information not guaranteed. © 2013 - 2014 Terradatum and its suppliers and licensors (www.terradatum.com/about/licensors.td).
19. Ronny Budiutama undefined
Months Supply of Inventory
Dec-2010 vs Dec-2012: The average months supply of inventory is down -66%
Dec-2010 vs. Dec-2012
Dec-2010 Dec-2012 Change %
3.3 1.1 -2.2 -66
Property Types: Residential
Cities: San Francisco
MLS: SFMLS Price: All Period: 2 Year Monthly Bedrooms: All SqFt: All
Construction Type: All Bathrooms: All Lot Size: All Square Footage
Clarus MarketMetrics® 1/2 01/14/2013
Information not guaranteed. © 2013 - 2014 Terradatum and its suppliers and licensors (www.terradatum.com/about/licensors.td).
20. Ronny Budiutama undefined
Months Supply of Inventory
Dec-2010 vs Dec-2012: The average months supply of inventory is down -66%
# Units For Sale # UC Units
Time Period Last Day of Month During Month MSI UC Avg DOM
Dec-12 173 152 1.1 41
Nov-12 290 211 1.4 55
Oct-12 357 295 1.2 36
Sep-12 411 227 1.8 42
Aug-12 352 199 1.8 36
Jul-12 341 237 1.4 46
Jun-12 374 204 1.8 47
May-12 377 277 1.4 55
Apr-12 441 221 2.0 50
Mar-12 436 256 1.7 51
Feb-12 437 214 2.0 65
Jan-12 427 167 2.6 67
Dec-11 387 134 2.9 76
Nov-11 519 216 2.4 71
Oct-11 682 248 2.8 66
Sep-11 753 219 3.4 61
Aug-11 659 214 3.1 62
Jul-11 682 223 3.1 57
Jun-11 671 221 3.0 64
May-11 627 239 2.6 57
Apr-11 635 213 3.0 57
Mar-11 631 229 2.8 67
Feb-11 574 192 3.0 64
Jan-11 533 150 3.6 82
Dec-10 489 147 3.3 81
Clarus MarketMetrics® 2/2 01/14/2013
Information not guaranteed. © 2013 - 2014 Terradatum and its suppliers and licensors (www.terradatum.com/about/licensors.td).