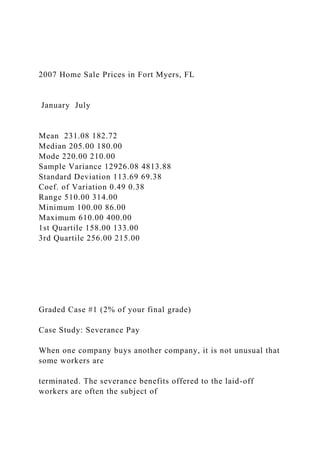
Sample Case with a report
Dawit Zerom, Instructor
Case Study: Ft. Myers Home Sales
Due to a crisis in subprime lending, obtaining a mortgage has
become difficult even for
people with solid credit. In a report by the Associated Press
(August 25, 2007), sales of
existing homes fell for a 5th consecutive month, while home
prices dropped for a record
12th month in July 2007. Mayan Horowitz, a research analyst
for QuantExperts, wishes to
study how the mortgage crunch has impacted the once booming
market of Florida. He
collects data on the sale price (in $1, 000s) of 25 single-family
homes in Fort Myers,
Florida, in January 2007 and collects another sample in July
2007. For a valid
comparison, he samples only three bedroom homes, each with
1,500 square feet or less of
space on a lot size of 10, 000 square feet or less.
Excel data are available in Titanium page.
Use the sample information (appropriate descriptive statistics)
to address the following
aspects. Your report should not exceed one page.
1. Compare the mean and median in each of the two sample
periods.
2. Compare the standard deviation and coefficient of variation
in each of the two sample
periods. Also incorporate quartiles.
3. Discuss significant changes in the housing market in Fort
Myers over the 6-month
period.
Sample Case with a report
Dawit Zerom, Instructor
Sample Report
The steady stream of dismal housing market statistics lately is a
clear indication that the national
real estate market is in a serious crisis. The uncertainty is also
forcing lenders to slow down on
their lending, and as a result obtaining a mortgage is becoming
increasingly difficult even for
people with solid credit. In light of this situation, Mayan
Horowitz conducts a small study to
learn if the national trend also affects the once booming market
of Florida by focusing on Fort
Myers, Florida. To see the trend of the housing market over a 6-
month period, he obtains price of
25 single family homes in January 2007 and another comparable
25 single family homes in July
2007. Table 1 below shows the most relevant descriptive
analysis.
The average home price in January of 2007 was $231, 080
versus $182, 720 in July of the same
year. That is about a 21% drop in the average home price. Also
in January, half of the homes
sold for more than $205,000, versus only $180,000 in July (see
the median). Since the mean is
more effected by outliers (in this case, a few relatively high
prices), the median is an appropriate
measure of central location.
While measures of central location typically represent where the
data clusters, these measures do
not relay information about the variability in the data. Both the
standard deviation and the
coefficient of variation are higher in January indicating that
home prices were more dispersed in
January. Further, while 25% of the houses were sold at the price
of $158, 000 or less in January,
the first quartile for July is only $133, 000. The third quartile is
also larger in January.
In summary, the above statistical analysis shows Fort Myers is
no different from the national
trend, and is well affected by the housing crisis. On a positive
note, over the 6-month period,
Fort Myers became a buyers’ market; of course for people who
can borrow.
Sample Case with a report
Dawit Zerom, Instructor
Table 1: Summary measures for January 2007 and July 2007
2007 Home Sale Prices in Fort Myers, FL
January July
Mean 231.08 182.72
Median 205.00 180.00
Mode 220.00 210.00
Sample Variance 12926.08 4813.88
Standard Deviation 113.69 69.38
Coef. of Variation 0.49 0.38
Range 510.00 314.00
Minimum 100.00 86.00
Maximum 610.00 400.00
1st Quartile 158.00 133.00
3rd Quartile 256.00 215.00
Graded Case #1 (2% of your final grade)
Case Study: Severance Pay
When one company buys another company, it is not unusual that
some workers are
terminated. The severance benefits offered to the laid-off
workers are often the subject of
dispute. Suppose that the Laurier Company recently bought the
Western Company and
subsequently terminated 20 of Western’s employees. As part of
the buyout agreement, it
was promised that the severance package offered to the former
Western employees would
be equivalent to those offered to Laurier employees who had
been terminated in the past
year. Thirty-six-year-old Bill Smith, a Western employee for
the past 10 years, was one
of those let go. His severance package included an offer of 5
weeks’ severance pay. Bill
complained that this offer was less than that offered to Laurier’s
employees when they
were laid off, in contravention of the buyout agreement. A
statistician was called in to
settle the dispute. The statistician was told that severance is
determined by length of
service with the company. To determine how generous the
severance package had been, a
random sample of 50 Laurier ex-employees was taken. For each,
the following variables
were recorded:
Number of weeks of severance pay
Number of years with the company
The statistician would like to use the above sample information
and the appropriate
statistical method to determine whether Bill is correct in his
assessment of the severance
package. Your report should have the following qualities:
• Your report must be in a genuine report format with problem
definition, analysis
and final conclusion.
• All important analysis steps needs to be followed to arrive at
the model to be
used for prediction. Attach the details of your analysis at the
end of your report.
Very simplistic analysis with no sufficient details is assigned a
near zero credit.
Just running excel does not guarantee any credit.
• Your final conclusion should use both versions of 95%
confidence intervals.
Improper use of these and corresponding wrong/sloppy
interpretations is highly
penalized.
Ft. Myers
SalesNumberJanuaryJuly11001362190235312597461017952601
56616720072552198205400925686103302151146012512242133
13220199141402101515825516130148171442101817612619220
12020231285211602022231521823143902434014425200180
Sheet1Weeks SPYears131613191181416341094372Weeks
SPNumber of weeks of severance pay1215715YearsNumber of
years with the
company813111095101318191720131114195211151014861516
76981112101381457641412121710111414121712178812161010
11131519568911111515111365671314910
&A
Page &P
Sheet2

Sample Case with a report Dawit Zerom, Instructor Cas.docx

  • 1.
    Sample Case witha report Dawit Zerom, Instructor Case Study: Ft. Myers Home Sales Due to a crisis in subprime lending, obtaining a mortgage has become difficult even for people with solid credit. In a report by the Associated Press (August 25, 2007), sales of existing homes fell for a 5th consecutive month, while home prices dropped for a record 12th month in July 2007. Mayan Horowitz, a research analyst for QuantExperts, wishes to study how the mortgage crunch has impacted the once booming market of Florida. He collects data on the sale price (in $1, 000s) of 25 single-family homes in Fort Myers, Florida, in January 2007 and collects another sample in July 2007. For a valid comparison, he samples only three bedroom homes, each with 1,500 square feet or less of space on a lot size of 10, 000 square feet or less.
  • 2.
    Excel data areavailable in Titanium page. Use the sample information (appropriate descriptive statistics) to address the following aspects. Your report should not exceed one page. 1. Compare the mean and median in each of the two sample periods. 2. Compare the standard deviation and coefficient of variation in each of the two sample periods. Also incorporate quartiles. 3. Discuss significant changes in the housing market in Fort Myers over the 6-month period. Sample Case with a report Dawit Zerom, Instructor Sample Report The steady stream of dismal housing market statistics lately is a
  • 3.
    clear indication thatthe national real estate market is in a serious crisis. The uncertainty is also forcing lenders to slow down on their lending, and as a result obtaining a mortgage is becoming increasingly difficult even for people with solid credit. In light of this situation, Mayan Horowitz conducts a small study to learn if the national trend also affects the once booming market of Florida by focusing on Fort Myers, Florida. To see the trend of the housing market over a 6- month period, he obtains price of 25 single family homes in January 2007 and another comparable 25 single family homes in July 2007. Table 1 below shows the most relevant descriptive analysis. The average home price in January of 2007 was $231, 080 versus $182, 720 in July of the same year. That is about a 21% drop in the average home price. Also in January, half of the homes sold for more than $205,000, versus only $180,000 in July (see the median). Since the mean is more effected by outliers (in this case, a few relatively high prices), the median is an appropriate
  • 4.
    measure of centrallocation. While measures of central location typically represent where the data clusters, these measures do not relay information about the variability in the data. Both the standard deviation and the coefficient of variation are higher in January indicating that home prices were more dispersed in January. Further, while 25% of the houses were sold at the price of $158, 000 or less in January, the first quartile for July is only $133, 000. The third quartile is also larger in January. In summary, the above statistical analysis shows Fort Myers is no different from the national trend, and is well affected by the housing crisis. On a positive note, over the 6-month period, Fort Myers became a buyers’ market; of course for people who can borrow. Sample Case with a report Dawit Zerom, Instructor Table 1: Summary measures for January 2007 and July 2007
  • 5.
    2007 Home SalePrices in Fort Myers, FL January July Mean 231.08 182.72 Median 205.00 180.00 Mode 220.00 210.00 Sample Variance 12926.08 4813.88 Standard Deviation 113.69 69.38 Coef. of Variation 0.49 0.38 Range 510.00 314.00 Minimum 100.00 86.00 Maximum 610.00 400.00 1st Quartile 158.00 133.00 3rd Quartile 256.00 215.00 Graded Case #1 (2% of your final grade) Case Study: Severance Pay When one company buys another company, it is not unusual that some workers are terminated. The severance benefits offered to the laid-off workers are often the subject of
  • 6.
    dispute. Suppose thatthe Laurier Company recently bought the Western Company and subsequently terminated 20 of Western’s employees. As part of the buyout agreement, it was promised that the severance package offered to the former Western employees would be equivalent to those offered to Laurier employees who had been terminated in the past year. Thirty-six-year-old Bill Smith, a Western employee for the past 10 years, was one of those let go. His severance package included an offer of 5 weeks’ severance pay. Bill complained that this offer was less than that offered to Laurier’s employees when they were laid off, in contravention of the buyout agreement. A statistician was called in to settle the dispute. The statistician was told that severance is determined by length of service with the company. To determine how generous the severance package had been, a random sample of 50 Laurier ex-employees was taken. For each, the following variables were recorded: Number of weeks of severance pay
  • 7.
    Number of yearswith the company The statistician would like to use the above sample information and the appropriate statistical method to determine whether Bill is correct in his assessment of the severance package. Your report should have the following qualities: • Your report must be in a genuine report format with problem definition, analysis and final conclusion. • All important analysis steps needs to be followed to arrive at the model to be used for prediction. Attach the details of your analysis at the end of your report. Very simplistic analysis with no sufficient details is assigned a near zero credit. Just running excel does not guarantee any credit. • Your final conclusion should use both versions of 95% confidence intervals. Improper use of these and corresponding wrong/sloppy interpretations is highly penalized.
  • 8.
    Ft. Myers SalesNumberJanuaryJuly11001362190235312597461017952601 56616720072552198205400925686103302151146012512242133 13220199141402101515825516130148171442101817612619220 12020231285211602022231521823143902434014425200180 Sheet1Weeks SPYears131613191181416341094372Weeks SPNumberof weeks of severance pay1215715YearsNumber of years with the company813111095101318191720131114195211151014861516 76981112101381457641412121710111414121712178812161010 11131519568911111515111365671314910 &A Page &P Sheet2