1. RYDER SYSTEM, INC. AND SUBSIDIARIES
CONSOLIDATED CONDENSED STATEMENTS OF EARNINGS - UNAUDITED
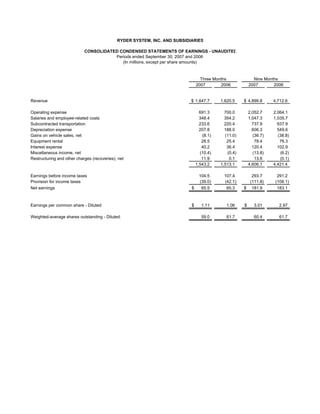
Periods ended September 30, 2007 and 2006
(In millions, except per share amounts)
Three Months Nine Months
2007 2006 2007 2006
Revenue $ 1,647.7 1,620.5 $ 4,899.8 4,712.6
Operating expense 691.3 700.0 2,052.7 2,064.1
Salaries and employee-related costs 348.4 354.2 1,047.3 1,035.7
Subcontracted transportation 233.6 220.4 737.9 637.9
Depreciation expense 207.8 188.0 606.3 549.6
Gains on vehicle sales, net (8.1) (11.0) (36.7) (38.8)
Equipment rental 28.5 25.4 78.4 76.3
Interest expense 40.2 36.4 120.4 102.9
Miscellaneous income, net (10.4) (0.4) (13.8) (6.2)
Restructuring and other charges (recoveries), net 11.9 0.1 13.6 (0.1)
1,543.2 1,513.1 4,606.1 4,421.4
Earnings before income taxes 104.5 107.4 293.7 291.2
Provision for income taxes (39.0) (42.1) (111.8) (108.1)
Net earnings $ 65.5 65.3 $ 181.9 183.1
Earnings per common share - Diluted: $ 1.11 1.06 $ 3.01 2.97
Weighted-average shares outstanding - Diluted: 59.0 61.7 60.4 61.7
2. RYDER SYSTEM, INC. AND SUBSIDIARIES
CONSOLIDATED CONDENSED BALANCE SHEETS
PRELIMINARY AND SUBJECT TO RECLASSIFICATION
(Dollars in millions)
(unaudited)
September 30, December 31,
2007 2006
Assets:
Cash and cash equivalents $ 106.2 128.6
Other current assets 1,165.8 1,133.2
Revenue earning equipment, net 4,537.2 4,509.3
Operating property and equipment, net 511.2 499.0
Other assets 565.2 558.8
$ 6,885.6 6,828.9
Liabilities and shareholders' equity:
Short-term debt / current portion of long-term debt $ 385.9 332.7
Other current liabilities 912.2 934.9
Long-term debt 2,430.2 2,484.2
Other non-current liabilities (including deferred income taxes) 1,371.0 1,356.3
Shareholders' equity 1,786.3 1,720.8
$ 6,885.6 6,828.9
SELECTED KEY RATIOS
September 30, December 31,
2007 2006
Debt to equity 158% 164%
Total obligations to equity (a) * 169% 168%
Twelve months ended September 30,
2007 2006
Return on average shareholders' equity (b) 14.1% 15.3%
Return on average assets (b) 3.6% 3.9%
Return on capital * 7.4% 8.0%
(a) Total obligations represent debt plus off-balance sheet equipment obligations.
(b) Includes the effect of accounting changes.
* Non-GAAP financial measure; see reconciliation to closest GAAP financial measure included within this
release.
3. RYDER SYSTEM, INC. AND SUBSIDIARIES
BUSINESS SEGMENT REVENUE AND EARNINGS - UNAUDITED
Periods ended September 30, 2007 and 2006
(Dollars in millions)
Three Months Nine Months
2007 2006 B(W) 2007 2006 B(W)
Revenue:
Fleet Management Solutions:
Full service lease $ 496.2 464.3 7% $ 1,461.4 1,375.8 6%
Contract maintenance 40.9 37.3 10% 118.1 104.0 14%
Contractual revenue 537.1 501.6 7% 1,579.5 1,479.8 7%
Contract-related maintenance 48.1 49.3 (3%) 150.3 144.4 4%
Commercial rental 155.0 181.5 (15%) 431.3 502.3 (14%)
Other 18.3 17.7 3% 53.6 53.2 1%
Fuel 293.4 309.9 (5%) 862.6 911.0 (5%)
Total Fleet Management Solutions 1,051.9 1,060.0 (1%) 3,077.3 3,090.7 -
Supply Chain Solutions 554.0 513.8 8% 1,704.4 1,485.4 15%
Dedicated Contract Carriage 143.8 146.4 (2%) 423.4 428.6 (1%)
Eliminations (102.0) (99.7) (2%) (305.3) (292.1) (5%)
Total revenue $ 1,647.7 1,620.5 2% $ 4,899.8 4,712.6 4%
Operating Revenue: *
Fleet Management Solutions $ 758.5 750.1 1% $ 2,214.7 2,179.7 2%
Supply Chain Solutions 325.3 299.1 9% 977.3 862.8 13%
Dedicated Contract Carriage 138.9 140.7 (1%) 412.6 413.3 -
Eliminations (52.0) (50.3) (3%) (157.6) (147.6) (7%)
Total operating revenue $ 1,170.7 1,139.6 3% $ 3,447.0 3,308.2 4%
Business segment earnings:
Earnings before income taxes:
Fleet Management Solutions $ 93.2 103.7 (10%) $ 271.4 273.5 (1%)
Supply Chain Solutions 17.4 16.4 6% 44.3 45.1 (2%)
Dedicated Contract Carriage 12.3 11.7 5% 35.2 31.4 12%
Eliminations (6.4) (8.6) 25% (23.2) (24.6) 6%
116.5 123.2 (5%) 327.7 325.4 1%
Unallocated Central Support Services (10.1) (9.8) (2%) (30.4) (28.4) (7%)
Earnings before restructuring and
other items and income taxes 106.4 113.4 (6%) 297.3 297.0 -
Restructuring and other (charges)/recoveries, net
and other items (1.9) (6.0) NM (3.6) (5.8) NM
Earnings before income taxes 104.5 107.4 (3%) 293.7 291.2 1%
Provision for income taxes (39.0) (42.1) 8% (111.8) (108.1) (3%)
Net earnings $ 65.5 65.3 - $ 181.9 183.1 (1%)
* Non-GAAP financial measure
Note: Amounts may not recalculate due to rounding.
4. RYDER SYSTEM, INC. AND SUBSIDIARIES
BUSINESS SEGMENT INFORMATION - UNAUDITED
Periods ended September 30, 2007 and 2006
(Dollars in Millions)
Three Months Nine Months
2007 2006 B(W) 2007 2006 B(W)
Fleet Management Solutions
Total revenue $ 1,051.9 1,060.0 (1%) $ 3,077.3 3,090.7 -
Fuel revenue (293.4) (309.9) (5%) (862.6) (911.0) (5%)
Operating revenue * $ 758.5 750.1 1% $ 2,214.7 2,179.7 2%
Segment earnings before income taxes $ 93.2 103.7 (10%) $ 271.4 273.5 (1%)
Earnings before income taxes as % of total revenue 8.9% 9.8% 8.8% 8.9%
Earnings before income taxes as % of operating revenue * 12.3% 13.8% 12.3% 12.5%
Supply Chain Solutions
Total revenue $ 554.0 513.8 8% $ 1,704.4 1,485.4 15%
Subcontracted transportation (228.7) (214.7) 7% (727.1) (622.6) 17%
Operating revenue * $ 325.3 299.1 9% $ 977.3 862.8 13%
Segment earnings before income taxes $ 17.4 16.4 6% $ 44.3 45.1 (2%)
Earnings before income taxes as % of total revenue 3.1% 3.2% 2.6% 3.0%
Earnings before income taxes as % of operating revenue * 5.3% 5.5% 4.5% 5.2%
Memo: Fuel costs $ 29.7 26.6 (12%) $ 88.9 79.3 (12%)
Dedicated Contract Carriage
Total revenue $ 143.8 146.4 (2%) $ 423.4 428.6 (1%)
Subcontracted transportation (4.9) (5.7) (15%) (10.8) (15.3) (30%)
Operating revenue * $ 138.9 140.7 (1%) $ 412.6 413.3 -
Segment earnings before income taxes $ 12.3 11.7 5% $ 35.2 31.4 12%
Earnings before income taxes as % of total revenue 8.5% 8.0% 8.3% 7.3%
Earnings before income taxes as % of operating revenue * 8.8% 8.3% 8.5% 7.6%
Memo: Fuel costs $ 26.7 27.8 4% $ 77.9 80.4 3%
* Non-GAAP financial measure
Note: Amounts may not recalculate due to rounding.
5. RYDER SYSTEM, INC. AND SUBSIDIARIES
NON-GAAP FINANCIAL MEASURE RECONCILIATIONS - PRELIMINARY AND UNAUDITED
(In millions)
OPERATING REVENUE RECONCILIATION Three Months Nine Months
2007 2006 2007 2006
Total revenue $ 1,647.7 1,620.5 $ 4,899.8 4,712.6
Fuel services and subcontracted transportation revenue (527.0) (530.3) (1,600.5) (1,548.9)
Fuel eliminations 50.0 49.4 147.7 144.5
Operating revenue * $ 1,170.7 1,139.6 $ 3,447.0 3,308.2
CASH FLOW RECONCILIATION Nine months ended September 30,
2007 2006
Net cash provided by operating activities $ 837.3 611.6
Proceeds from sales (primarily revenue earning equipment) 296.5 256.9
Proceeds from sale & leaseback of assets 150.3 -
Collections on direct finance leases 47.0 51.3
Other, net 1.1 2.1
Total cash generated * 1,332.2 921.9
Capital expenditures (1,093.5) (1,171.6)
Acquisitions - (4.1)
Free cash flow * $ 238.7 (253.8)
DEBT TO EQUITY RECONCILIATION September 30, December 31,
2007 % to Equity % to Equity
2006
On-balance sheet debt $ 2,816.1 158% $ 2,816.9 164%
Off-balance sheet debt - PV of minimum lease payments
and guaranteed residual values under operating leases
for vehicles (a) 197.9 78.0
Total obligations * $ 3,014.0 169% $ 2,894.9 168%
RETURN ON CAPITAL RECONCILIATION Twelve months ended September 30,
2007 2006
Net earnings (12-month rolling period) $ 247.7 241.9
- Discontinued operations - (1.7)
+ Cumulative effect of change in accounting principle - 2.4
+ Income taxes 147.7 142.4
Adjusted earnings before income taxes 395.4 385.0
+ Adjusted interest expense (b) 165.7 140.4
- Adjusted income taxes (c) (210.9) (202.8)
= Adjusted net earnings for ROC (numerator) $ 350.2 322.6
Average total debt $ 2,829.8 2,349.6
+ Average off-balance sheet debt 124.3 110.4
+ Average adjusted total shareholders' equity (d) 1,749.8 1,577.4
= Adjusted average total capital (denominator) $ 4,703.9 4,037.4
Adjusted ROC * 7.4% 8.0%
Notes:
(a) Discounted at the incremental borrowing rate at lease inception.
(b) Interest expense includes implied interest on off-balance sheet vehicle obligations.
(c) Income taxes were calculated using the effective income tax rate for the period exclusive of
benefits from tax law changes recognized in 2006.
(d) Represents shareholders' equity adjusted for accounting changes and tax
benefits in those periods.
* Non-GAAP financial measure
6. RYDER SYSTEM, INC. AND SUBSIDIARIES
NON-GAAP FINANCIAL MEASURE RECONCILIATIONS - PRELIMINARY AND UNAUDITED
(In millions, except per share amounts)
NET EARNINGS RECONCILIATION Three Months Nine Months
2007 2006 2007 2006
Net earnings $ 65.5 65.3 $ 181.9 183.1
3Q 2007 restructuring charge 7.8 - 7.8 -
Gain on sale of Las Vegas property (6.1) - (6.1) -
2006 pension accounting charge - 3.5 - 3.5
2006 tax changes - - - (6.8)
Comparable net earnings * $ 67.2 68.8 $ 183.6 179.9
EPS RECONCILIATION Three Months Nine Months
2007 2006 2007 2006
Net earnings $ 1.11 1.06 $ 3.01 2.97
3Q 2007 restructuring charge 0.13 - 0.13 -
Gain on sale of Las Vegas property (0.10) - (0.10) -
2006 pension accounting charge - 0.06 - 0.06
2006 tax changes - - - (0.11)
Comparable net earnings * $ 1.14 1.12 $ 3.04 2.91
Consolidated
Condensed
RESTRUCTURING AND OTHER ITEMS Statements of
RECONCILIATION Earnings Three Months Nine Months
Line Item 2007 2006 2007 2006
Severance and employee-related
(costs)/recoveries Restructuring $ (11.0) - $ (11.0) 0.2
Facilities and related (costs)/recoveries Restructuring (0.9) (0.1) (1.0) (0.1)
Contract termination and transition costs Restructuring - - (0.3) -
Early retirement of debt Restructuring - - (1.3) -
Restructuring and other (charges)/recoveries, net (11.9) (0.1) (13.6) 0.1
Gain on sale of property Misc. Income 10.0 - 10.0 -
2006 pension accounting charge Salaries - (5.9) - (5.9)
Restructuring and other (charges)/recoveries, net
and other items $ (1.9) (6.0) $ (3.6) (5.8)
* Non-GAAP financial measure
Note: Amounts may not recalculate due to rounding.
Earnings per share amounts are calculated independently for each component and may not be additive due to rounding.