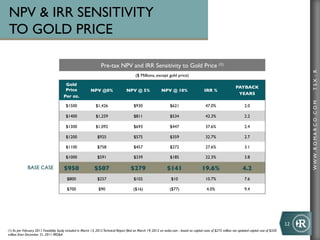
This document provides a cautionary statement for a corporate presentation by Romarco outlining forward-looking statements and estimates. It qualifies all scientific and technical information as being extracted from technical reports for the Haile Gold project from March 2012. The document cautions that actual results may differ from forward-looking statements due to risks and uncertainties. It also notes that inferred resources have uncertain existence and economic feasibility under US standards.
PDAC 2013 - Prospectors & Developers Association of Canada NOVAGOLD
NOVAGOLD had a great time exhibiting at The Prospectors and Developers Association of Canada Convention in Toronto. For more information, please visit our website www.novagold.com - thank you!
PDAC 2013 - Prospectors & Developers Association of Canada NOVAGOLD
NOVAGOLD had a great time exhibiting at The Prospectors and Developers Association of Canada Convention in Toronto. For more information, please visit our website www.novagold.com - thank you!
KI s podporou Nadácie Tatra banky a v spolupráci s ďalšími partnermi organiyoval ďalšiu - v poradí už tridsiatu - z cyklu prednášok CEQLS, ktorá sa uskutočnila dňa 11. marca 2013 v Banskej Bystrici a dňa 12. marca 2013 v Bratislave. Našim hosťom bol Richard M. Ebeling, profesor ekonómie na Northwood University (USA). Viac o pripravovanej verejnej prednáške, vrátane videozáznamu, nájdete na www.konzervativizmus.sk
2. Elemental Economics - Mineral demand.pdfNeal Brewster
After this second you should be able to: Explain the main determinants of demand for any mineral product, and their relative importance; recognise and explain how demand for any product is likely to change with economic activity; recognise and explain the roles of technology and relative prices in influencing demand; be able to explain the differences between the rates of growth of demand for different products.
Turin Startup Ecosystem 2024 - Ricerca sulle Startup e il Sistema dell'Innov...Quotidiano Piemontese
Turin Startup Ecosystem 2024
Una ricerca de il Club degli Investitori, in collaborazione con ToTeM Torino Tech Map e con il supporto della ESCP Business School e di Growth Capital
The European Unemployment Puzzle: implications from population agingGRAPE
We study the link between the evolving age structure of the working population and unemployment. We build a large new Keynesian OLG model with a realistic age structure, labor market frictions, sticky prices, and aggregate shocks. Once calibrated to the European economy, we quantify the extent to which demographic changes over the last three decades have contributed to the decline of the unemployment rate. Our findings yield important implications for the future evolution of unemployment given the anticipated further aging of the working population in Europe. We also quantify the implications for optimal monetary policy: lowering inflation volatility becomes less costly in terms of GDP and unemployment volatility, which hints that optimal monetary policy may be more hawkish in an aging society. Finally, our results also propose a partial reversal of the European-US unemployment puzzle due to the fact that the share of young workers is expected to remain robust in the US.
BYD SWOT Analysis and In-Depth Insights 2024.pptxmikemetalprod
Indepth analysis of the BYD 2024
BYD (Build Your Dreams) is a Chinese automaker and battery manufacturer that has snowballed over the past two decades to become a significant player in electric vehicles and global clean energy technology.
This SWOT analysis examines BYD's strengths, weaknesses, opportunities, and threats as it competes in the fast-changing automotive and energy storage industries.
Founded in 1995 and headquartered in Shenzhen, BYD started as a battery company before expanding into automobiles in the early 2000s.
Initially manufacturing gasoline-powered vehicles, BYD focused on plug-in hybrid and fully electric vehicles, leveraging its expertise in battery technology.
Today, BYD is the world’s largest electric vehicle manufacturer, delivering over 1.2 million electric cars globally. The company also produces electric buses, trucks, forklifts, and rail transit.
On the energy side, BYD is a major supplier of rechargeable batteries for cell phones, laptops, electric vehicles, and energy storage systems.
What website can I sell pi coins securely.DOT TECH
Currently there are no website or exchange that allow buying or selling of pi coins..
But you can still easily sell pi coins, by reselling it to exchanges/crypto whales interested in holding thousands of pi coins before the mainnet launch.
Who is a pi merchant?
A pi merchant is someone who buys pi coins from miners and resell to these crypto whales and holders of pi..
This is because pi network is not doing any pre-sale. The only way exchanges can get pi is by buying from miners and pi merchants stands in between the miners and the exchanges.
How can I sell my pi coins?
Selling pi coins is really easy, but first you need to migrate to mainnet wallet before you can do that. I will leave the telegram contact of my personal pi merchant to trade with.
Tele-gram.
@Pi_vendor_247
where can I find a legit pi merchant onlineDOT TECH
Yes. This is very easy what you need is a recommendation from someone who has successfully traded pi coins before with a merchant.
Who is a pi merchant?
A pi merchant is someone who buys pi network coins and resell them to Investors looking forward to hold thousands of pi coins before the open mainnet.
I will leave the telegram contact of my personal pi merchant to trade with
@Pi_vendor_247
Financial Assets: Debit vs Equity Securities.pptxWrito-Finance
financial assets represent claim for future benefit or cash. Financial assets are formed by establishing contracts between participants. These financial assets are used for collection of huge amounts of money for business purposes.
Two major Types: Debt Securities and Equity Securities.
Debt Securities are Also known as fixed-income securities or instruments. The type of assets is formed by establishing contracts between investor and issuer of the asset.
• The first type of Debit securities is BONDS. Bonds are issued by corporations and government (both local and national government).
• The second important type of Debit security is NOTES. Apart from similarities associated with notes and bonds, notes have shorter term maturity.
• The 3rd important type of Debit security is TRESURY BILLS. These securities have short-term ranging from three months, six months, and one year. Issuer of such securities are governments.
• Above discussed debit securities are mostly issued by governments and corporations. CERTIFICATE OF DEPOSITS CDs are issued by Banks and Financial Institutions. Risk factor associated with CDs gets reduced when issued by reputable institutions or Banks.
Following are the risk attached with debt securities: Credit risk, interest rate risk and currency risk
There are no fixed maturity dates in such securities, and asset’s value is determined by company’s performance. There are two major types of equity securities: common stock and preferred stock.
Common Stock: These are simple equity securities and bear no complexities which the preferred stock bears. Holders of such securities or instrument have the voting rights when it comes to select the company’s board of director or the business decisions to be made.
Preferred Stock: Preferred stocks are sometime referred to as hybrid securities, because it contains elements of both debit security and equity security. Preferred stock confers ownership rights to security holder that is why it is equity instrument
<a href="https://www.writofinance.com/equity-securities-features-types-risk/" >Equity securities </a> as a whole is used for capital funding for companies. Companies have multiple expenses to cover. Potential growth of company is required in competitive market. So, these securities are used for capital generation, and then uses it for company’s growth.
Concluding remarks
Both are employed in business. Businesses are often established through debit securities, then what is the need for equity securities. Companies have to cover multiple expenses and expansion of business. They can also use equity instruments for repayment of debits. So, there are multiple uses for securities. As an investor, you need tools for analysis. Investment decisions are made by carefully analyzing the market. For better analysis of the stock market, investors often employ financial analysis of companies.
how to sell pi coins in South Korea profitably.DOT TECH
Yes. You can sell your pi network coins in South Korea or any other country, by finding a verified pi merchant
What is a verified pi merchant?
Since pi network is not launched yet on any exchange, the only way you can sell pi coins is by selling to a verified pi merchant, and this is because pi network is not launched yet on any exchange and no pre-sale or ico offerings Is done on pi.
Since there is no pre-sale, the only way exchanges can get pi is by buying from miners. So a pi merchant facilitates these transactions by acting as a bridge for both transactions.
How can i find a pi vendor/merchant?
Well for those who haven't traded with a pi merchant or who don't already have one. I will leave the telegram id of my personal pi merchant who i trade pi with.
Tele gram: @Pi_vendor_247
#pi #sell #nigeria #pinetwork #picoins #sellpi #Nigerian #tradepi #pinetworkcoins #sellmypi
Abhay Bhutada Leads Poonawalla Fincorp To Record Low NPA And Unprecedented Gr...Vighnesh Shashtri
Under the leadership of Abhay Bhutada, Poonawalla Fincorp has achieved record-low Non-Performing Assets (NPA) and witnessed unprecedented growth. Bhutada's strategic vision and effective management have significantly enhanced the company's financial health, showcasing a robust performance in the financial sector. This achievement underscores the company's resilience and ability to thrive in a competitive market, setting a new benchmark for operational excellence in the industry.
5 Tips for Creating Standard Financial ReportsEasyReports
Well-crafted financial reports serve as vital tools for decision-making and transparency within an organization. By following the undermentioned tips, you can create standardized financial reports that effectively communicate your company's financial health and performance to stakeholders.
This presentation poster infographic delves into the multifaceted impacts of globalization through the lens of Nike, a prominent global brand. It explores how globalization has reshaped Nike's supply chain, marketing strategies, and cultural influence worldwide, examining both the benefits and challenges associated with its global expansion.
PPrreesseenntteedd bbyy:: GGrroouupp 66
GGlloobbaalliizzaattiioonn
o f
PP
oo
ll
yy
ee
ss
tt
ee
rr
RR
uu
bb
bb
ee
rr
EE
tt
hh
yy
ll
ee
nn
ee
VV
ii
nn
yy
ll
AA
cc
ee
tt
aa
tt
ee
GG
ee
nn
uu
ii
nn
ee
LL
ee
aa
tt
hh
ee
rr
SS
yy
nn
tt
hh
ee
tt
ii
cc
LL
ee
aa
tt
hh
ee
rr
CC
oo
tt
tt
oo
nn
C
o
u
n
t
r
i
e
s
I
n
v
o
l
v
e
d
Ni
k
e
h
a
s
m
o
r
e
t
h
a
n
7
0
0
s
h
o
p
s
i
n
c
o
n
t
r
a
c
t
w
i
t
h
w
o
r
l
d
w
i
d
e,
w
h
e
r
e
i
n
t
h
e
i
r
offi
c
e
s
a
n
d
i
n
d
e
p
e
n
d
e
n
t
fa
c
t
o
r
y
o
u
t
l
e
t
s
a
r
e
fo
u
n
d
w
i
t
h
i
n
t
h
e
p
r
e
m
i
s
e
s
of
ap
p
r
o
x
i
m
a
t
e
l
y
4
5
c
o
u
n
t
r
i
e
s.
AAuussttrraalliiaa
China
India
IInnddoonneessiiaa
TThhaaiillaanndd
TTuurrkkeeyy
USA
VViieettnnaamm
NNiikkee SSuuppppllyy CChhaaiinn
RRuubbbbeerr,, FFaabbrriicc
aanndd ootthheerr rraaww
mmaatteerriiaallss
Shoe
MMaannuuffaaccttuurriinngg
aanndd AAsssseemmbbllyy
MMaarrkkeettiinngg
SSppoorrttiinngg ggooooddss,,
ddeevveellooppmmeenntt
aanndd SShhooee ssttoorreess
OOnnlliinnee,, CCaattaalloogg
aanndd ootthheerr rreettaaiill
NNiikkee bbrraannddeedd
shoes
PPrroodduucctt
ddeevveellooppmmeenntt
CCuussttoommeerr nneeeeddss//wwaannttss ffeeeeddbbaacckk
NNiikk
Nike Supply Chain
Globalization of Nike
Nike Manufacturing Process
Rubber Materials Nike
Ethylene Vinyl Acetate Nike
Genuine Leather Nike
Synthetic Leather Nike
Cotton in Nike Apparel
Nike Shops Worldwide
Nike Manufacturing Countries
Cold Cement Assembly Nike
3D Printing Nike Shoes
Nike Product Development
Nike Marketing Strategies
Nike Customer Feedback
Nike Distribution Centers
Automation in Nike Manufacturing
Nike Consumer Direct Acceleration
Nike Logistics and Transport
2. Cautionary Statement
The
informa-on
in
this
document
has
been
prepared
as
of
March
13,
2012.
Certain
statements
contained
in
this
document
cons-tute
“forward-‐looking
statements”
within
the
meaning
of
the
United
States
Private
Securi-es
Li-ga-on
Reform
Act
of
1995
and
forward
looking
informa-on
under
the
provisions
of
Canadian
provincial
securi-es
laws.
When
used
in
this
document,
the
words
“an-cipate”,
“expect”,
“es-mate”,
“forecast”,
“will”,
“planned”,
and
similar
expressions
are
intended
to
iden-fy
forward-‐looking
statements
or
informa-on.
Specifically,
this
presenta-on
contains
forward
looking
statements
regarding
the
results
and
projec-ons
contained
in
the
March
13,
2012
technical
report
of
the
TSX : R
Haile
Gold
project,
including
the
expected
mine
life,
recovery,
capital
costs,
cash
opera-ng
costs
and
other
costs
and
an-cipated
produc-on
of
the
described
open
pit
mine,
the
projected
internal
rate
of
return,
the
projected
payback
period,
the
availability
of
capital
for
development,
sensi-vity
to
metal
prices,
ore
grade,
the
reserve
and
resource
es-mates
on
the
project,
the
financial
analysis,
the
-ming
for
comple-on
of
the
revised
feasibility
study
on
the
Haile
Gold
project,
the
-ming
and
amount
of
future
produc-on,
the
-ming
of
construc-on
of
the
proposed
mine
and
process
facili-es,
capital
and
opera-ng
expenditures,
the
-ming
of
the
receipt
of
permits,
rights
and
authoriza-ons,
communica-ons
with
local
stakeholders
and
community
rela-ons,
availability
of
financing
and
any
and
all
other
-ming,
development,
opera-onal,
financial,
economic,
legal,
regulatory
and
poli-cal
factors
that
may
influence
future
events
or
condi-ons
and
expected
drilling
ac-vi-es.
WWW .R O MA R C O .C O M
In
addi-on,
this
presenta-on
also
contains
updated
resource
es-mates
contained
in
the
March
13,
2012
technical
reports.
Scien-fic
and
technical
informa-on
referred
herein
has
been
extracted
from
and
are
hereby
qualified
in
their
en-rety
by
reference
to
the
aforemen-oned
technical
reports
(“Technical
Reports”).
Joshua
Snider,
P.E.,
Thomas
L.
Drielick,
P.E.,
Lee
“Pat”
Gochnour,
M.M.S.A.,
John
Marek,
P.E.
and
Derek
Wiwer,
P.E.
are
responsible
for
preparing
the
Technical
Reports.
Each
of
the
above
referenced
persons
is
a
“qualified
person”
as
defined
in
Na-onal
Instrument
43-‐101
—
Standards
of
Disclosure
for
Mineral
Projects.
Such
forward-‐looking
statements
are
based
on
a
number
of
material
factors
and
assump-ons,
including,
but
not
limited
in
any
manner,
those
disclosed
in
any
another
of
Romarco’s
public
filings,
and
include
the
ul-mate
determina-on
of
mineral
reserves
and
resources,
availability
and
final
receipt
of
required
approvals,
licenses
and
permits,
sufficient
working
capital
to
develop
and
operate
the
proposed
mine,
access
to
adequate
services
and
supplies,
economic
condi-ons,
commodity
prices,
foreign
currency
exchange
rates,
interest
rates,
access
to
capital
and
debt
markets
and
associated
cost
of
funds,
availability
of
a
qualified
work
force,
lack
of
social
opposi-on
and
legal
challenges,
and
the
ul-mate
ability
to
mine,
process
and
sell
mineral
products
on
economically
favorable
terms.
While
Romarco
considers
these
assump-ons
to
be
reasonable
based
on
informa-on
currently
available
to
it,
they
may
prove
to
be
incorrect.
Actual
results
may
vary
from
such
forward-‐looking
informa-on
for
a
variety
of
reasons,
including
but
not
limited
to
risks
and
uncertain-es
disclosed
in
other
Romarco
filings
at
www.sedar.com.
Forward-‐looking
statements
are
based
upon
management’s
beliefs,
es-mate
and
opinions
on
the
date
the
statements
are
made
and,
other
than
as
required
by
law,
Romarco
does
not
intend,
and
undertakes
no
obliga-on
to
update
any
forward-‐looking
informa-on
to
reflect,
among
other
things,
new
informa-on
or
future
events
Cau-onary
Note
to
United
States
Investors
Concerning
Es-mates
of
Measured,
Indicated
and
Inferred
Resources:
Certain
tables
may
use
the
terms
“Measured”,
“Indicated”
and
“Inferred”
Resources.
United
States
investors
are
advised
that
while
such
terms
are
recognized
and
required
by
Canadian
regula-ons,
however,
the
United
States
Securi-es
and
Exchange
Commission
does
not
recognize
them.
“Inferred
Mineral
Resources”
have
a
great
amount
of
uncertainty
as
to
their
existence,
and
as
to
their
economic
and
legal
feasibility.
It
cannot
be
assumed
that
all
or
any
part
of
an
Inferred
Mineral
Resource
will
ever
be
upgraded
to
a
higher
category.
Under
Canadian
rules,
es-mates
of
Inferred
Mineral
Resources
may
not
form
the
basis
of
feasibility
or
other
economic
studies.
United
States
investors
are
cau-oned
not
to
assume
that
all
or
any
part
of
Measured
or
Indicated
Mineral
Resources
will
ever
be
converted
into
Mineral
Reserves.
United
States
investors
are
also
cau-oned
not
to
assume
that
all
or
any
part
of
a
Mineral
Resource
is
economically
or
legally
mineable.
All
figures
are
US$
unless
otherwise
indicated
2
3. Introduction Haile Gold Mine
u Currently in EIS Permitting process
TSX : R
u Detailed engineering work on-going
• Target 75% completion by year end
WWW .R O MA R C O .C O M
u Continuous review of mine plan, alternatives, expansion studies,
underground review
u Exploration reduced in current economic environment
• 3 rigs operating at Haile and regional targets
u $80M in cash (at July 31, 2012)
u Strong institutional support
3
4. What makes Haile a unique asset?
u Location – Location – Location
u Low capex ($320mm)
TSX : R
u Low operating costs ($379 / oz LOM)
Project
Loca+on
u High grade (2.06 g/t)
NORTH
Charlotte
u District potential CAROLINA
WWW .R O MA R C O .C O M
Haile Mine
u Experienced development team in Myrtle
Beach
SOUTH Columbia
place CAROLINA
u Key long-lead equipment ordered
and secured
Atlantic Ocean
• Mobile mine fleet GEORGIA
• SAG / Ball mills
u Rated #6 out of 76 new mines
starting in 2012 to 2020 by BMO
(May 7, 2012)
4
5. LOW CAPITAL COST ($320M)
Development Capex per ounce of Measured & Indicated Resources (inclusive) (US$/oz Au Eq.)(1)
TSX : R
$107
WWW .R O MA R C O .C O M
$83
$78
Average: $76
$66
$63
$59
Torex Rainy River International Tower Romarco
ROMARCO Victoria Gold Guyana Goldfields
Hill
5
Source: Data provided by BMO Capital Markets, as at August 17, 2012
(1) Includes precious metals only calculated at long term consensus prices of Au US$1,250/oz and Ag of US$21.82/oz
6. HIGH GRADE FOR OPEN PIT
TSX : R
3.50! 3.17!
3.00!
2.50!
2.09! 2.06!
WWW .R O MA R C O .C O M
2.00!
1.46!
1.50!
1.03!
1.00! 0.78! 0.73!
0.50!
0.00!
Guyana Goldfields! NovaGold! ROMARCO! Gabriel Resources! Detour Gold! Victoria Gold! Andina!
Reserve Grade for Primary Open Pit Asset (g/t Au) (1)
6
(1) Source: Company Disclosure at March 31, 2012
7. LOW CASH COST
TSX : R
$700!
$617! LOWEST QUARTILE AVERAGE CASH
$600! COST IN Q4 2011 (1)
WWW .R O MA R C O .C O M
$500!
$379! $428!
$400!
$300!
$200!
$100!
$0!
Industry Average (1) ROMARCO Lowest Quartile (1)
LOM Average (2)
7
(1) Source: Brook Hunt estimates
(2) As per February 2011 Feasibility Study results included in March 13, 2012 Technical Report filed on March 19, 2012 on sedar.com
8. ENVIRONMENTAL IMPACT
STATEMENT PROCESS
þ Contractor
(3rd
Party)
Selec+on
–
Sept.
2,
2011
(announced
Sept.
26,
2011)
þ No+ce
of
Intent
Federal
Register
–
Sept.
23,
2011
TSX : R
þ 30
day
no+ce
period
þ Public
Scoping
Mee+ng
–
Oct.
27,
2011
WWW .R O MA R C O .C O M
þ Scoping
Comment
Period
Closed
–
Nov.
28,
2011
CURRENT
STAGE Prepara+on
of
DraN
EIS
DraN
EIS
filed
and
comment
period
opens
–
Dec.
14,
2012
DraN
EIS
Public
Hearing
–
Jan.
29,
2013
DraN
EIS
comment
period
closes
–
Feb.
28,
2013
Final
EIS
filed
–
July
19,
2013
Record
of
Decision
(ROD)
on
404
Wetlands
permit
–
Aug.
16,
2013
8
9. HGM PERMITTING
TSX : R
Federal – USACE* State – DHEC**
• 404 Wetlands Permit only • 401 Water Quality Certification
USACE is sole deciding • Mine Operating Permit
WWW .R O MA R C O .C O M
•
regulatory body • Air Quality Permit
• All other agencies are
• NPDES Permit
cooperating or commenting
agencies only – EPA, US Fish • Others
and Wildlife, Catawba Nation,
DHEC, SCDNR etc.
* US Army Corps of Engineers
** South Carolina Department of Health and Environmental Control
9
10. CLEAR PLAN TO BRING
HAILE INTO PRODUCTION
• Strong balance sheet with approximately $80M in cash and no debt(1)
• Well defined project schedules and clear development milestones
TSX : R
Project Schedule for EIS Haile Milestones and Status Report
2011 2012 2013 2014 2015 Milestone / Activity Status
WWW .R O MA R C O .C O M
Q1 Q2 Q3 Q4 Q1 Q2 Q3 Q4 Q1 Q2 Q3 Q4 Q1 Q2 Q3 Q4 H1 H2
Complete feasibility study P
State mine operating permit
submitted P
Feasibility Study
401/404 permit submitted P
Optimization Resource / reserve report P
Permitting Expand Haile Horseshoe P
Identify new targets P
Construction
Acquire other properties P
Production Explore regional targets P
Update Resource P
Exploration
Draft EIS 2012
10
(1) As disclosed in Q2 MDA June 30, 2012
11. RESOURCES RESERVES
OPEN PIT UNDERGROUND
2011 MEASURED + INDICATED RESOURCES AT US$1,200 GOLD (1)
METRIC TONNES g/t CONTAINED oz
TSX : R
(000s) Au (000s)
MEASURED 36,894 1.79 2,125
INDICATED 34,277 1.74 1,914
WWW .R O MA R C O .C O M
MEASURED + INDICATED 71,171 1.77 4,039
INFERRED 20,125 1.24 801
2010 RESERVES AT US$950 GOLD (1)
METRIC TONNES g/t CONTAINED oz
(000s) Au (000s)
PROVEN RESERVE 19,592 2.19 1,382
PROBABLE RESERVE 10,917 1.82 636
PROVEN PROBABLE 30,509 2.06 2,018
RESERVE
(1) From March 13, 2012 Technical Report filed on www.sedar.com on March 19, 2012
11
12. NPV IRR SENSITIVITY
TO GOLD PRICE
Pre-tax NPV and IRR Sensitivity to Gold Price (1)
TSX : R
($ Millions, except gold price)
Gold
PAYBACK
Price
NPV @0%
NPV @ 5%
NPV @ 10%
IRR %
YEARS
Per oz.
WWW .R O MA R C O .C O M
$1500
$1,426
$930
$621
47.0%
2.0
$1400
$1,259
$811
$534
42.3%
2.2
$1300
$1,092
$693
$447
37.6%
2.4
$1200
$925
$575
$359
32.7%
2.7
$1100
$758
$457
$272
27.6%
3.1
$1000
$591
$339
$185
22.3%
3.8
BASE CASE $950
$507
$279
$141
19.6%
4.2
$800
$257
$102
$10
10.7%
7.6
$700
$90
($16)
($77)
4.0%
9.4
12
(1) As per February 2011 Feasibility Study included in March 13, 2012 Technical Report filed on March 19, 2012 on sedar.com - based on capital costs of $275 million not updated capital cost of $320
million from December 31, 2011 MDA
13. HAILE GOLD MINE
FEASIBILITY STUDY HIGHLIGHTS
u Feasibility Study does not include deep mineralization:
Ø Horseshoe, Mustang, Palomino and Snake Deep deposits
TSX : R
3.5 km
WWW .R O MA R C O .C O M
274 m
DEPTH (m)
610 m
13
14. PLANT SITE –
HAILE GOLD MINE
TSX : R
MINE SHOP
CRUSHER
MILL SHOP
WWW .R O MA R C O .C O M
ADMIN
SAG BALL REAGENT
MILL
FLOT
FINE GRIND
WATER
CARBON TREATMENT
STRIP CIL
REFINERY
CN
DESTRUCT
14
15. PLANT SITE –
HAILE GOLD MINE
CRUSHER
TSX : R
REAGENT
FLOT
WWW .R O MA R C O .C O M
FINE
GRIND
CIL
WATER
TREATMENT
CN DESTRUCT
15
16. ENGINEERING PROCUREMENT
PROGRESS
PROCUREMENT
TSX : R
• $51.8M in signed Purchase Orders
• ~$12.0M ready to sign
WWW .R O MA R C O .C O M
• +75% equipment costs are known
• SAG and Ball Mill will arrive 1Q13
• CAT mobile fleet in South Carolina at dealer’s warehouse
• Hitachi Shovel will arrive 4Q12
16
17. CAPITAL COSTS BREAKDOWN
TSX : R
Component of CAPEX Feasibility $275M vs March 2012 $320M
EQUIPMENT ~ 1/3 • Scope changes to water
treatment plant
WWW .R O MA R C O .C O M
CONSTRUCTION ~ 1/3
• Additional liners
OTHER ~ 1/3 • Updated commodity pricing
TOTAL PROJECT $320M • Design enhancements for tailings
and overburden storage areas
• Improved silver recovery circuit
• Added $17M to cover
potential inflation
17
18. CAPITAL COSTS BREAKDOWN -
EQUIPMENT
(in millions of USD)
EQUIPMENT TOTAL ~ 1/3 of CAPEX
TSX : R
Ordered and locked in ~$52
• CAT, Hitachi Shovel, SAG/Ball mill, Other
WWW .R O MA R C O .C O M
processing equipment
• CAT equipment currently in South Carolina
• ~$0.2 in monthly progress/holding payments
Orders negotiated / prices set ~$23
(pending release for manufacture – indexed to commodities)
• Fine grinding mills, Water Treatment plant, etc.
Not yet ordered, not long-lead time ~$25
18
19. CAPITAL COSTS BREAKDOWN -
CONSTRUCTION
(in millions of USD)
CONSTRUCTION TOTAL ~ 1/3 of CAPEX
TSX : R
Exposure to inflation
• Oil / diesel, concrete, steel etc.
WWW .R O MA R C O .C O M
• Recently priced
• Supply and demand
• Currently local area has many
contractors and high unemployment
19
20. CAPITAL COSTS BREAKDOWN -
OTHER
(in millions of USD)
OTHER TOTAL ~ 1/3 of CAPEX
TSX : R
• Contingency $30
• Inflation $17
WWW .R O MA R C O .C O M
• Owner’s Cost ~$17
• EPCM ~$24
• Pre-stripping ~$20
• Little risk of inflation
• $47M combined in contingency ($30M) and
inflation ($17M)
20
21. LOW CAPITAL COSTS
u Excellent existing infrastructure at Haile
u Not building local/regional
TSX : R
Ø Power plant
Ø Dams for water supplies
WWW .R O MA R C O .C O M
Ø Many kilometers of roads
Ø Employee camp
u Constructing plant, buildings, tailings dam
21
22. FINANCING ALTERNATIVES
u Funding sources u Engagement with Barclays
u Debt – targeting ~40-60% Bank PLC
TSX : R
Ø Project Financing u Barclays engaged as
Ø Leasing financial advisor for
Ø Convertible potential debt financing
WWW .R O MA R C O .C O M
Ø High yield u Independent review
u Equipment lease complete (Pincock, Allen
u Other : Holt)
Ø Equity
Ø Royalty stream
Ø Forward sale
Ø Strategic Investor
22
23. 70% Institutional Ownership
BlackRock
Sun Valley Gold
TSX : R
Franklin Templeton Investments
TOP 15 SHAREHOLDERS
Van Eck
Oppenheimer Funds
WWW .R O MA R C O .C O M
Norges Bank
Colonial First State
Tocqueville
Fidelity Investments
J.P. Morgan
OF OUR SHARES ARE
TD INSTITUTIONALLY
Baker Steel Capital Managers / Ruffer OWNED
URAM
CPP Investment Board
Bank DeGroof 23
24. ANALYST COVERAGE
TSX : R
TARGET PRICE
NBF $2.05
WWW .R O MA R C O .C O M
Paradigm $2.00
RBC $1.25
GMP $1.00
BMO $0.75
24
25. CAPITAL STRUCTURE
Capitalization Summary
TSX : R
Exchange/ Symbol TSX:R
Share Price(1) C$0.88
WWW .R O MA R C O .C O M
Shares Outstanding (Basic) 584.3M
FD Shares Outstanding (TSM)(2) 586.4M
Market Capitalization(1) C$514M
52 Week High / Low(1) C$1.78 / C$0.49
Cash Balance (July 31, 2012) US$80M
(1) As at close on August 24, 2012 25
(2) Includes 2.1M “in-the-money” options at an average strike price of C$0.30 as of July 31, 2012
26. STRONG BOARD, MANAGEMENT
TECHNICAL TEAM
Proven gold mine development, finance, permitting and operations experience
Romarco has the team in place to bring Haile into production
TSX : R
Experienced Board of Directors Strong Management Technical Team
Leendert Krol, Chairman Diane R. Garrett, Ph.D., President CEO
§ Former Newmont § Former Dayton Mining, US Global Investors
James R. Arnold, Sr. VP, COO
Diane R. Garrett § Former Freeport, Gold Fields – Richards Award Winner
WWW .R O MA R C O .C O M
§ Former Dayton Mining, US Global Investors
Stan Rideout, Sr. VP, CFO
James R. Arnold § Former Phelps Dodge
§ Former Freeport, Gold Fields – Richards Award Winner
David Thomas, VP, General Manager
Don MacDonald James Berry, Chief Geologist Regional Exploration Manager
§ CFO KGHM International (formerly QuadraFNX), former § Former Barrick
NovaGold, DeBeers, Dayton Mining
Brent Anderson, Mine Manager
John Marsden § Former Quadra, Freeport
§ Consultant, former Freeport – Richards Award Winner
Mike Gleason, Construction Manager
Patrick Michaels § Former Freeport
§ Portfolio Manager – Zuri-invest, Switzerland Jim Wickens, Process Manager
§ Former Barrick
Gary A. Sugar
§ Former RBC Capital Markets Johnny Pappas, Director of Environmental Affairs
§ Former Freeport
Robert van Doorn
§ Former Mundoro, Rio Narcea, Morgan Stanley Ramona Schneider, Environmental Manager
§ Former Kinross
Dan Symons, Vice President, Investor Relations
§ Former Renmark Financial 26
27. CONTACT INFORMATION
Dan Symons
Vice President, Investor Relations
dsymons@romarco.com
Brookfield Place
161 Bay Street, 27th Floor
Toronto, Ontario M5J 2S1
Tel: 416.367.5500
Fax: 416.367.5505
Email: info@romarco.com
WWW .R O MA R C O .C O M