Download to read offline

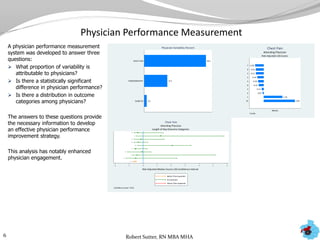
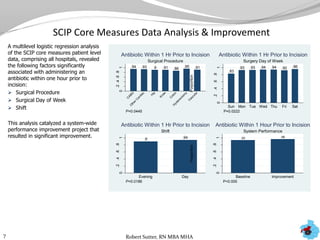
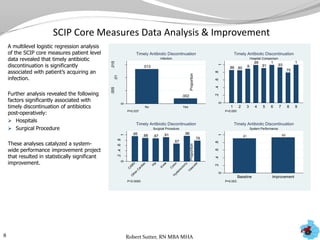
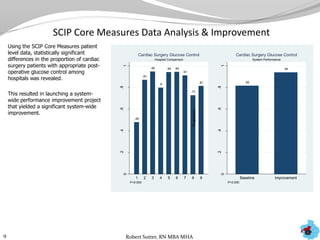

The document outlines statistical analyses and performance dashboards developed by Robert Sutter using patient data to identify opportunities for performance improvement. Key points include: - Dashboards were created to monitor quality performance metrics and catalyze annual improvement planning across multiple health systems. - Additional analyses of SCIP, STS, and ACC data revealed factors associated with outcomes and complications. This stimulated numerous system-wide performance projects. - Physician and hospital comparisons using the data identified best practices and areas for benchmarking, focusing improvement efforts.


