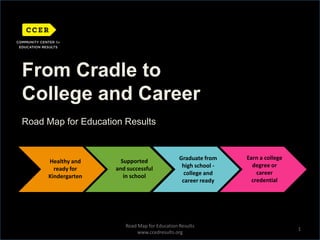
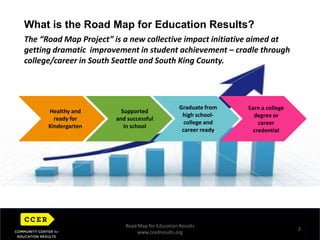
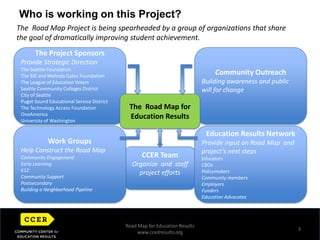
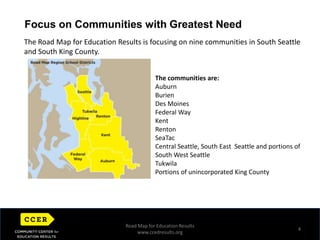
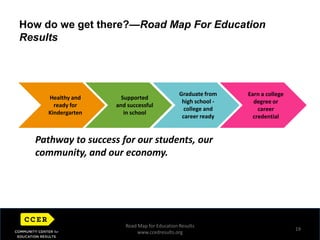
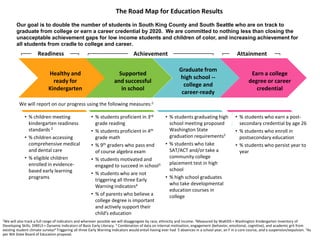
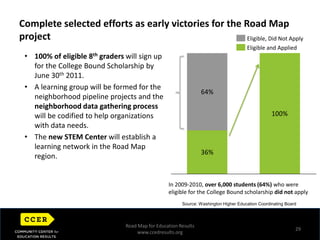
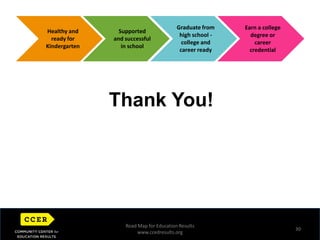
From Cradle to College and Career Road Map for Education Results1Earn a college degree or  career credentialGraduate from high school - college and career readySupported  and successful in schoolHealthy and ready for KindergartenRoad Map for Education Resultswww.ccedresults.org
2What is the Road Map for Education Results?The “Road Map Project” is a new collective impact initiative aimed at getting dramatic  improvement in student achievement – cradle through college/career in South Seattle and South King County. Horizontal Image AreaGraduate from high school- college and career readyEarn a college degree or  career credentialHealthy and ready for KindergartenSupported  and successful in schoolRoad Map for Education Resultswww.ccedresults.org
Who is working on this Project? 3The  Road Map Project is being spearheaded by a group of organizations that share the goal of dramatically improving student achievement.The Project SponsorsProvide Strategic Direction The Seattle FoundationThe Bill and Melinda Gates FoundationThe League of Education VotersSeattle Community Colleges DistrictCity of SeattlePuget Sound Educational Service DistrictThe Technology Access FoundationOneAmericaUniversity of WashingtonCommunity OutreachBuilding awareness and public will for changeThe  Road Map for Education Results Work Groups   Help Construct the Road Map Community Engagement Early Learning K12Community SupportPostsecondaryBuilding a Neighborhood Pipeline Education Results Network Provide input on Road Map  and project’s next steps EducatorsCBOs PolicymakersCommunity membersEmployersFundersEducation AdvocatesCCER TeamOrganize  and  staff project effortsRoad Map for Education Resultswww.ccedresults.org
4Focus on Communities with Greatest NeedThe Road Map for Education Results is focusing on nine communities in South Seattle and South King County. The communities are:AuburnBurienDes MoinesFederal WayKentRentonSeaTacCentral Seattle, South East  Seattle and portions of South West SeattleTukwilaPortions of unincorporated King CountyHorizontal Image AreaRoad Map for Education Resultswww.ccedresults.org
The Focus Region Represents a Sizeable Population and the Majority of King County’s Low Income, Minority, and English Language Learner studentsHorizontal Image Area5K-12 Public School Population in King County271,26842% of public K-12 students in King County live in the Road Map’s target region
King County’s disadvantaged populations are concentrated in the target region
70% of the county’s low-Income students live there
58% of students of color live there
69% of English Language Learner (ELL) students live thereRest of King County156,240114,76678,18248,31423,73625,06966,452Target Region115,02854,445Low-Income StudentsELL StudentsTotal StudentsStudents of ColorLow-Income StudentsELL StudentsTotal StudentsStudents of ColorRoad Map for Education Resultswww.ccedresults.org
Post Secondary attainment is increasingly important in today’s job market –especially in King CountyHorizontal Image AreaBy 2018, 67% of jobs in Washington will require postsecondary education.This is 4 percentage points above the national average of 63%.Washington ranks 6th in postsecondary education intensity for 2018.Source: The Georgetown University Center on Education and the Workforce Road Map for Education Resultswww.ccedresults.org6
Region’s High Educational LevelsHorizontal Image Area Source:  2008 American Community Survey, U.S. Census BureauRoad Map for Education Resultswww.ccedresults.org7
8Only 1 Out of Every 4 King County Residents Who Have a Bachelor’s Degree or Higher Were Born HerePopulation 25 Years and Over with Bachelor’s, Graduate or Professional Degree, by Place of BirthPercent of Degree Holders Born In State of ResidencePercent of Degree Holders Born in Other State/Country74%71%74%74%58%51%47%71%58%U.S.King CountyMassachusettsMinnesotaRoad Map for Education Resultswww.ccedresults.org
n9The Majority of Children in the Road Map Region are Not Ready for School When They Begin KindergartenPercent of Kindergarten Students Meeting DIBELS Standard, by District (2009)Percent of Auburn Students Meeting DIBELS Standard, by Sub-Group (2009)73%61%59%42%50%41%33%Auburn DIBELS perfor-mance, by sub-group29%28%30%26%AuburnTukwilaHighlineLake Washington (Benchmark)RentonHispanicAsianPacific IslanderWhiteNative Am.BlackSource: 2009 DIBELS data from PSESDRoad Map for Education Resultswww.ccedresults.org
10Within Our Region, Large Achievement Gaps Between Low-Income and Non-Low-Income Students Exist from an Early AgeSupported and Successful in SchoolPercent Proficient on 3rd Grade Reading (2010)Percent Proficient on 3rd Grade Reading (2010)Road Map for Education Resultswww.ccedresults.org
11And Those Disparities Between Low-Income and Non-Low-Income Students Persist into Middle School.Supported and Successful in SchoolPercent Proficient on 7th Grade Math (2010)Percent Proficient on 7th  Grade Math (2010)Road Map for Education Resultswww.ccedresults.org
Seattle School Report Cards12Schools were ranked on a scale of 1 to 5, based largely on test scores — not just the percentage of students passing tests but the percentage making gains. But not a single in South Seattle elementary, middle or high school received better than a 3.LEGEND:Red = Level 1Low Overall Absolute Performance and Low-to-Medium Overall Growth PerformanceOrange = Level 2Medium-Low Overall Absolute Performance and Low-to-Medium Overall Growth PerformanceYellow = Level 3Low or Medium-Low Overall Absolute Performance and High Overall Growth Performance or Medium-High Overall Absolute PerformanceGreen = Level 4High Overall Absolute Performance (w/ Free and Reduced Price Lunch Achievement Gap)Blue = Level 5High Overall Absolute Performance (w/ no Free and Reduced Price Lunch Achievement Gap)Source: http://www.seattleschools.org/area/strategicplan/segmentation.pdfRoad Map for Education Resultswww.ccedresults.org
Tale of Two Pipelines: Cleveland HS vs. Bellevue HS13Source: Graduation data from OSPI for Class of 2008, college data from College Tracking Data Services (BERC Group) for Class of 2008Road Map for Education Resultswww.ccedresults.org
Tale of Two Pipelines : Chief Sealth HS Vs Roosevelt HS Source: Graduation data from OSPI for Class of 2008, college data from College Tracking Data Services (BERC Group) for Class of 2008Road Map for Education Resultswww.ccedresults.org14
215Postsecondary Attainment – Particularly Among Students of Color – is Shockingly LowStudent Progression, 9th Grade to College/Credential Completion100%Asian100%White83%81%Black80%68%66%66%Hispanic61%58%60%Native American45%44%41%38%40%34%31%31%25%21%20%20%12%11%10%0%Graduate HSEnroll in PSAttain CredentialReturn for 2nd Year of PSEnrolled in 9th GradeNote: Data is for high school graduating class of 2004 in the Road Map region, including Auburn, Federal Way, Highline, Kent, Renton, Tukwila and South Seattle public schools.  Seattle high schools include Cleveland, Franklin, Garfield, Rainier Beach, Sealth, and South Lake. Source: OSPI The BERC Group, College Tracking Data ServicesRoad Map for Education Resultswww.ccedresults.org
1689% of parents in our target region feel that it is “very important” for their children to go to college or a trade or technical schoolHow important is it to you that your children go to college or a trade or technical school after high school?Road Map for Education Resultswww.ccedresults.org
Great Progress is Possible17Parent Child Home Program IBEST – Integrated Basic Education and Skills TrainingMartin Sortun Elementary Urban League Scholars“Be the Change”Road Map for Education Resultswww.ccedresults.org
STRIVE – Cincinnati E3 Alliance – Austin Promise Neighborhood  Harlem/National ReplicationReady by 21City of Seattle – Youth and Families Initiative18Other communities are organizing for action tooRoad Map for Education Resultswww.ccedresults.org
How do we get there?—Road Map For Education Results19Graduate from high school - college and career readyEarn a college degree or  career credentialHealthy and ready for KindergartenSupported  and successful in schoolPathway to success for our students, our community, and our economy. Road Map for Education Resultswww.ccedresults.org
The Road Map for Education ResultsOur goal is to double the number of students in South King County and South Seattle who are on track to graduate from college or earn a career credential by 2020.  We are committed to nothing less than closing the unacceptable achievement gaps for low income students and children of color, and increasing achievement for all students from cradle to college and career.  ReadinessAttainmentAchievementGraduate from high school --college and career-readyHealthy and ready for KindergartenSupported  and successful in schoolEarn a college degree or career credentialWe will report on our progress using the following measures:1% students proficient in 3rdgrade reading
% students proficient in 4thgrade math
% 9th graders who pass end    of course algebra exam
% students motivated and engaged to succeed in school3
% students who are not triggering all three Early Warning indicators4
% of parents who believe a college degree is important and actively support their child’s education
% students graduating high school meeting proposed Washington State graduation requirements5

Road Map for Education Results

  • 1.
    From Cradle toCollege and Career Road Map for Education Results1Earn a college degree or career credentialGraduate from high school - college and career readySupported and successful in schoolHealthy and ready for KindergartenRoad Map for Education Resultswww.ccedresults.org
  • 2.
    2What is theRoad Map for Education Results?The “Road Map Project” is a new collective impact initiative aimed at getting dramatic improvement in student achievement – cradle through college/career in South Seattle and South King County. Horizontal Image AreaGraduate from high school- college and career readyEarn a college degree or career credentialHealthy and ready for KindergartenSupported and successful in schoolRoad Map for Education Resultswww.ccedresults.org
  • 3.
    Who is workingon this Project? 3The Road Map Project is being spearheaded by a group of organizations that share the goal of dramatically improving student achievement.The Project SponsorsProvide Strategic Direction The Seattle FoundationThe Bill and Melinda Gates FoundationThe League of Education VotersSeattle Community Colleges DistrictCity of SeattlePuget Sound Educational Service DistrictThe Technology Access FoundationOneAmericaUniversity of WashingtonCommunity OutreachBuilding awareness and public will for changeThe Road Map for Education Results Work Groups Help Construct the Road Map Community Engagement Early Learning K12Community SupportPostsecondaryBuilding a Neighborhood Pipeline Education Results Network Provide input on Road Map and project’s next steps EducatorsCBOs PolicymakersCommunity membersEmployersFundersEducation AdvocatesCCER TeamOrganize and staff project effortsRoad Map for Education Resultswww.ccedresults.org
  • 4.
    4Focus on Communitieswith Greatest NeedThe Road Map for Education Results is focusing on nine communities in South Seattle and South King County. The communities are:AuburnBurienDes MoinesFederal WayKentRentonSeaTacCentral Seattle, South East Seattle and portions of South West SeattleTukwilaPortions of unincorporated King CountyHorizontal Image AreaRoad Map for Education Resultswww.ccedresults.org
  • 5.
    The Focus RegionRepresents a Sizeable Population and the Majority of King County’s Low Income, Minority, and English Language Learner studentsHorizontal Image Area5K-12 Public School Population in King County271,26842% of public K-12 students in King County live in the Road Map’s target region
  • 6.
    King County’s disadvantagedpopulations are concentrated in the target region
  • 7.
    70% of thecounty’s low-Income students live there
  • 8.
    58% of studentsof color live there
  • 9.
    69% of EnglishLanguage Learner (ELL) students live thereRest of King County156,240114,76678,18248,31423,73625,06966,452Target Region115,02854,445Low-Income StudentsELL StudentsTotal StudentsStudents of ColorLow-Income StudentsELL StudentsTotal StudentsStudents of ColorRoad Map for Education Resultswww.ccedresults.org
  • 10.
    Post Secondary attainmentis increasingly important in today’s job market –especially in King CountyHorizontal Image AreaBy 2018, 67% of jobs in Washington will require postsecondary education.This is 4 percentage points above the national average of 63%.Washington ranks 6th in postsecondary education intensity for 2018.Source: The Georgetown University Center on Education and the Workforce Road Map for Education Resultswww.ccedresults.org6
  • 11.
    Region’s High EducationalLevelsHorizontal Image Area Source: 2008 American Community Survey, U.S. Census BureauRoad Map for Education Resultswww.ccedresults.org7
  • 12.
    8Only 1 Outof Every 4 King County Residents Who Have a Bachelor’s Degree or Higher Were Born HerePopulation 25 Years and Over with Bachelor’s, Graduate or Professional Degree, by Place of BirthPercent of Degree Holders Born In State of ResidencePercent of Degree Holders Born in Other State/Country74%71%74%74%58%51%47%71%58%U.S.King CountyMassachusettsMinnesotaRoad Map for Education Resultswww.ccedresults.org
  • 13.
    n9The Majority ofChildren in the Road Map Region are Not Ready for School When They Begin KindergartenPercent of Kindergarten Students Meeting DIBELS Standard, by District (2009)Percent of Auburn Students Meeting DIBELS Standard, by Sub-Group (2009)73%61%59%42%50%41%33%Auburn DIBELS perfor-mance, by sub-group29%28%30%26%AuburnTukwilaHighlineLake Washington (Benchmark)RentonHispanicAsianPacific IslanderWhiteNative Am.BlackSource: 2009 DIBELS data from PSESDRoad Map for Education Resultswww.ccedresults.org
  • 14.
    10Within Our Region,Large Achievement Gaps Between Low-Income and Non-Low-Income Students Exist from an Early AgeSupported and Successful in SchoolPercent Proficient on 3rd Grade Reading (2010)Percent Proficient on 3rd Grade Reading (2010)Road Map for Education Resultswww.ccedresults.org
  • 15.
    11And Those DisparitiesBetween Low-Income and Non-Low-Income Students Persist into Middle School.Supported and Successful in SchoolPercent Proficient on 7th Grade Math (2010)Percent Proficient on 7th Grade Math (2010)Road Map for Education Resultswww.ccedresults.org
  • 16.
    Seattle School ReportCards12Schools were ranked on a scale of 1 to 5, based largely on test scores — not just the percentage of students passing tests but the percentage making gains. But not a single in South Seattle elementary, middle or high school received better than a 3.LEGEND:Red = Level 1Low Overall Absolute Performance and Low-to-Medium Overall Growth PerformanceOrange = Level 2Medium-Low Overall Absolute Performance and Low-to-Medium Overall Growth PerformanceYellow = Level 3Low or Medium-Low Overall Absolute Performance and High Overall Growth Performance or Medium-High Overall Absolute PerformanceGreen = Level 4High Overall Absolute Performance (w/ Free and Reduced Price Lunch Achievement Gap)Blue = Level 5High Overall Absolute Performance (w/ no Free and Reduced Price Lunch Achievement Gap)Source: http://www.seattleschools.org/area/strategicplan/segmentation.pdfRoad Map for Education Resultswww.ccedresults.org
  • 17.
    Tale of TwoPipelines: Cleveland HS vs. Bellevue HS13Source: Graduation data from OSPI for Class of 2008, college data from College Tracking Data Services (BERC Group) for Class of 2008Road Map for Education Resultswww.ccedresults.org
  • 18.
    Tale of TwoPipelines : Chief Sealth HS Vs Roosevelt HS Source: Graduation data from OSPI for Class of 2008, college data from College Tracking Data Services (BERC Group) for Class of 2008Road Map for Education Resultswww.ccedresults.org14
  • 19.
    215Postsecondary Attainment –Particularly Among Students of Color – is Shockingly LowStudent Progression, 9th Grade to College/Credential Completion100%Asian100%White83%81%Black80%68%66%66%Hispanic61%58%60%Native American45%44%41%38%40%34%31%31%25%21%20%20%12%11%10%0%Graduate HSEnroll in PSAttain CredentialReturn for 2nd Year of PSEnrolled in 9th GradeNote: Data is for high school graduating class of 2004 in the Road Map region, including Auburn, Federal Way, Highline, Kent, Renton, Tukwila and South Seattle public schools. Seattle high schools include Cleveland, Franklin, Garfield, Rainier Beach, Sealth, and South Lake. Source: OSPI The BERC Group, College Tracking Data ServicesRoad Map for Education Resultswww.ccedresults.org
  • 20.
    1689% of parentsin our target region feel that it is “very important” for their children to go to college or a trade or technical schoolHow important is it to you that your children go to college or a trade or technical school after high school?Road Map for Education Resultswww.ccedresults.org
  • 21.
    Great Progress isPossible17Parent Child Home Program IBEST – Integrated Basic Education and Skills TrainingMartin Sortun Elementary Urban League Scholars“Be the Change”Road Map for Education Resultswww.ccedresults.org
  • 22.
    STRIVE – CincinnatiE3 Alliance – Austin Promise Neighborhood Harlem/National ReplicationReady by 21City of Seattle – Youth and Families Initiative18Other communities are organizing for action tooRoad Map for Education Resultswww.ccedresults.org
  • 23.
    How do weget there?—Road Map For Education Results19Graduate from high school - college and career readyEarn a college degree or career credentialHealthy and ready for KindergartenSupported and successful in schoolPathway to success for our students, our community, and our economy. Road Map for Education Resultswww.ccedresults.org
  • 24.
    The Road Mapfor Education ResultsOur goal is to double the number of students in South King County and South Seattle who are on track to graduate from college or earn a career credential by 2020. We are committed to nothing less than closing the unacceptable achievement gaps for low income students and children of color, and increasing achievement for all students from cradle to college and career. ReadinessAttainmentAchievementGraduate from high school --college and career-readyHealthy and ready for KindergartenSupported and successful in schoolEarn a college degree or career credentialWe will report on our progress using the following measures:1% students proficient in 3rdgrade reading
  • 25.
    % students proficientin 4thgrade math
  • 26.
    % 9th graderswho pass end of course algebra exam
  • 27.
    % students motivatedand engaged to succeed in school3
  • 28.
    % students whoare not triggering all three Early Warning indicators4
  • 29.
    % of parentswho believe a college degree is important and actively support their child’s education
  • 30.
    % students graduatinghigh school meeting proposed Washington State graduation requirements5

Editor's Notes

  • #3 Section 1 – Intro Intro about the Project It used to be true that you could move out of poverty with a high school diploma- now that’s very hard to do.Income increases as the level of education increases and that “education premium” is growing.So it’s all good, right? Education is important and our region is a mecca for highly educated folks.Wrong, we are a region of haves and have nots