

This document discusses assessing risk of bias during systematic reviews. It defines bias as systematic error that deviates from the truth and can lead to over or underestimating effects. Assessing bias in included studies is important because results may be consistent due to flaws. There are seven domains for assessing bias: selection, performance, detection, attrition, reporting, and other biases. Risk of bias is assessed by reviewing study methods, looking for missing information, and making judgments on pre-specified criteria about the likelihood studies were affected by bias in each domain. Tools like risk of bias tables are used to categorize judgments of low, high, or unclear risk of bias in individual studies.
Overview of risk of bias in systematic reviews by Prabesh Ghimire.
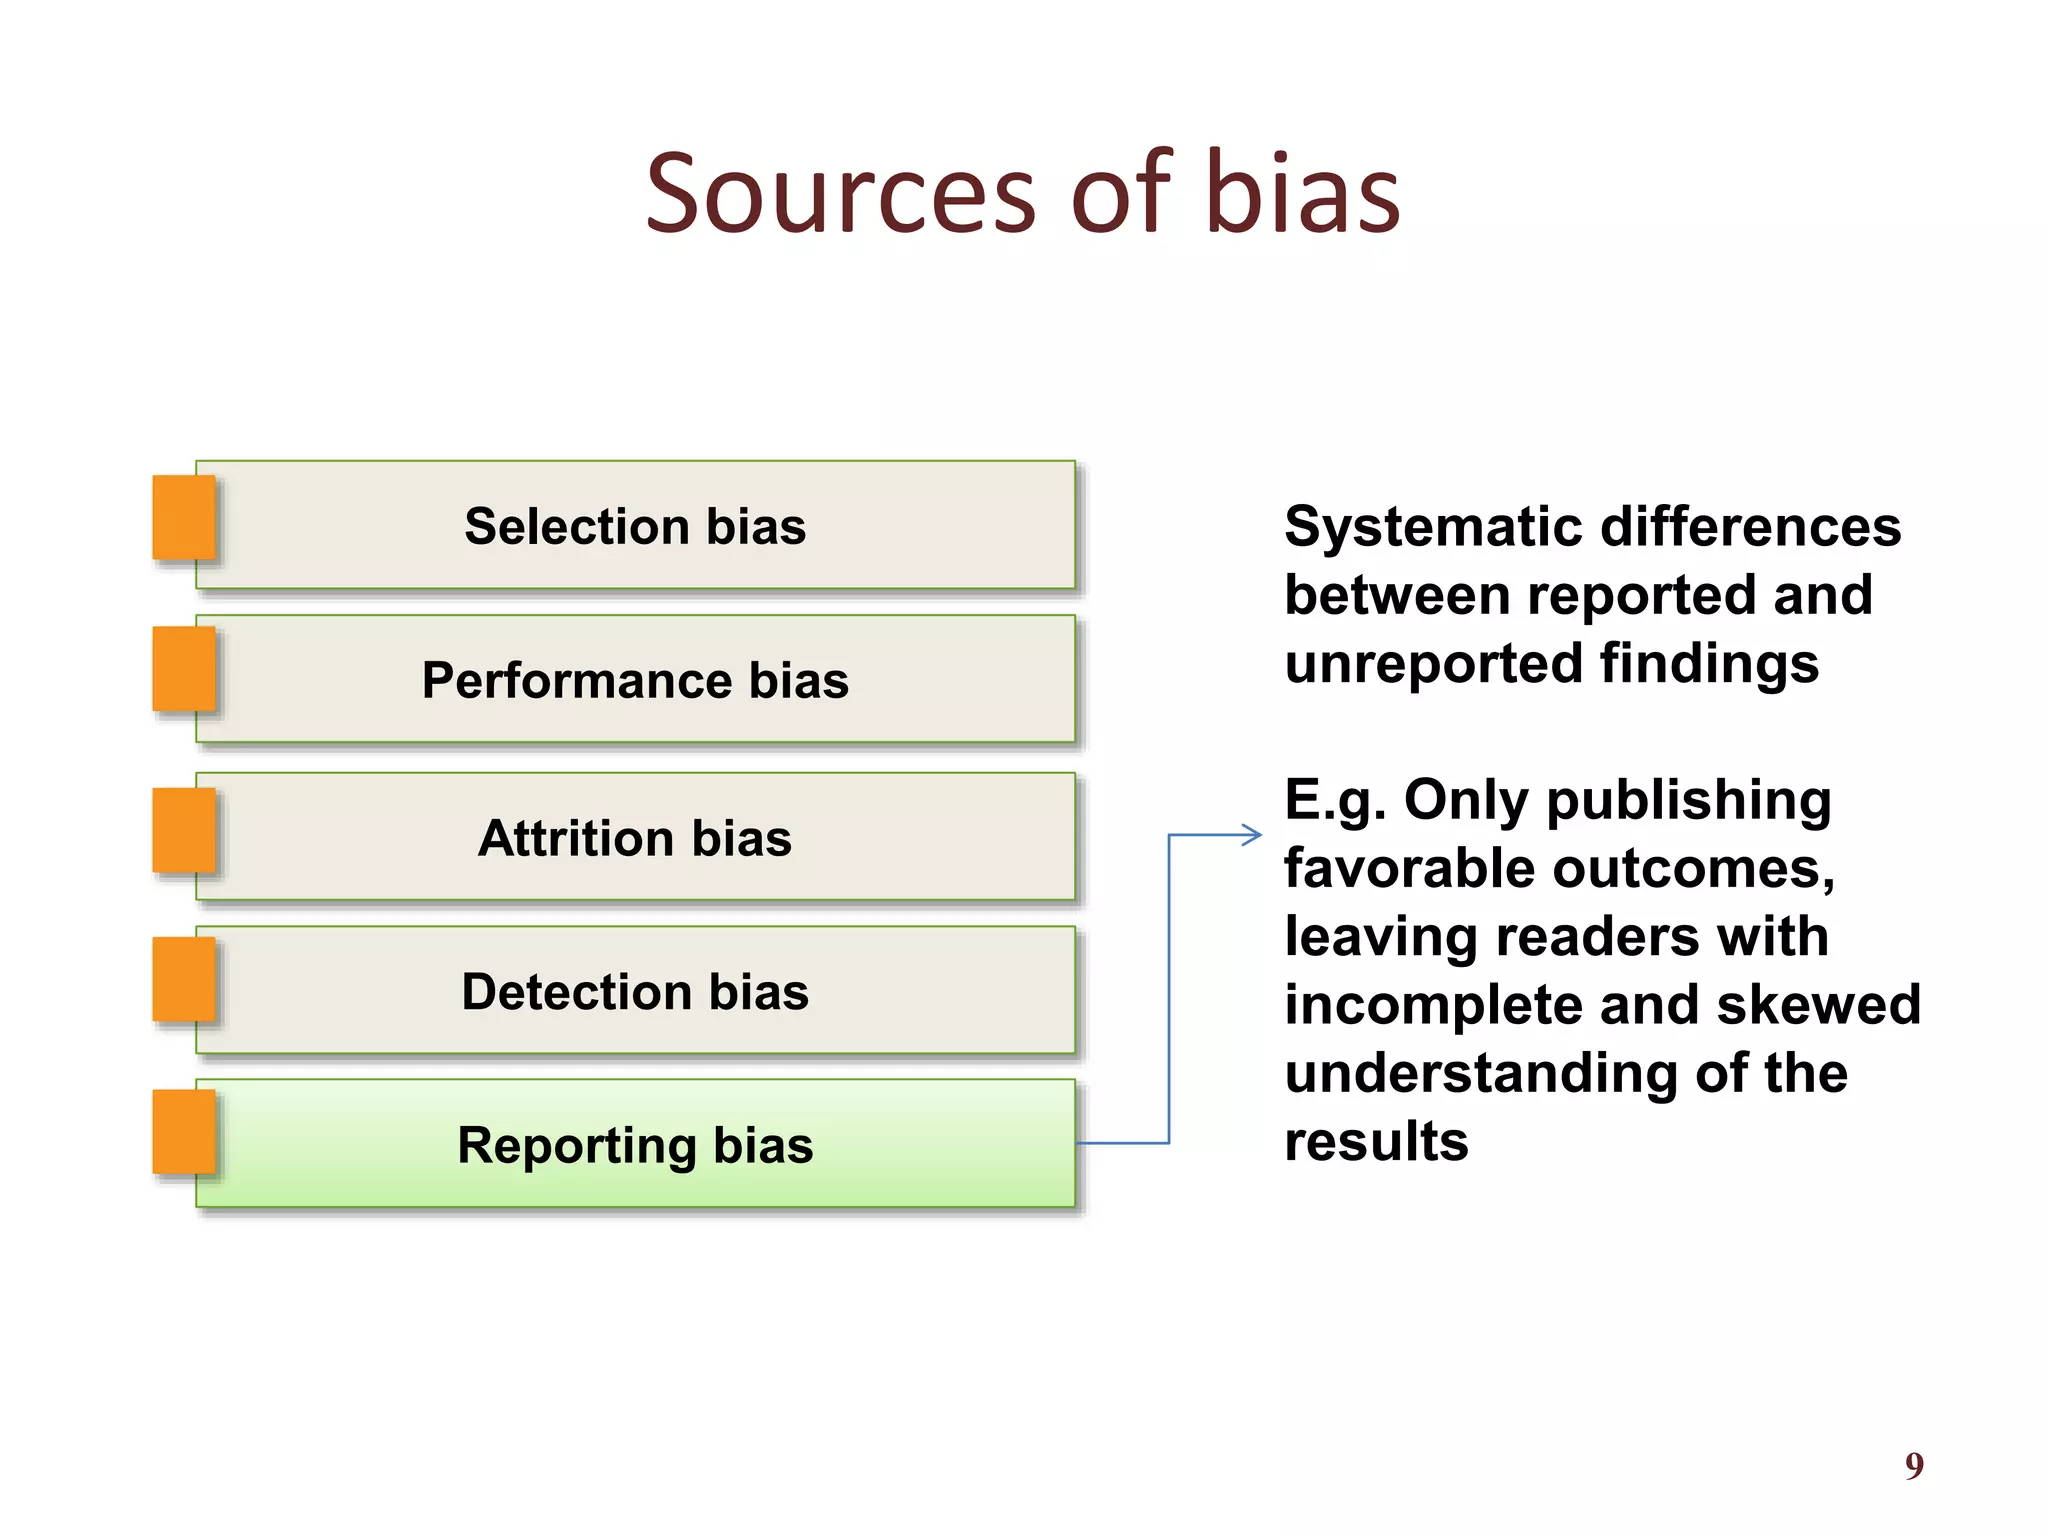
Definition of bias, types, significance, and its effects on systematic review results.
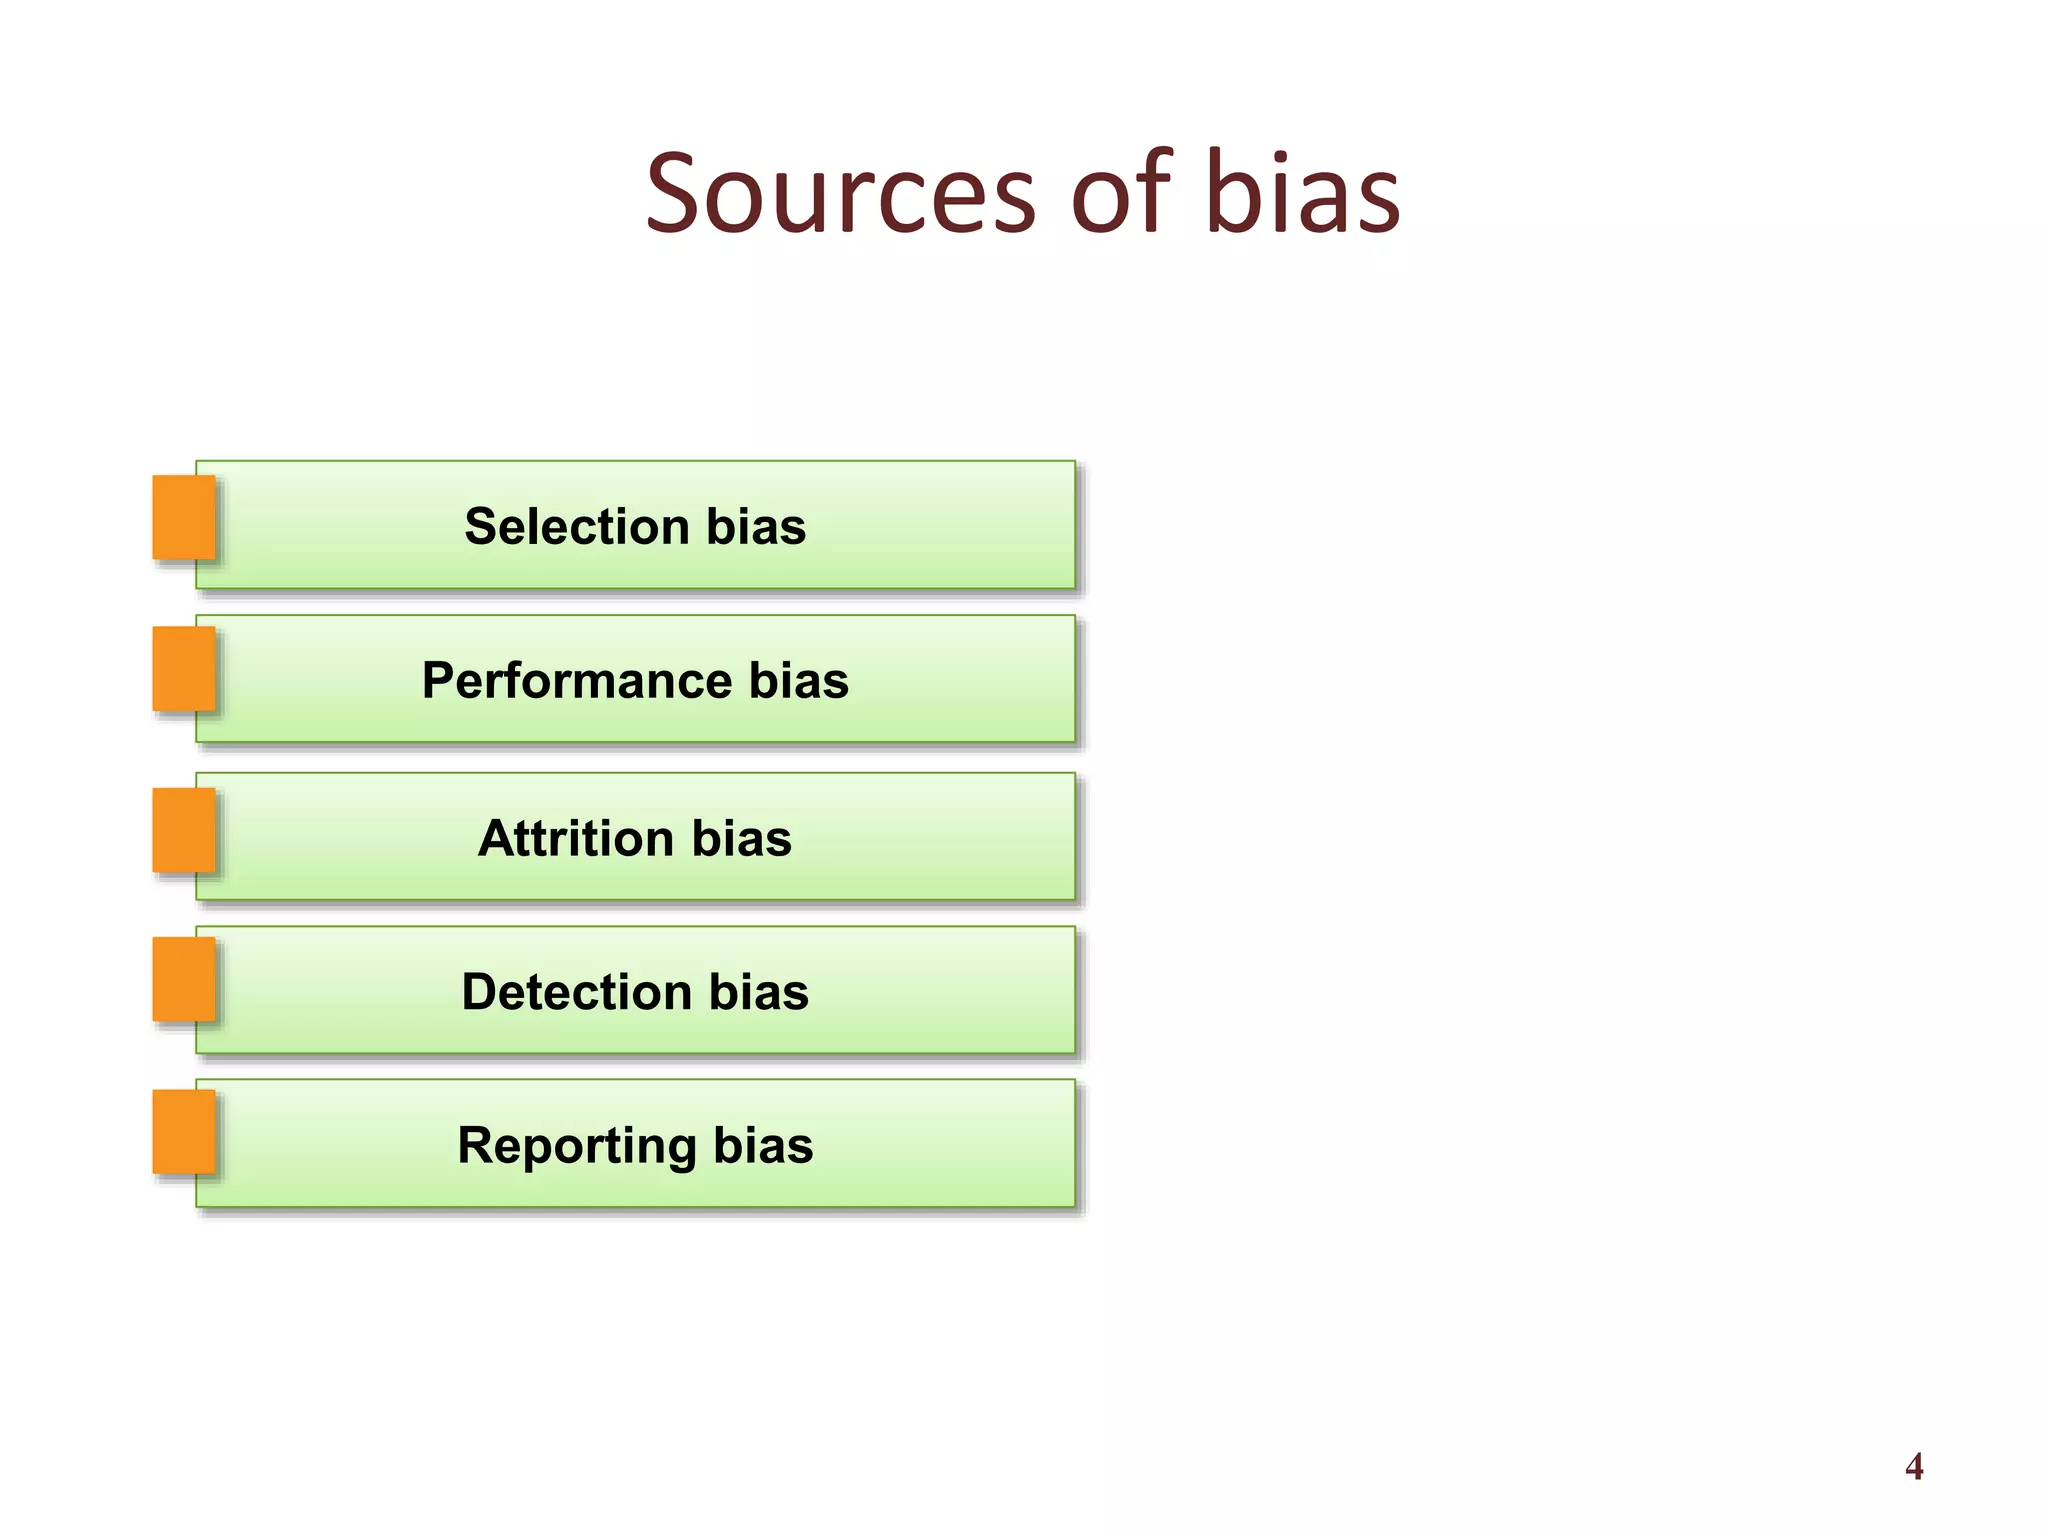
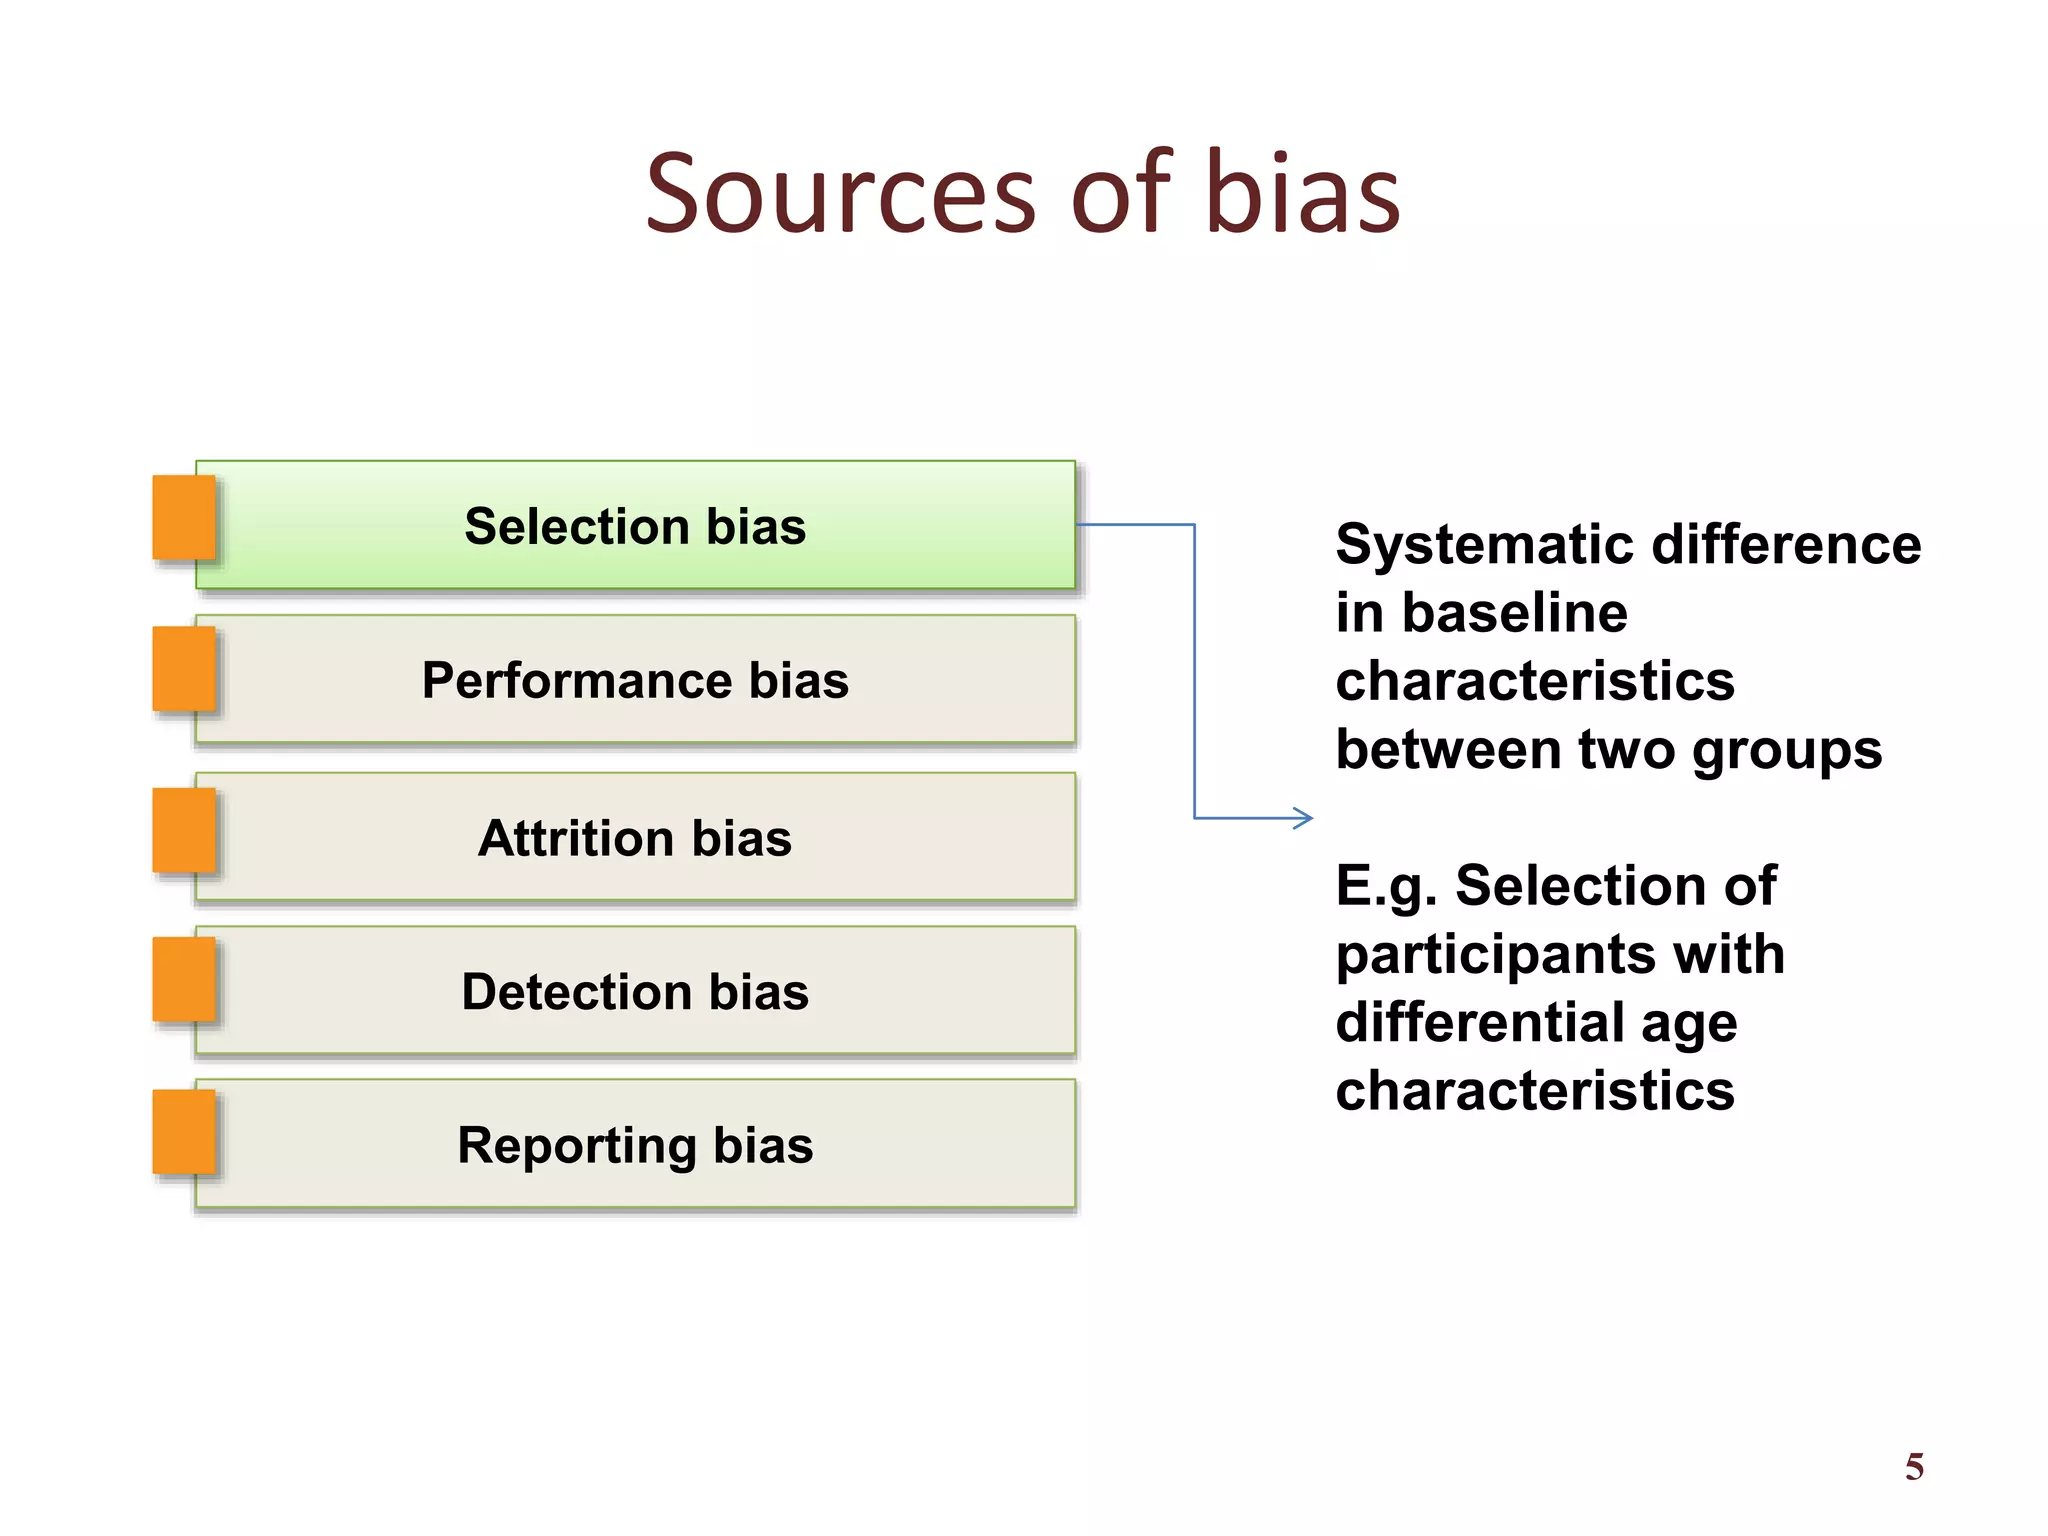
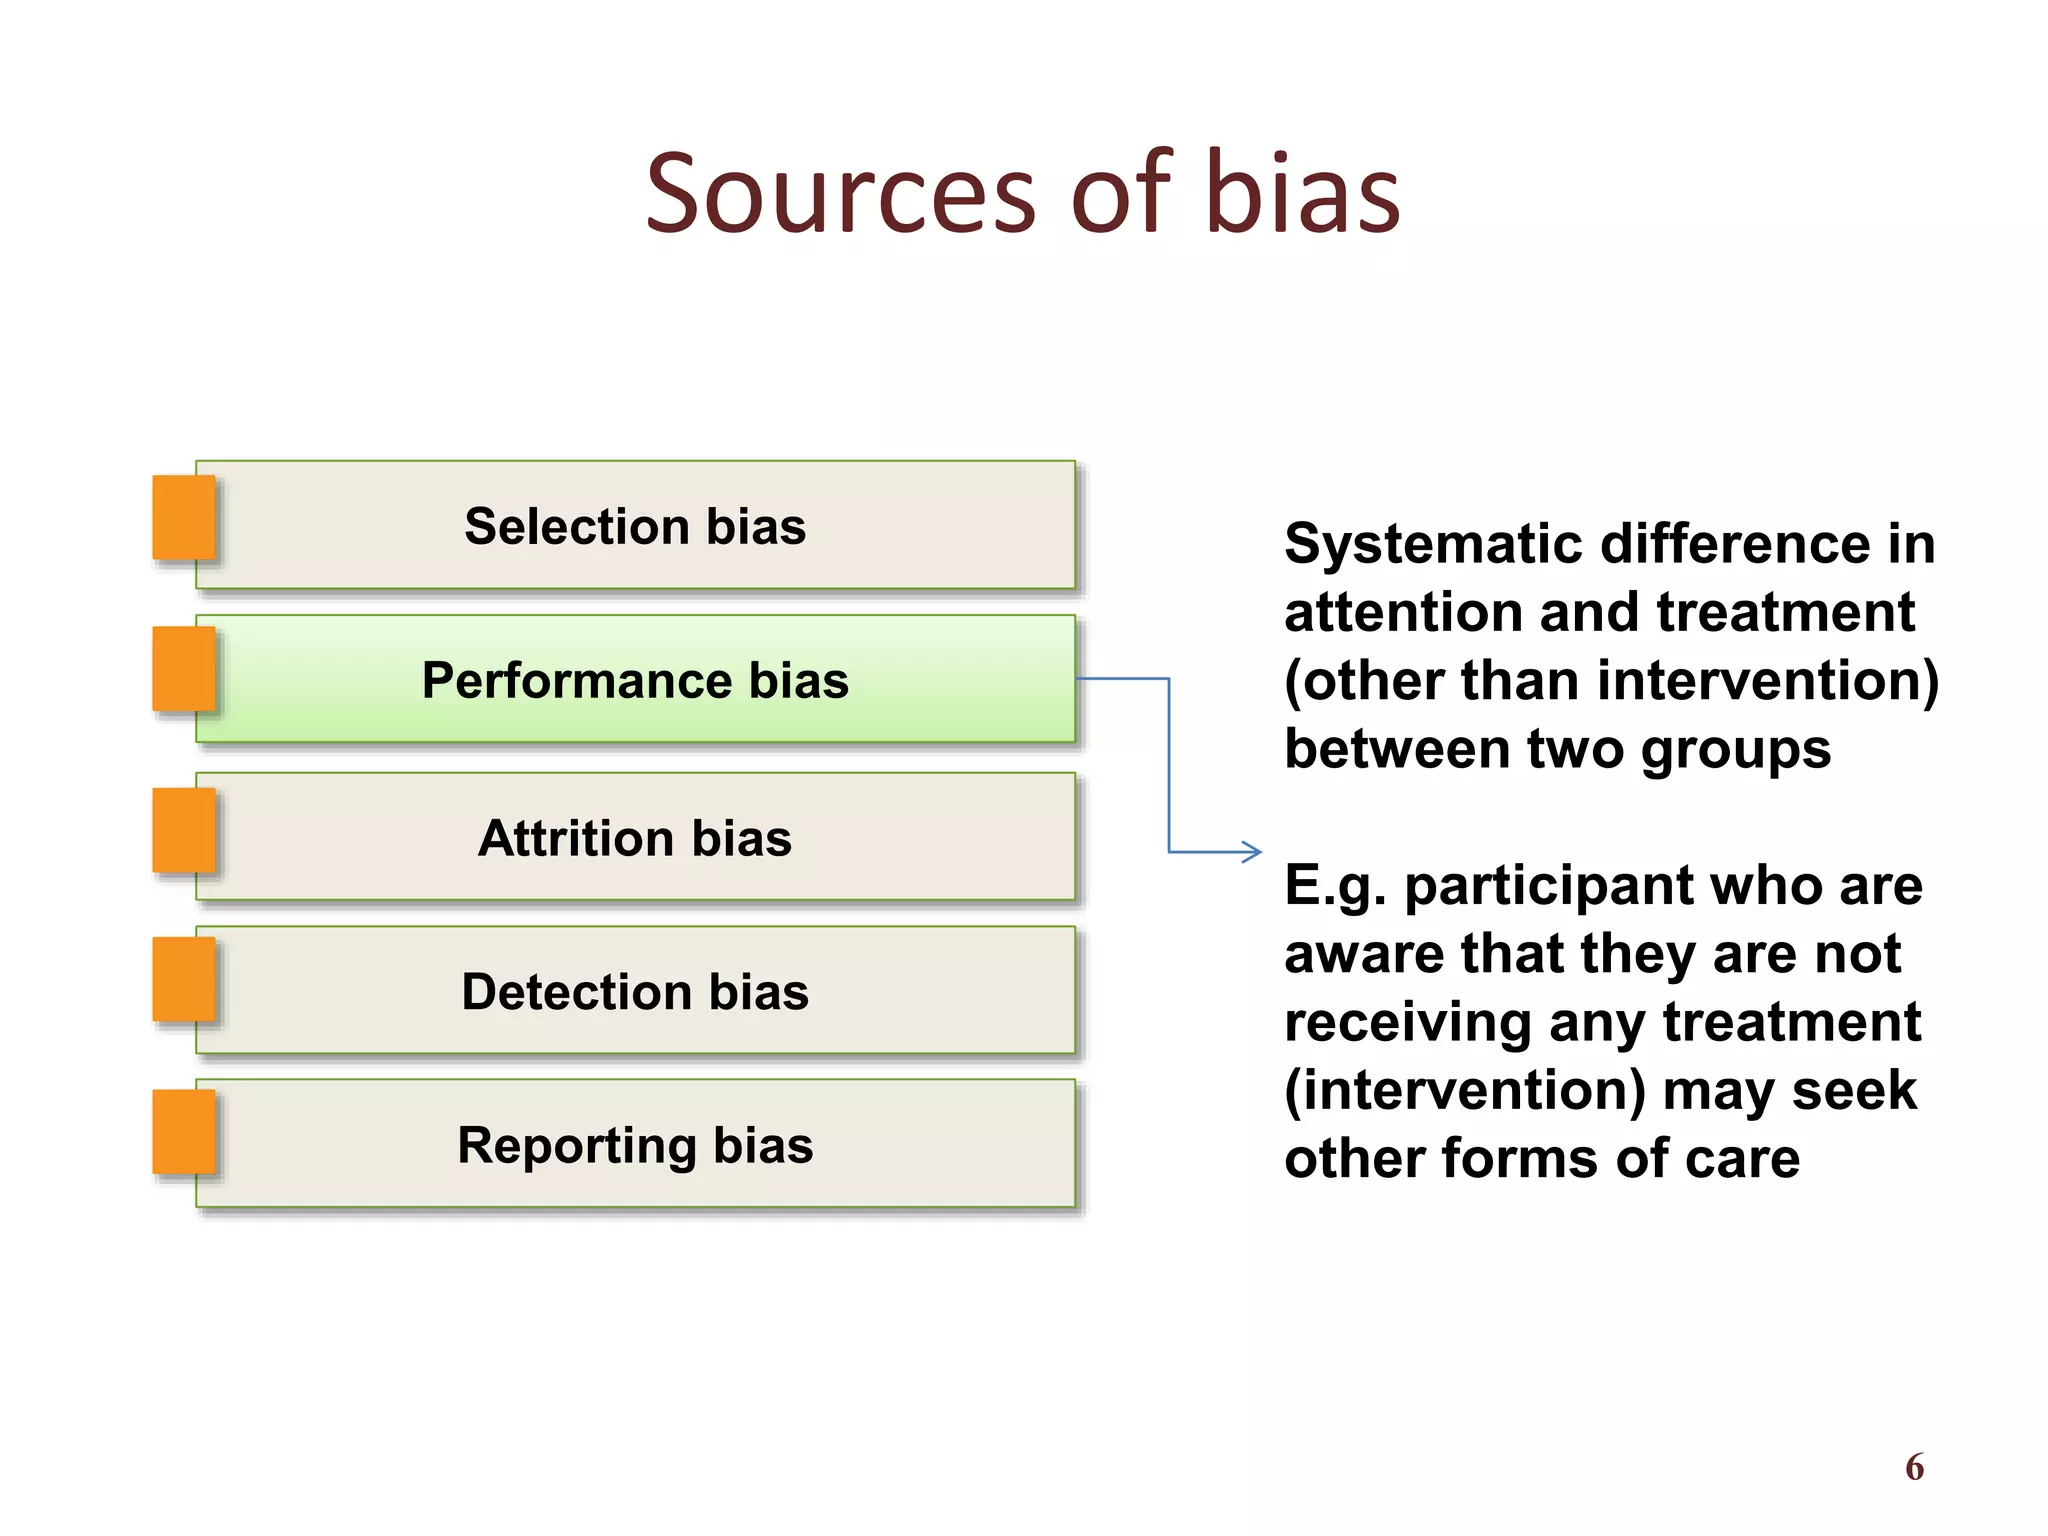
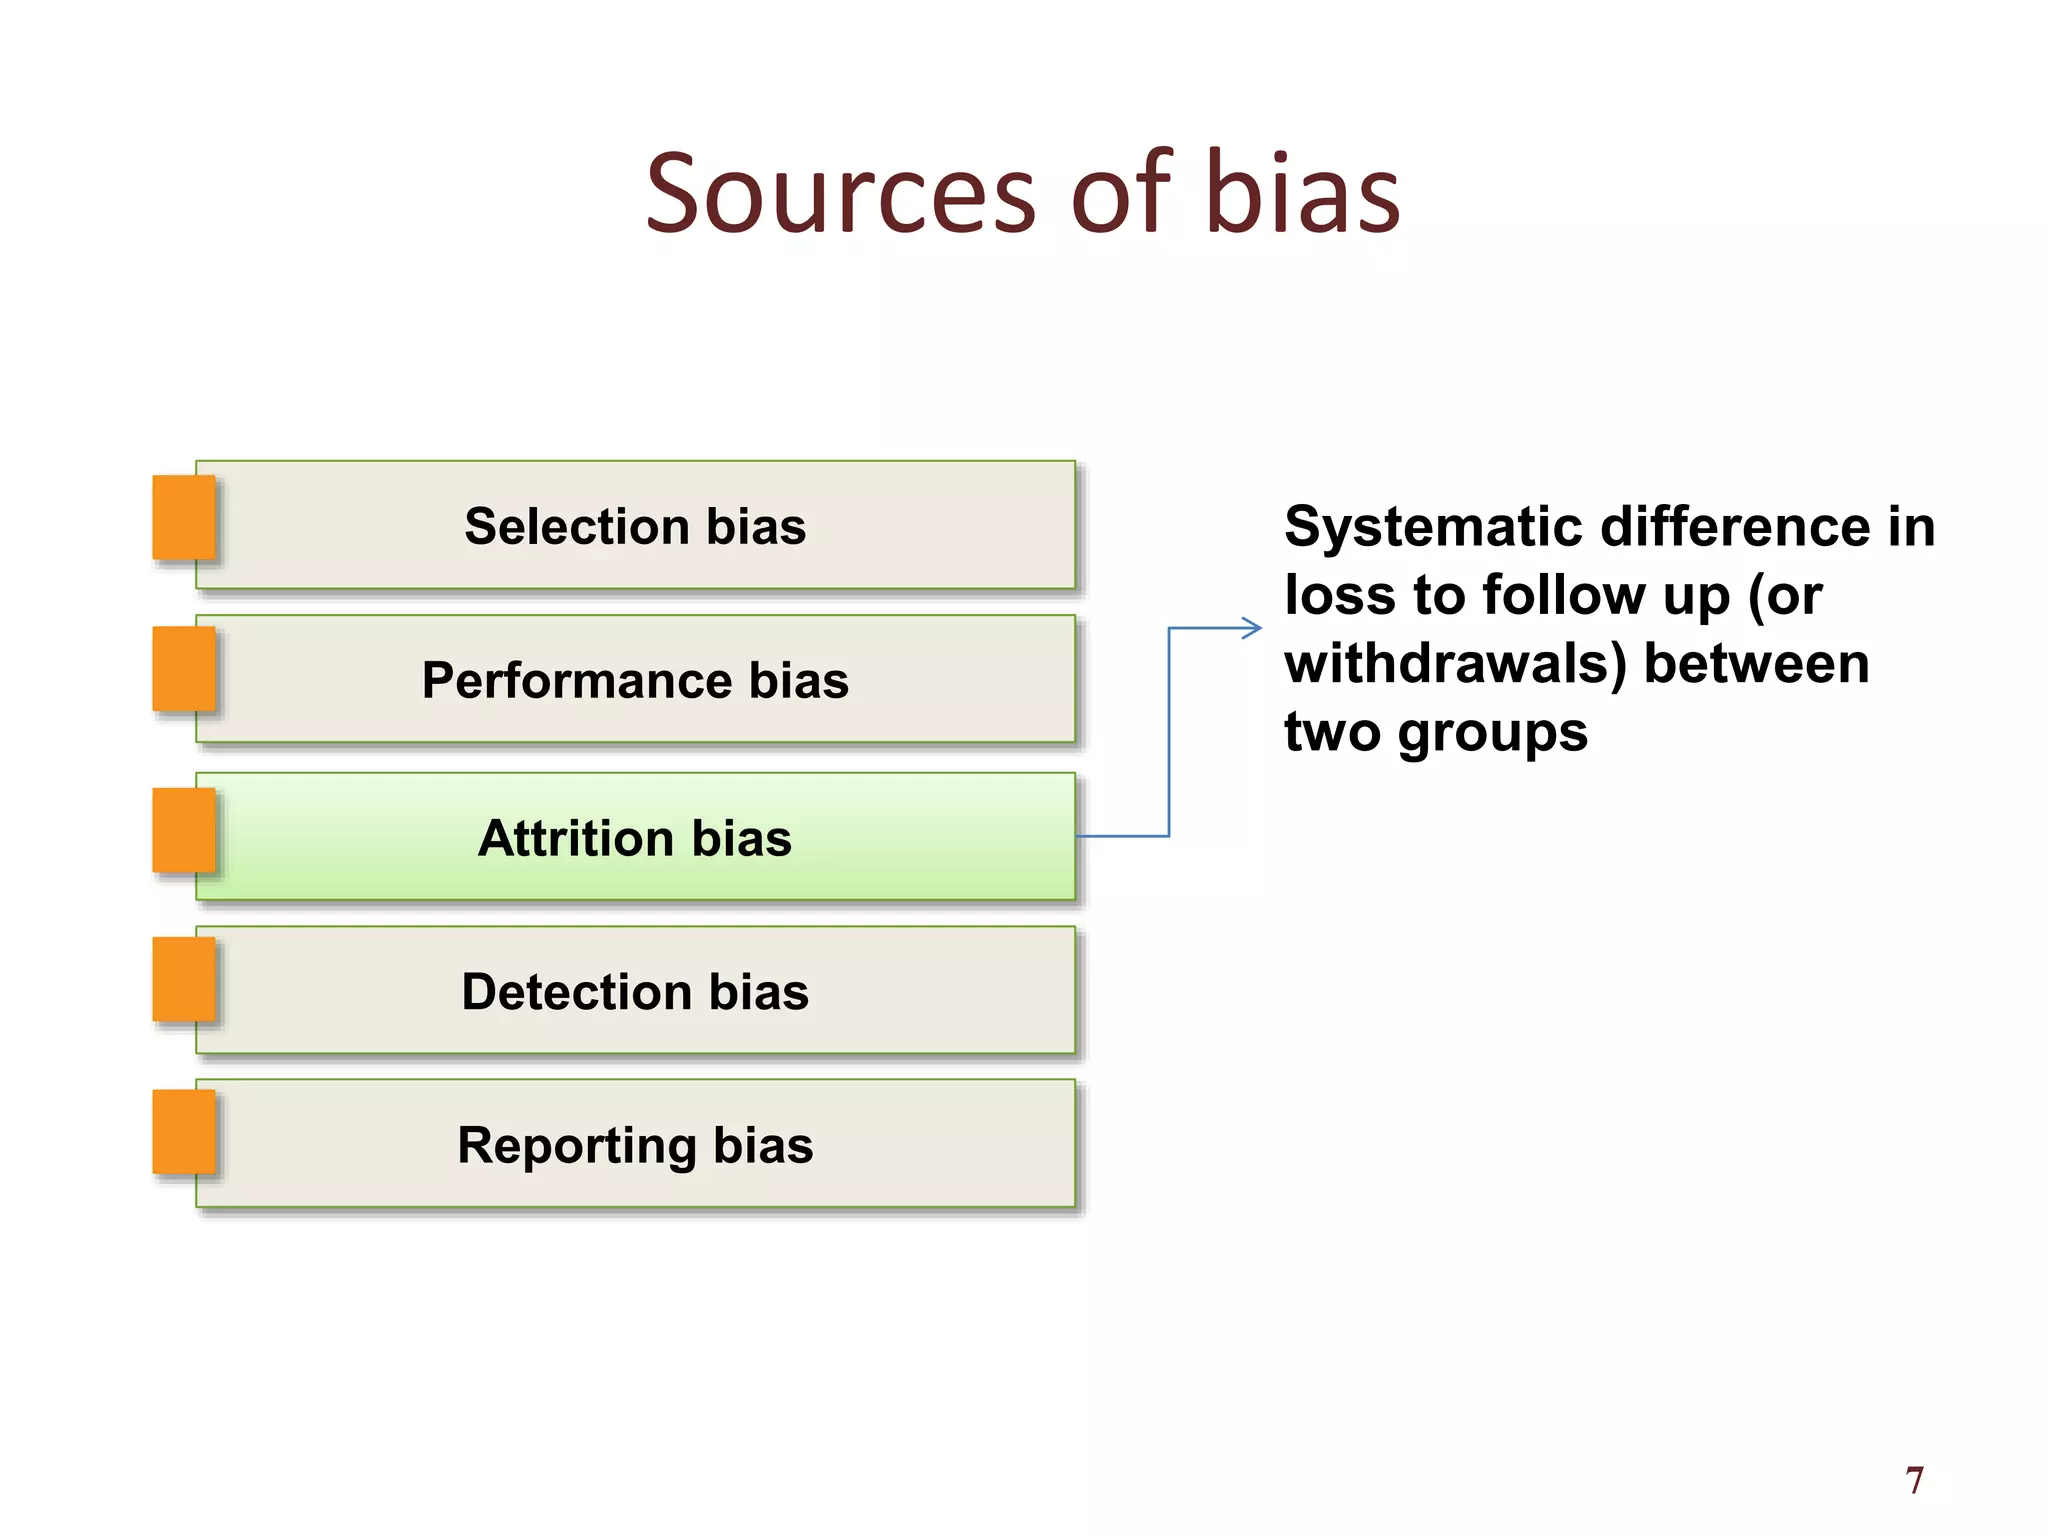
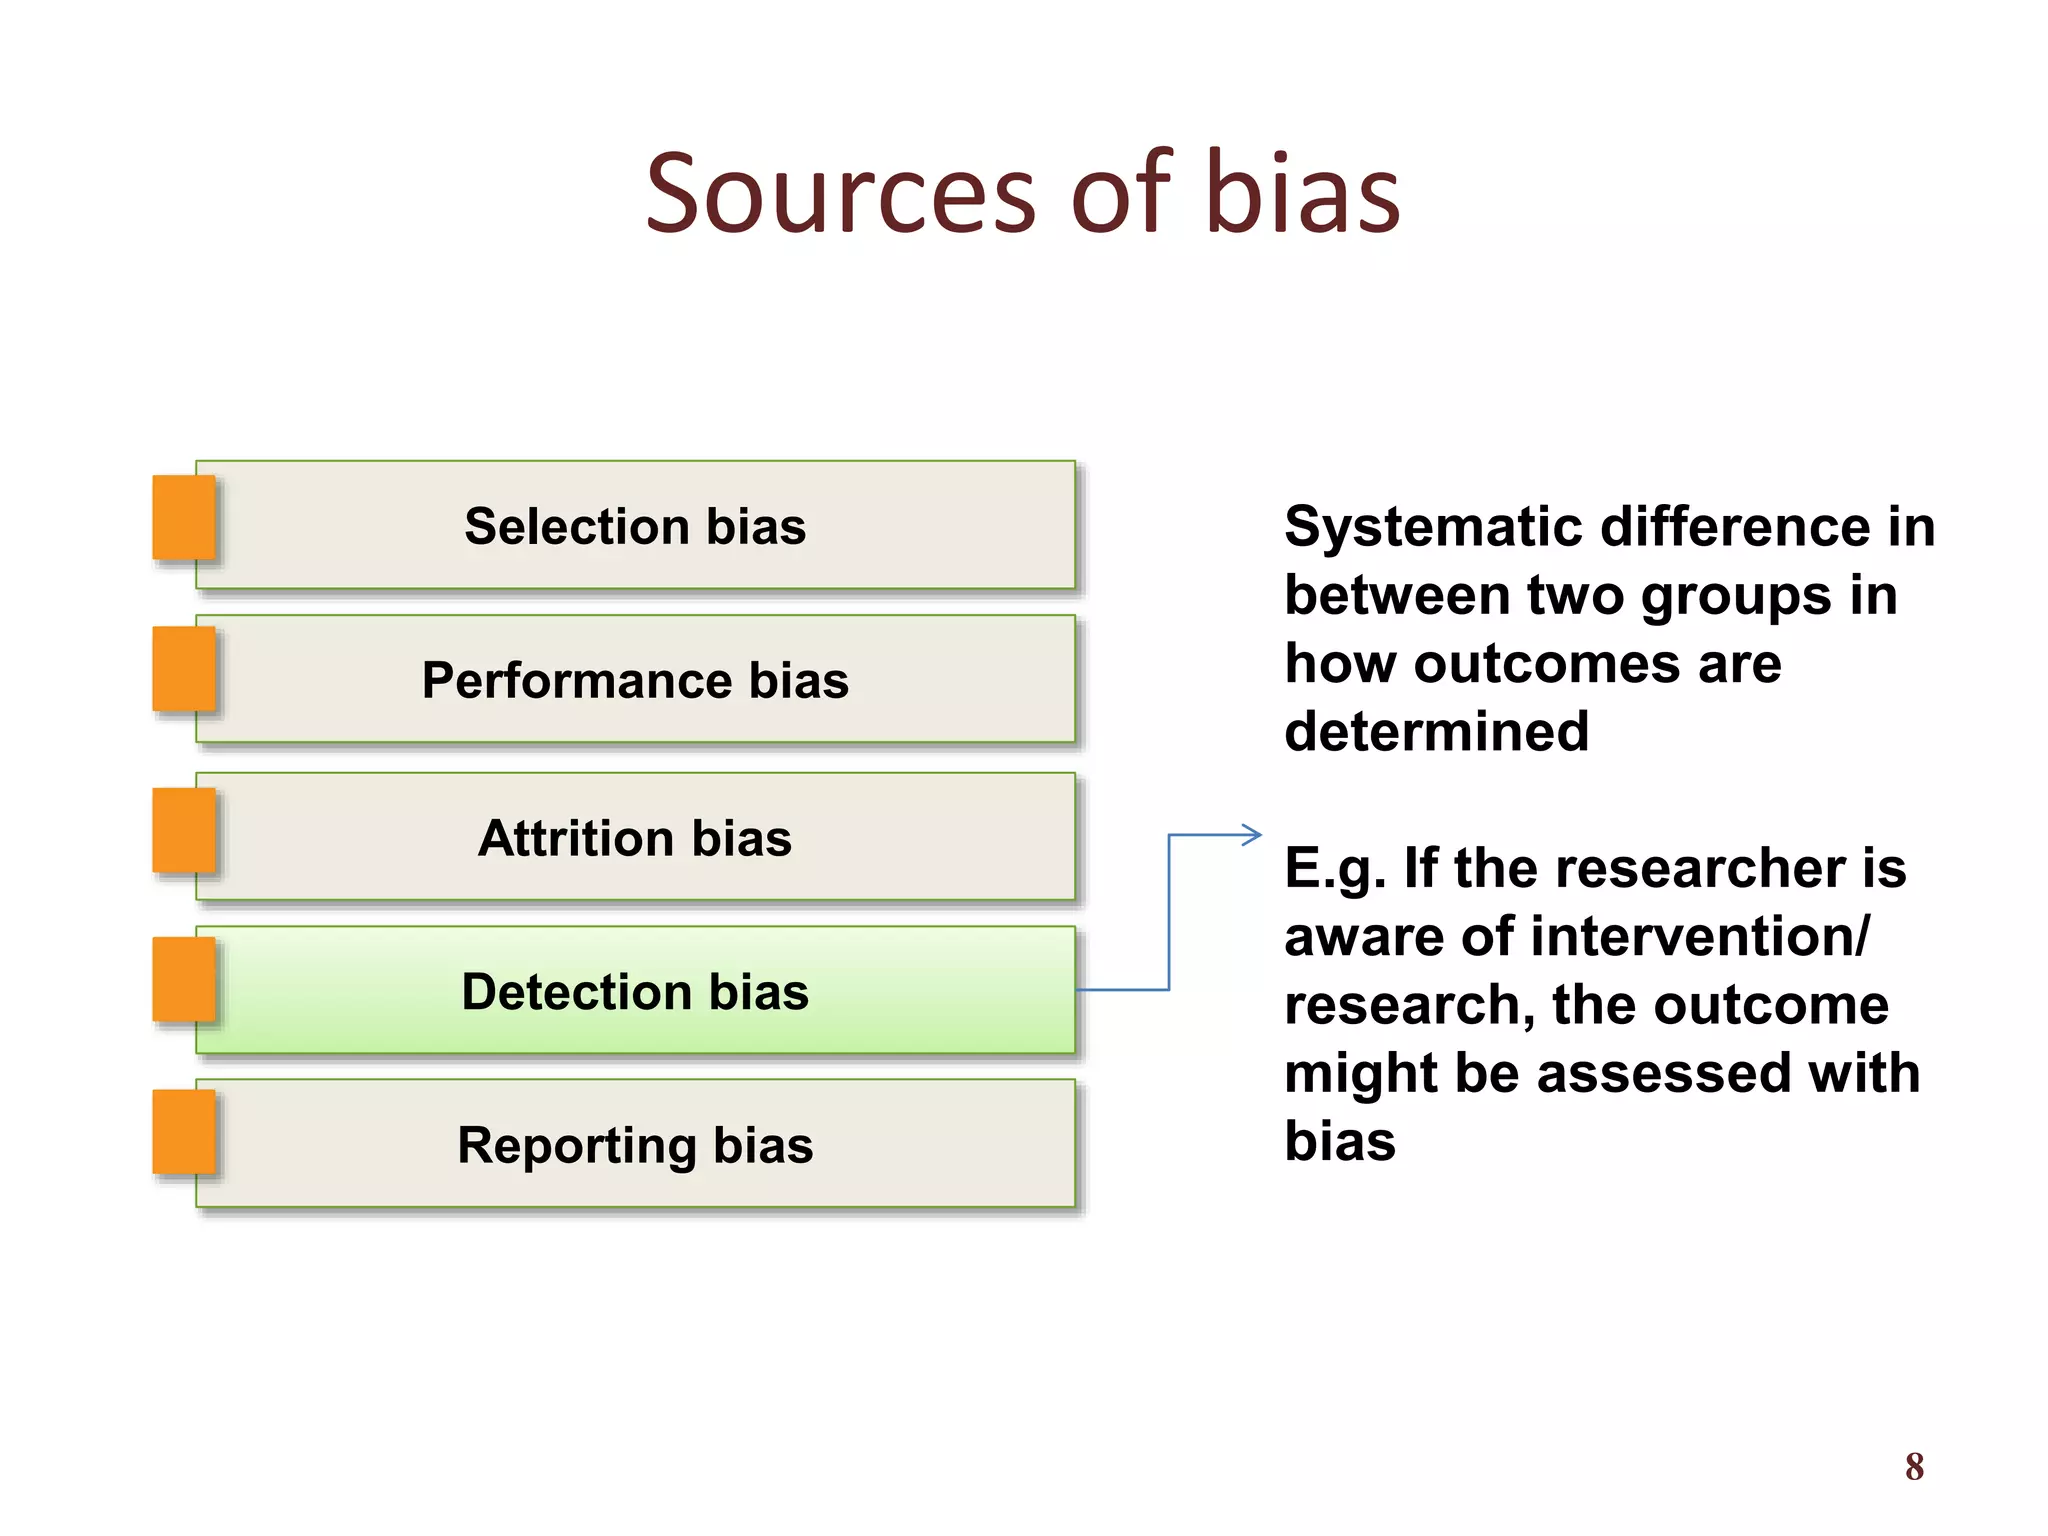
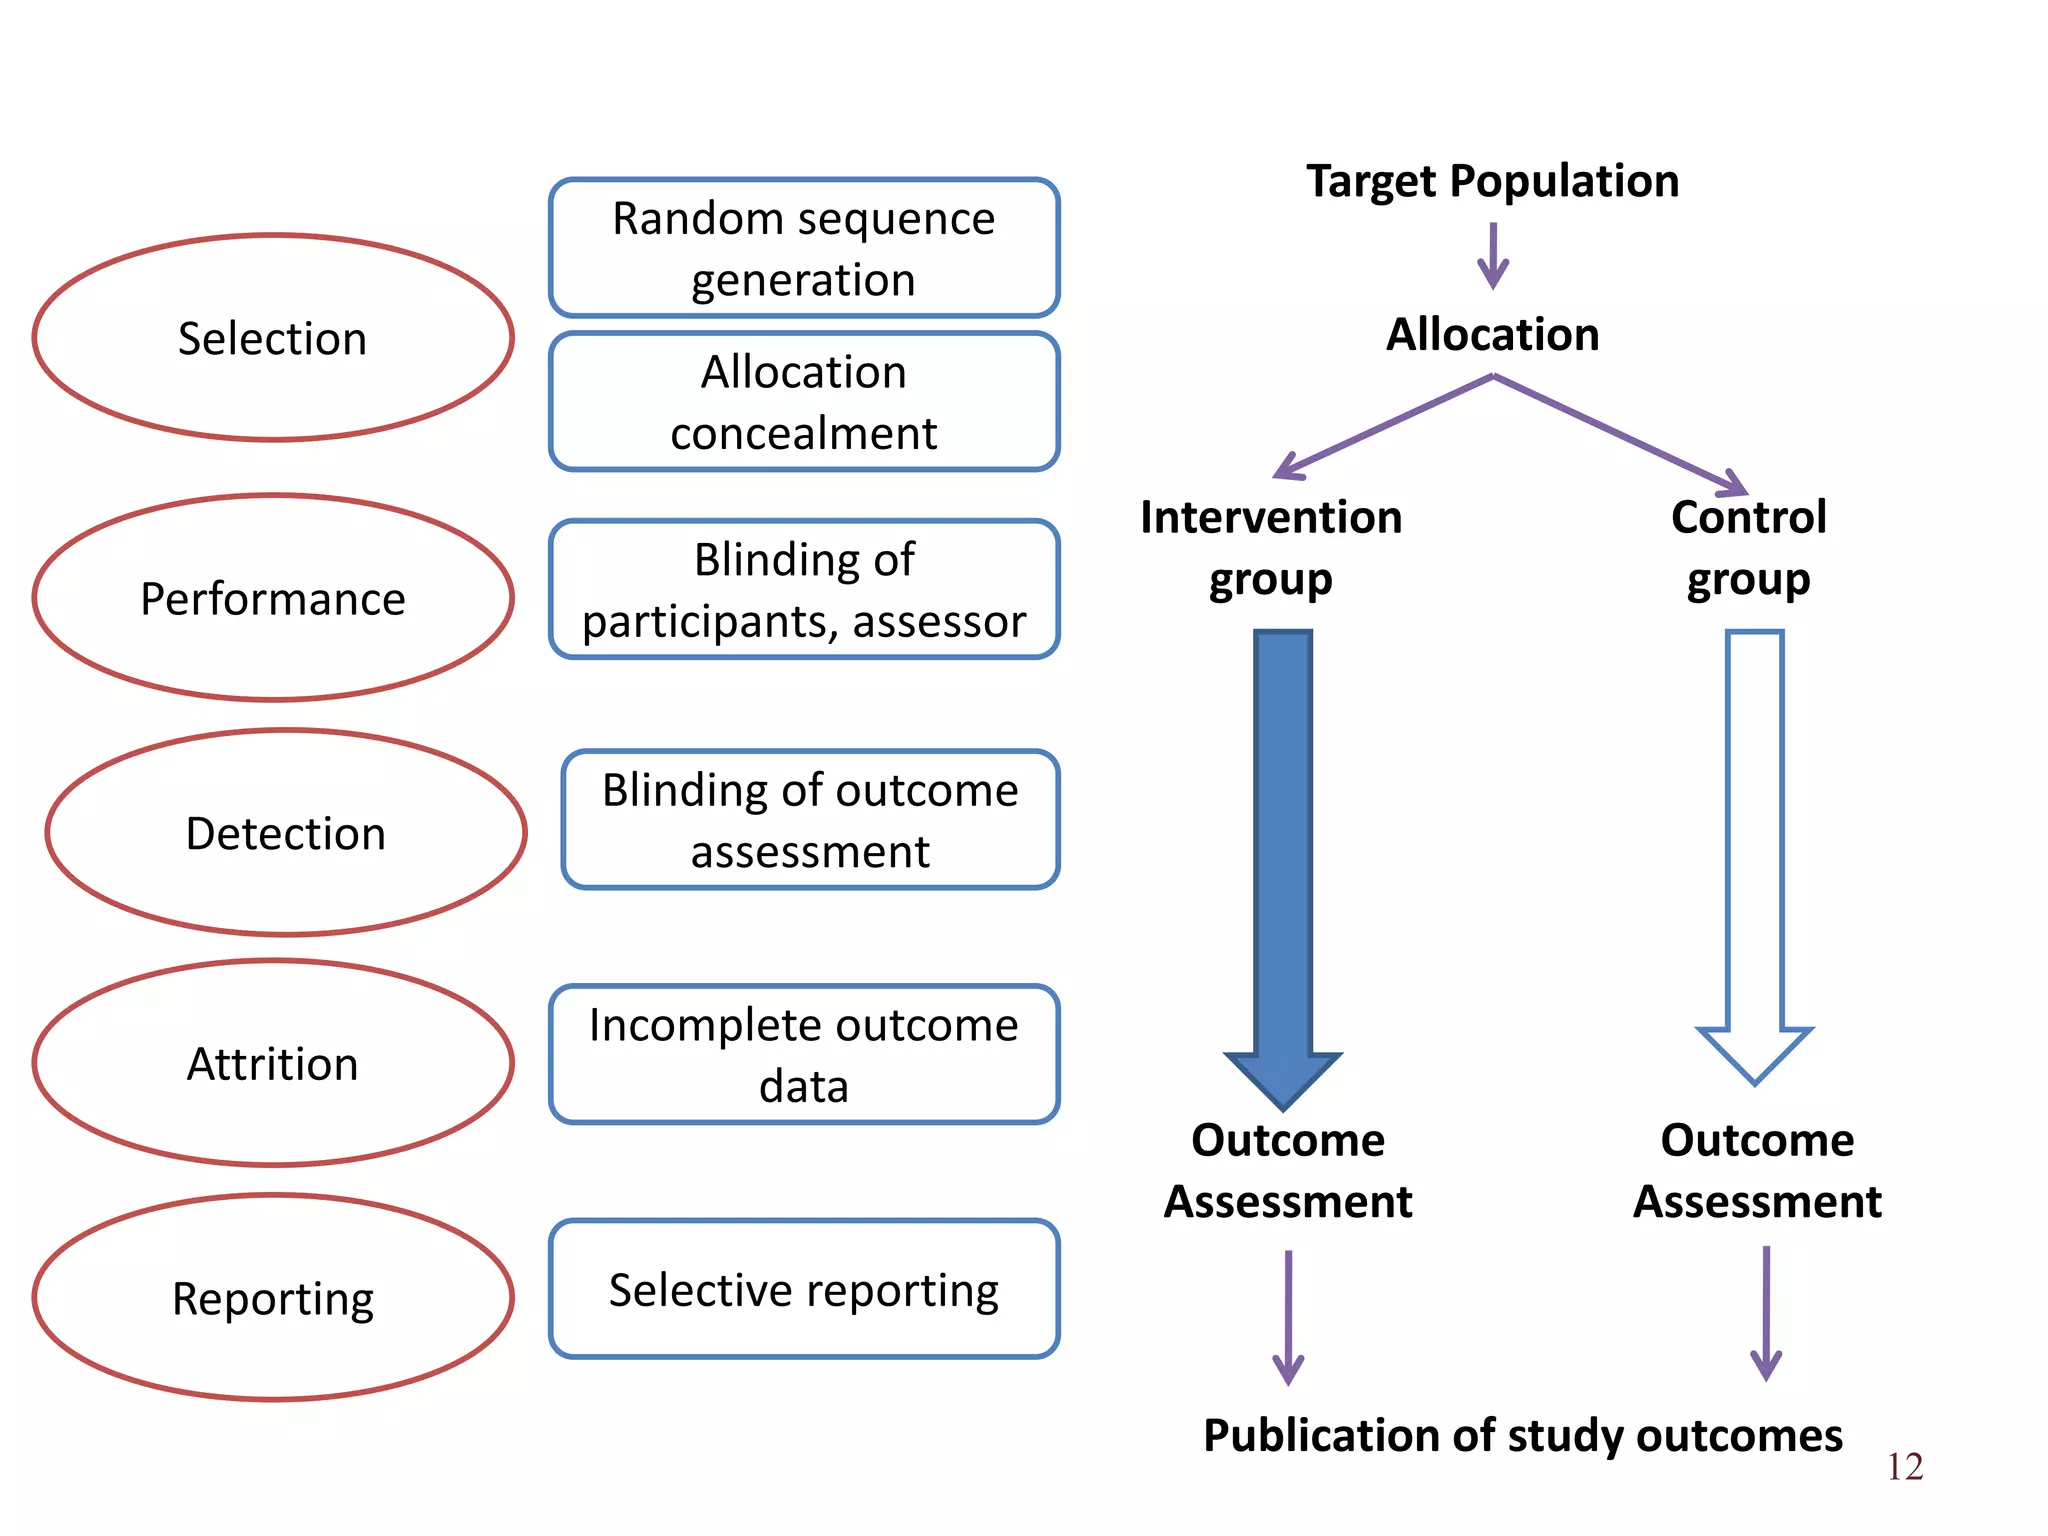
Clarification of five primary sources of bias: selection, reporting, attrition, performance, and detection bias, with explanations.
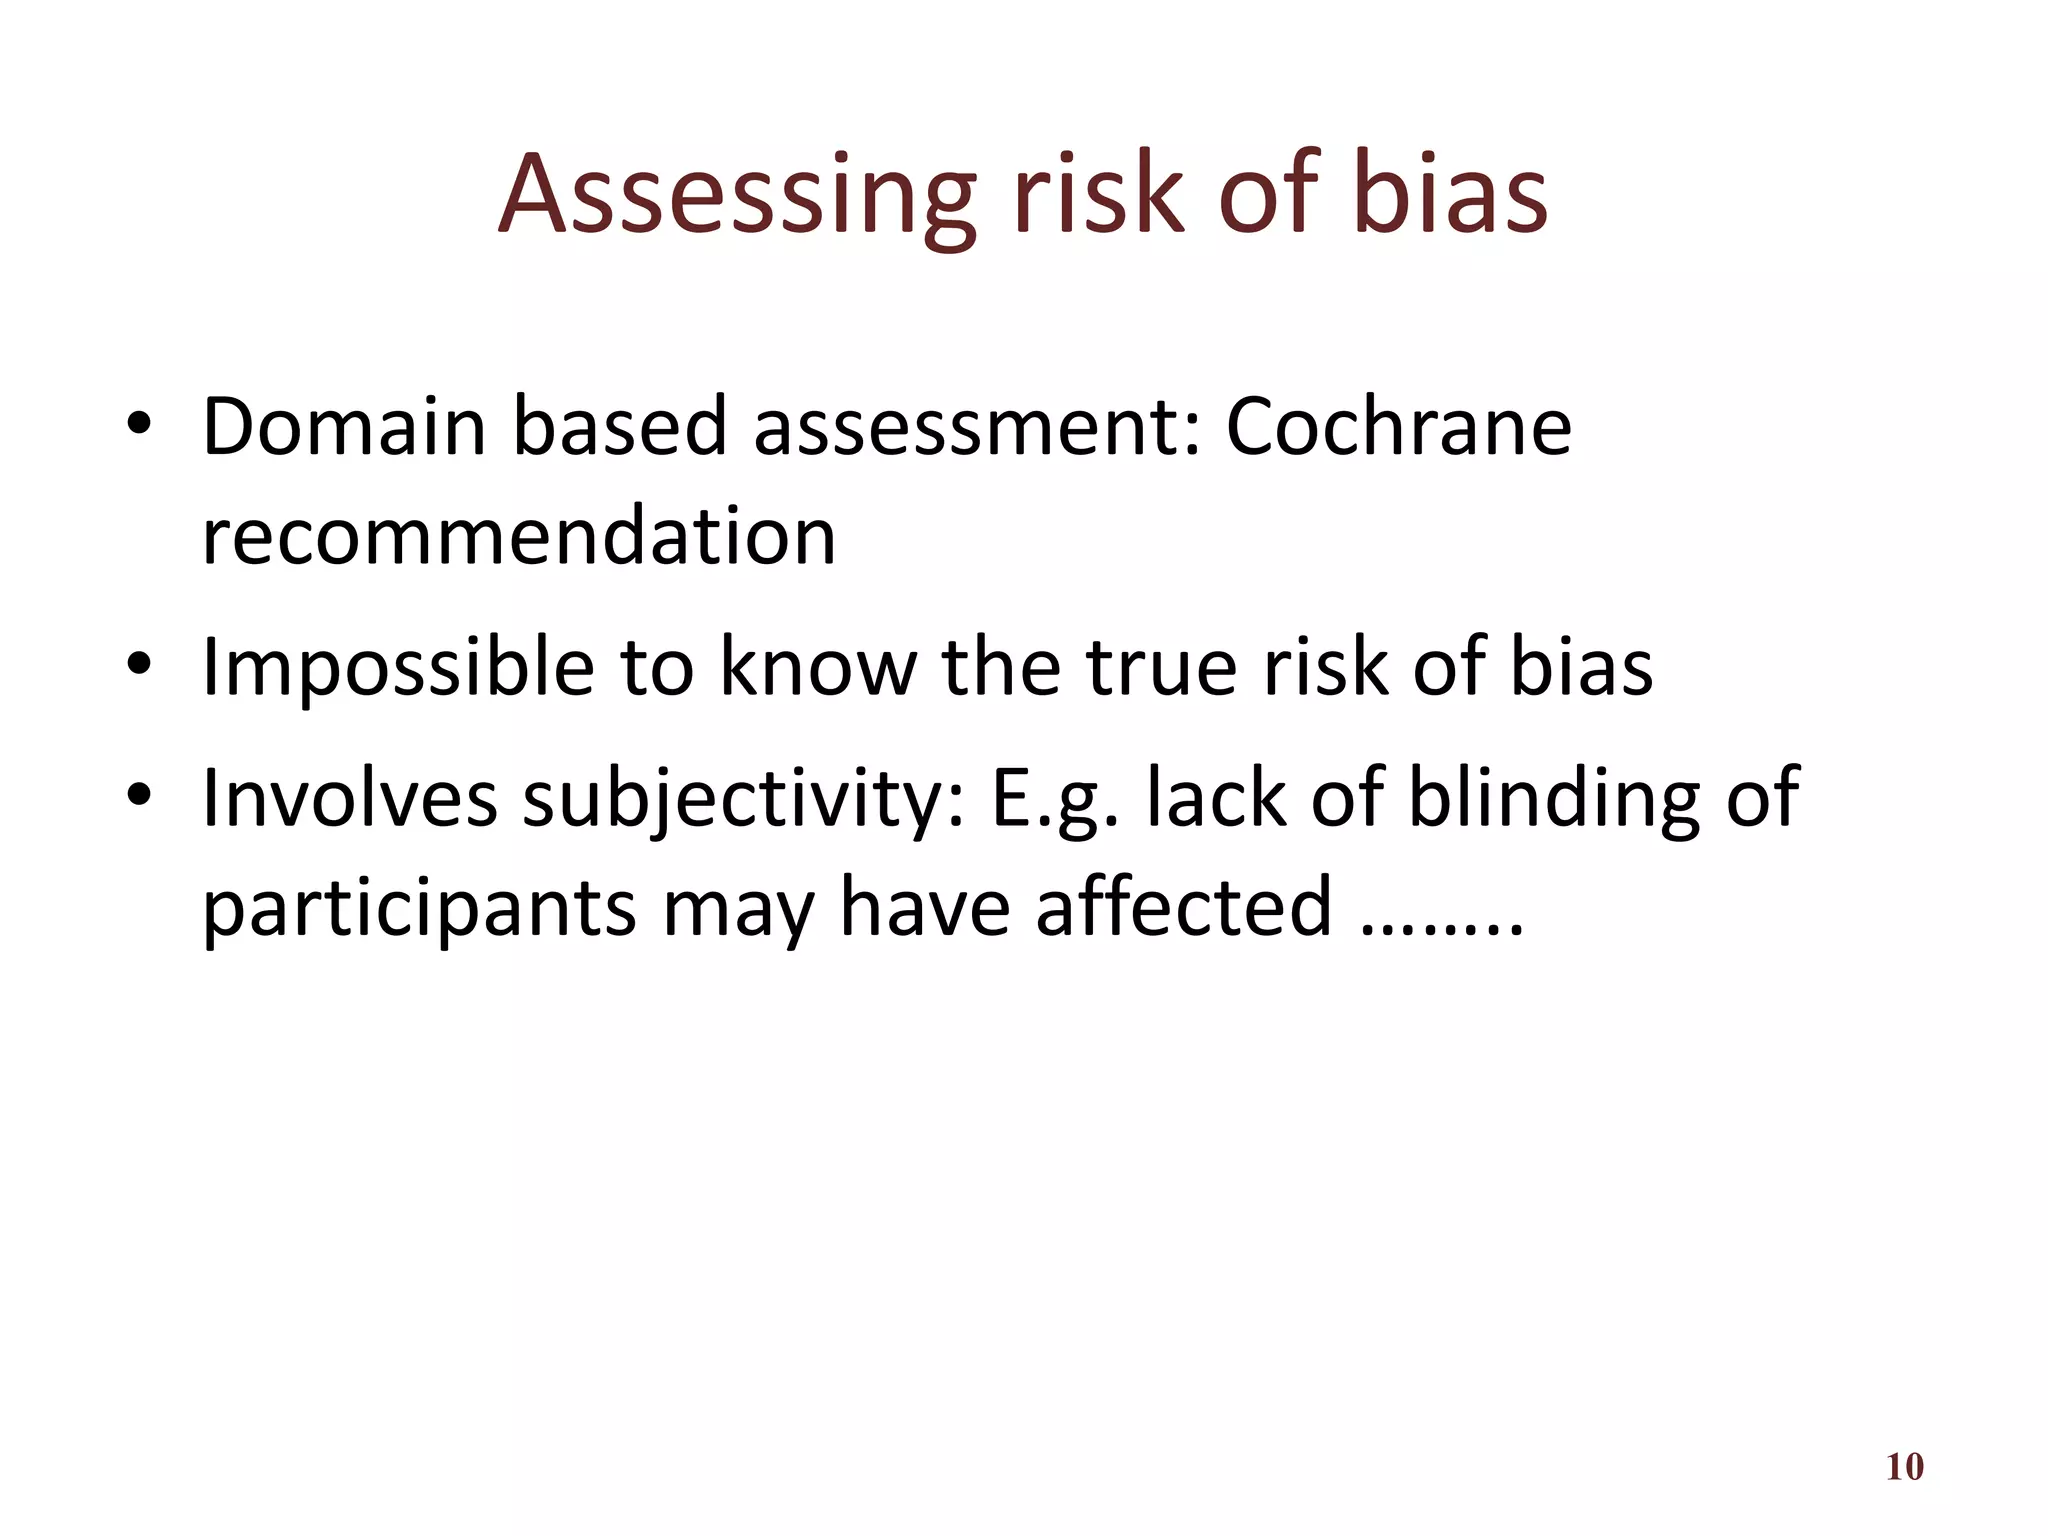
Discusses domain-based assessments recommended by Cochrane and factors affecting bias risk.
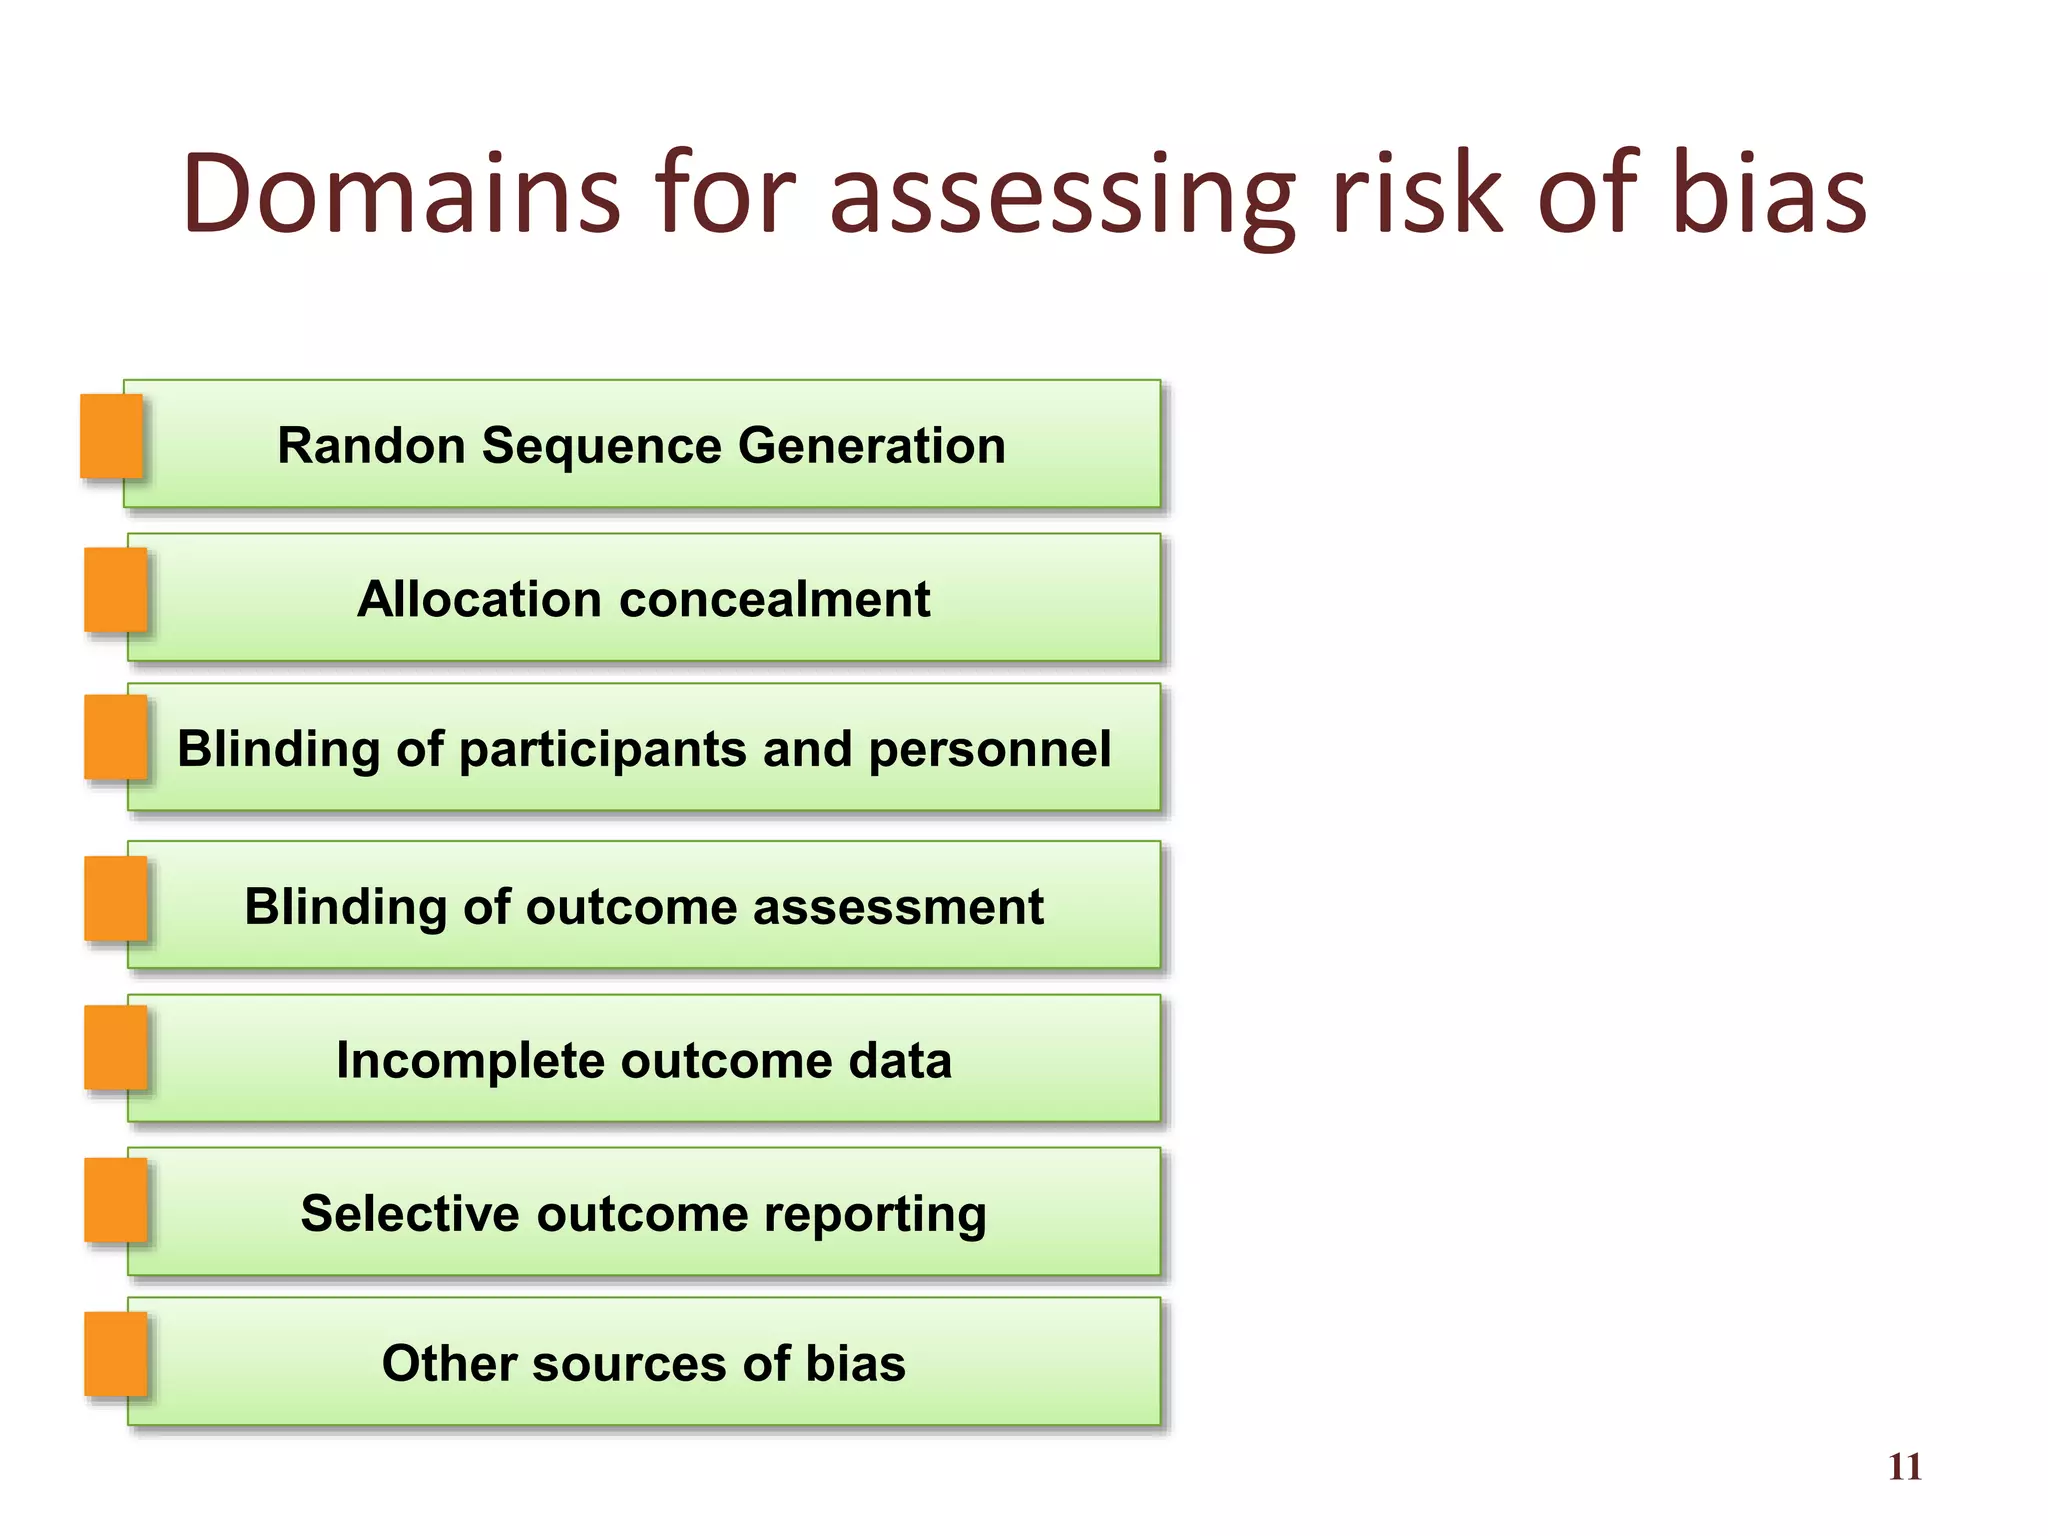
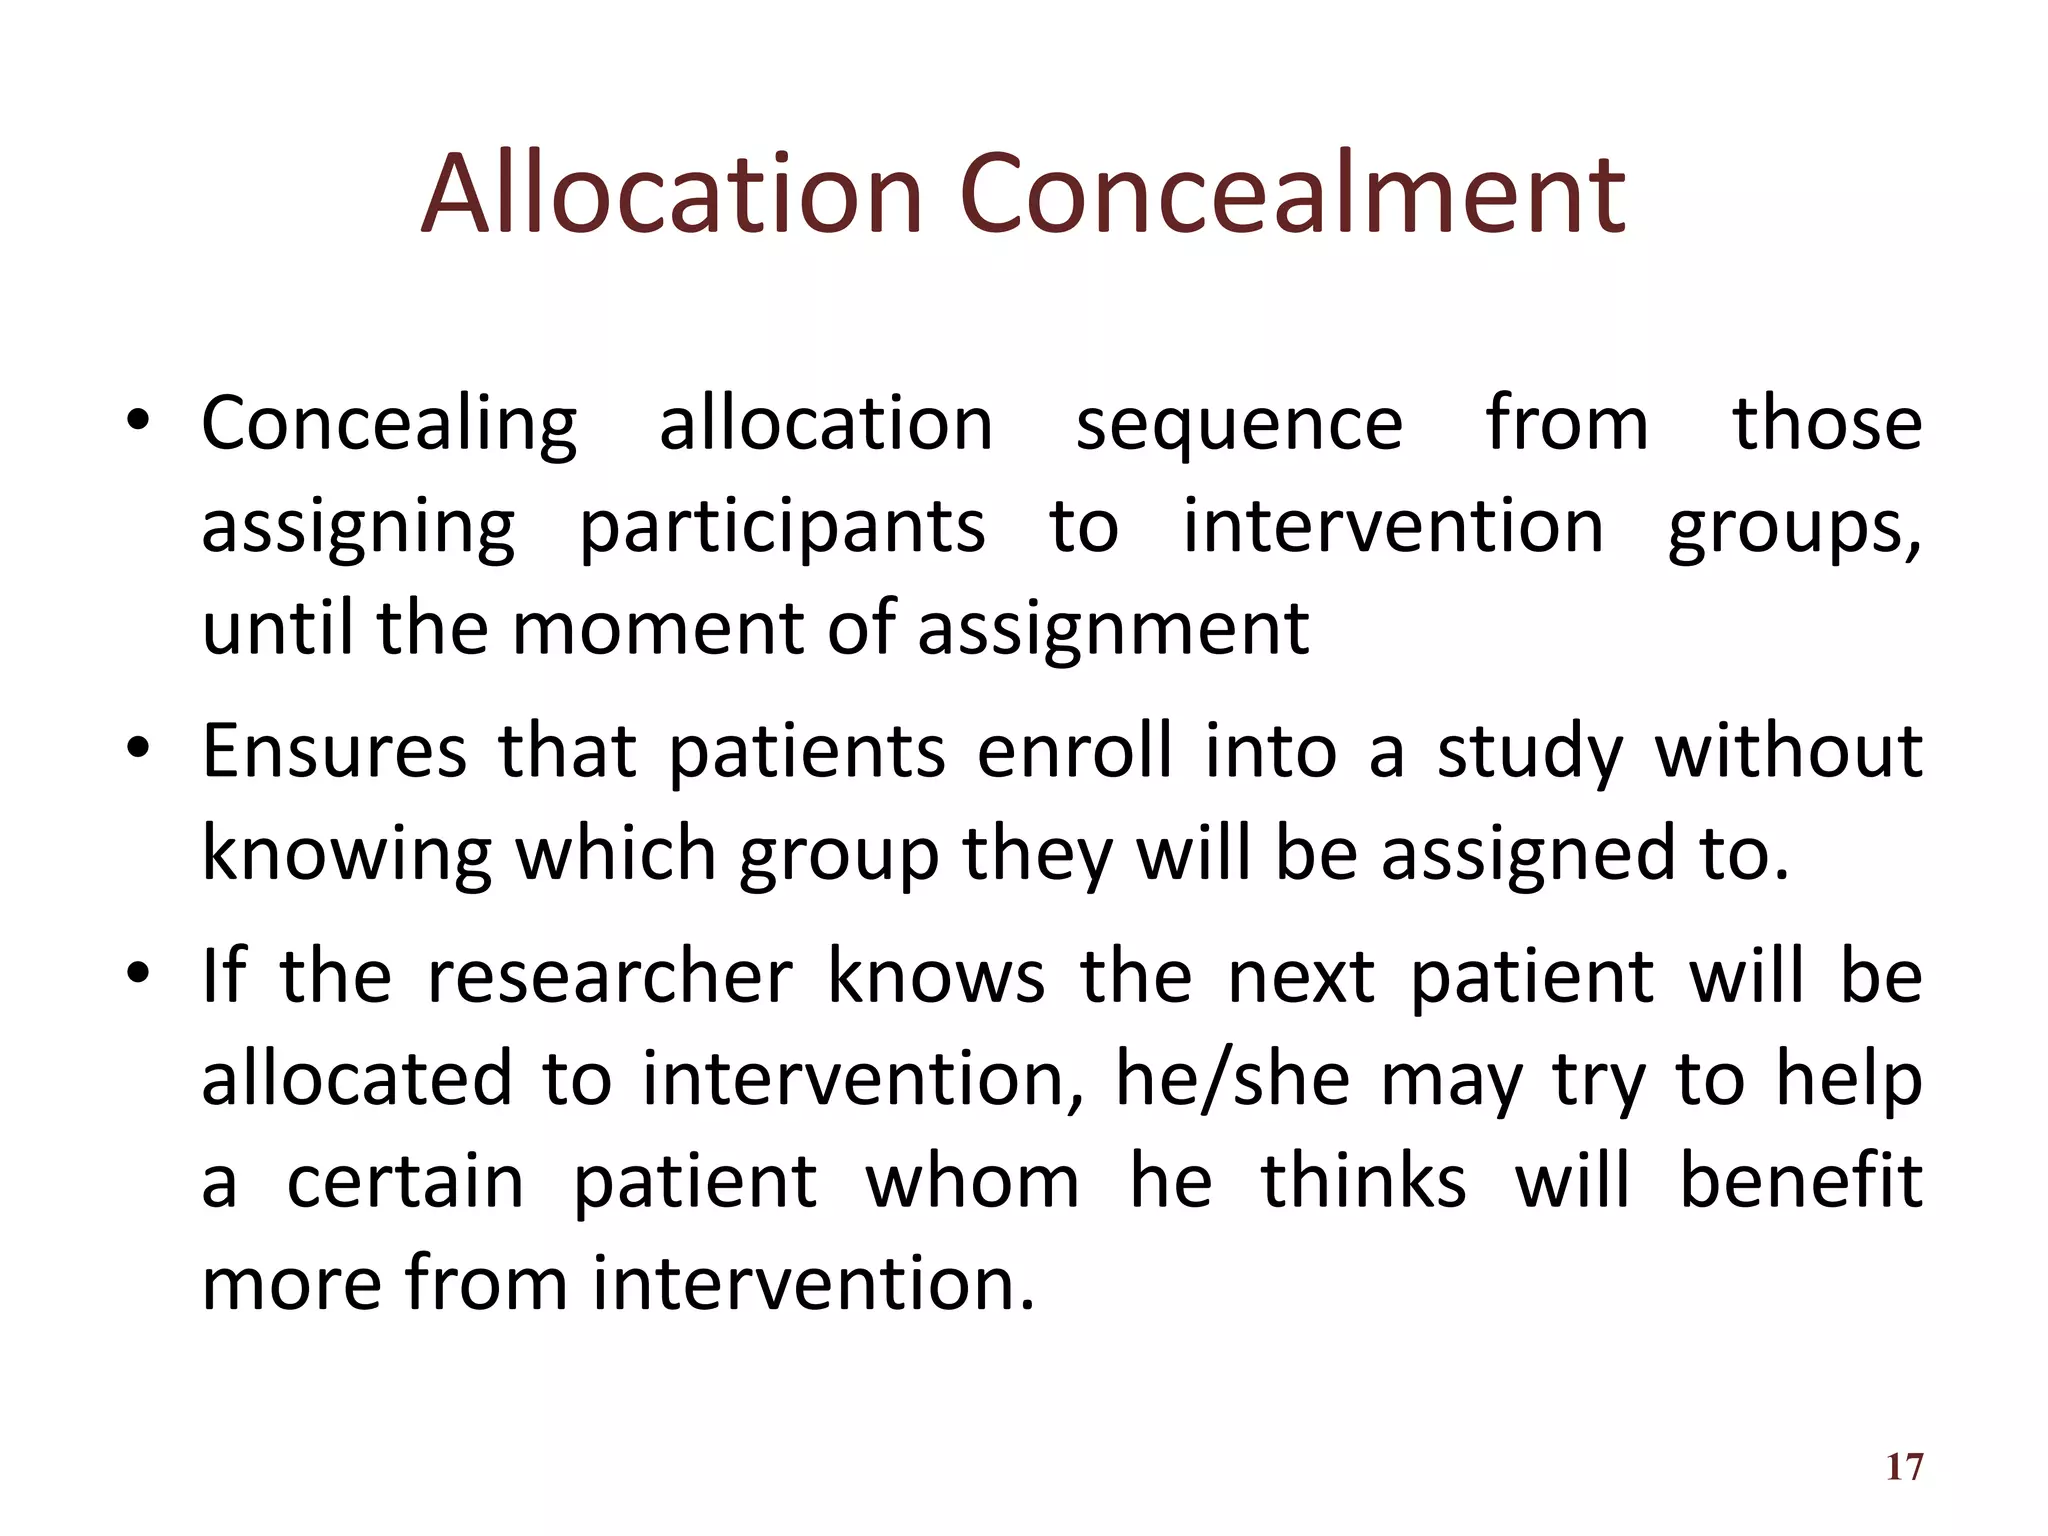
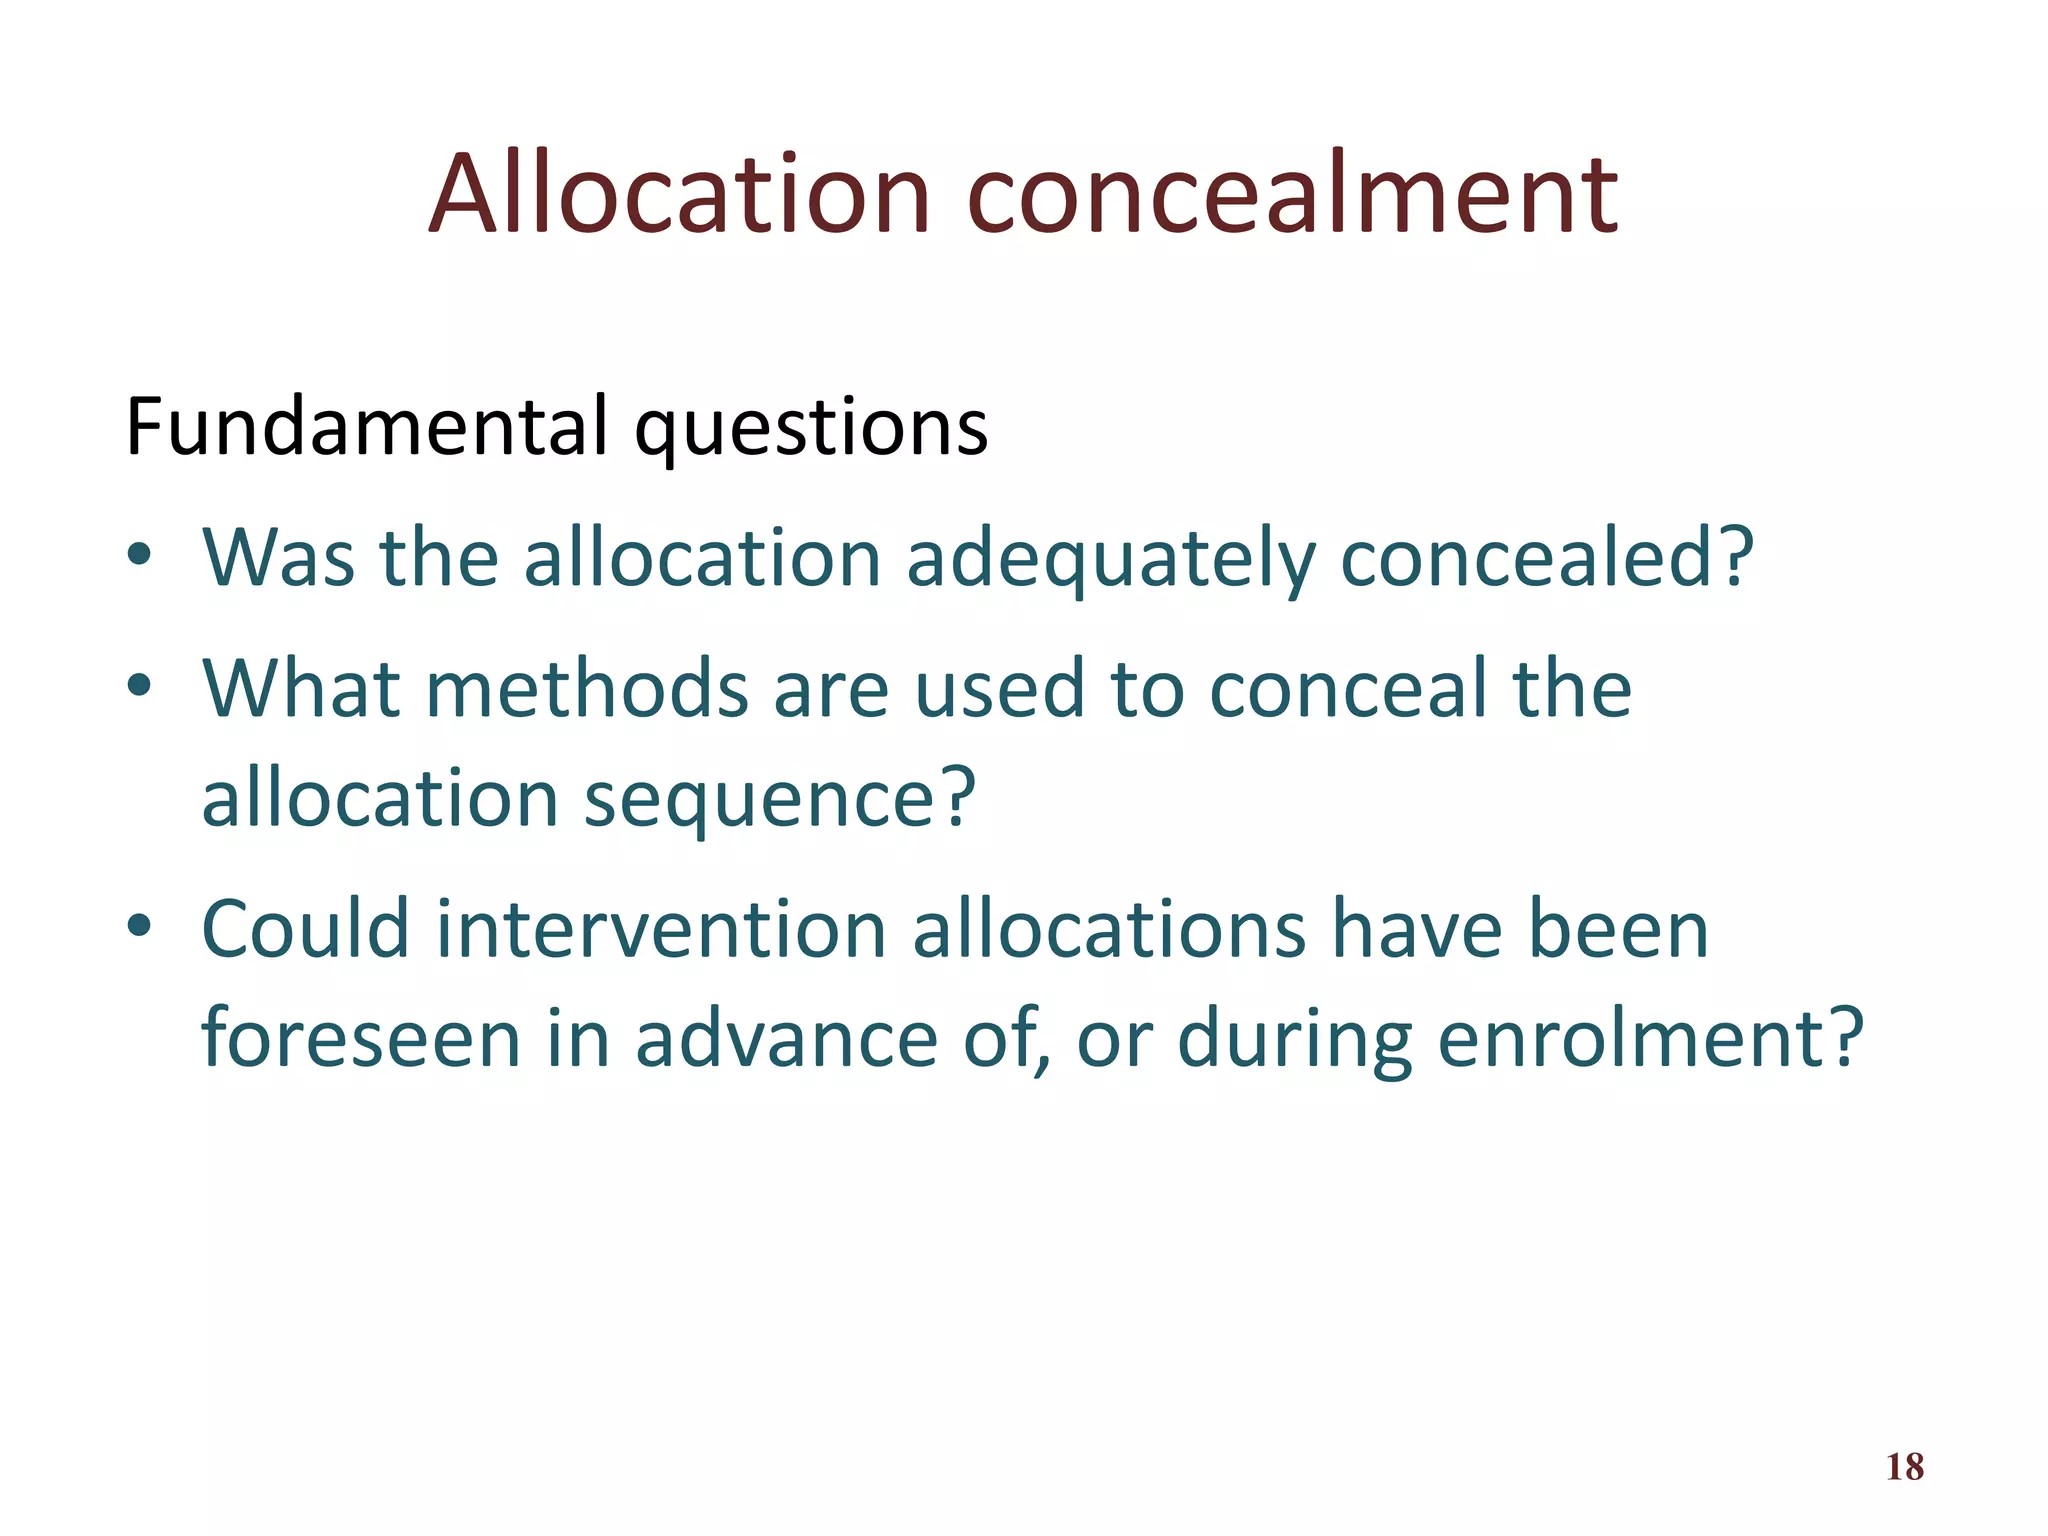
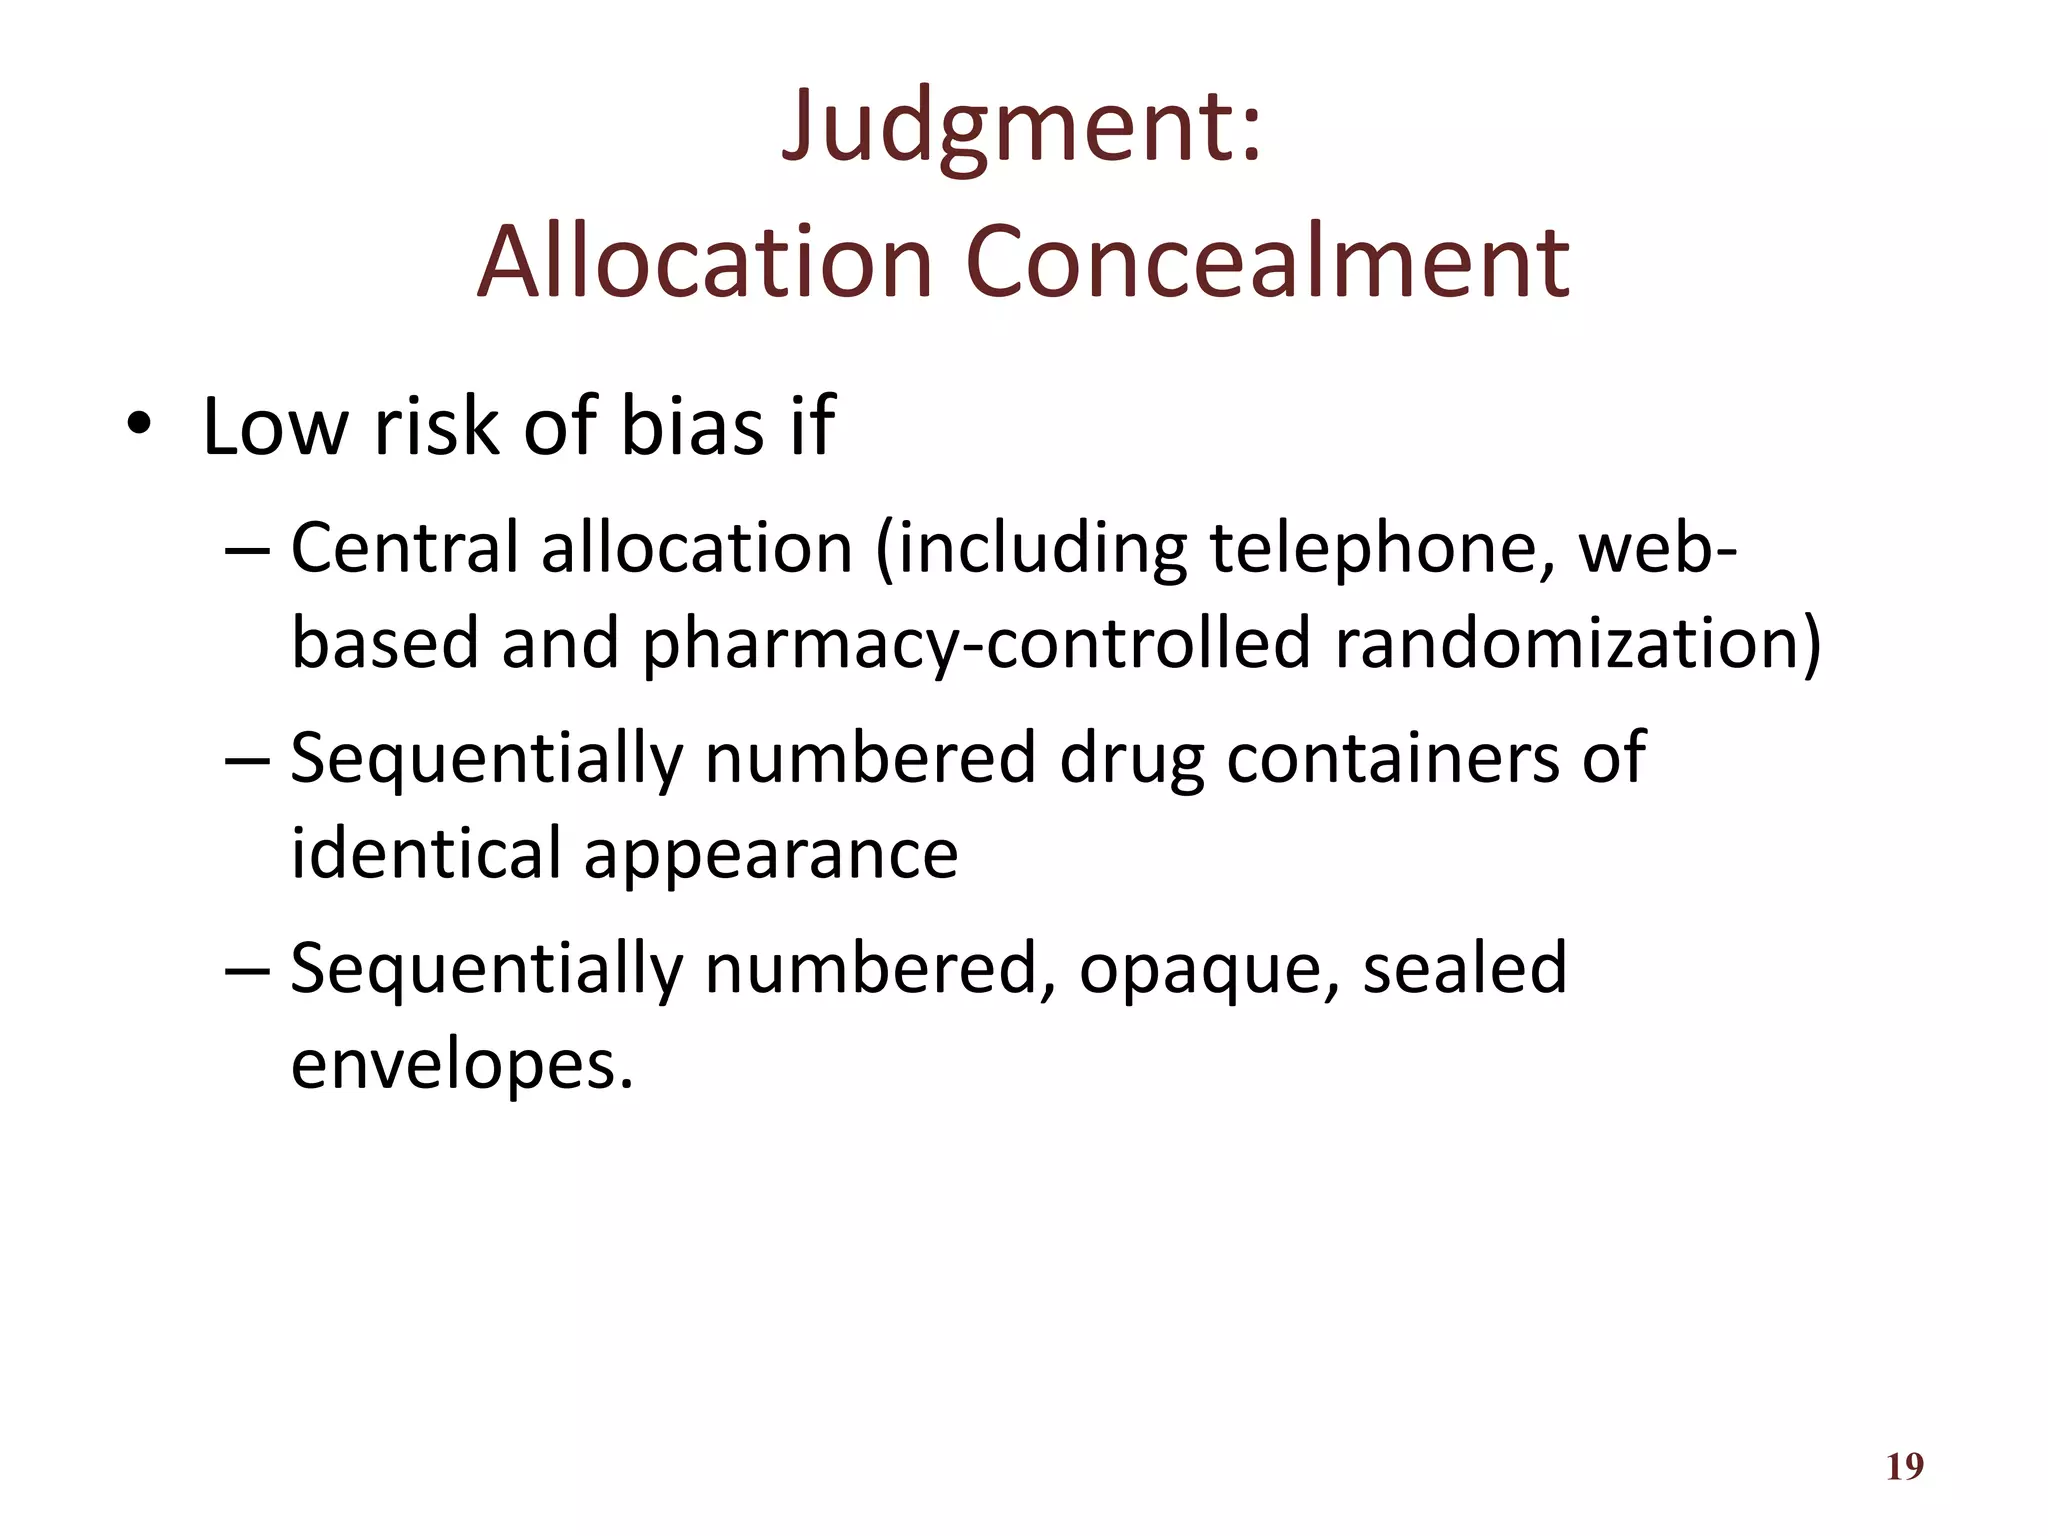
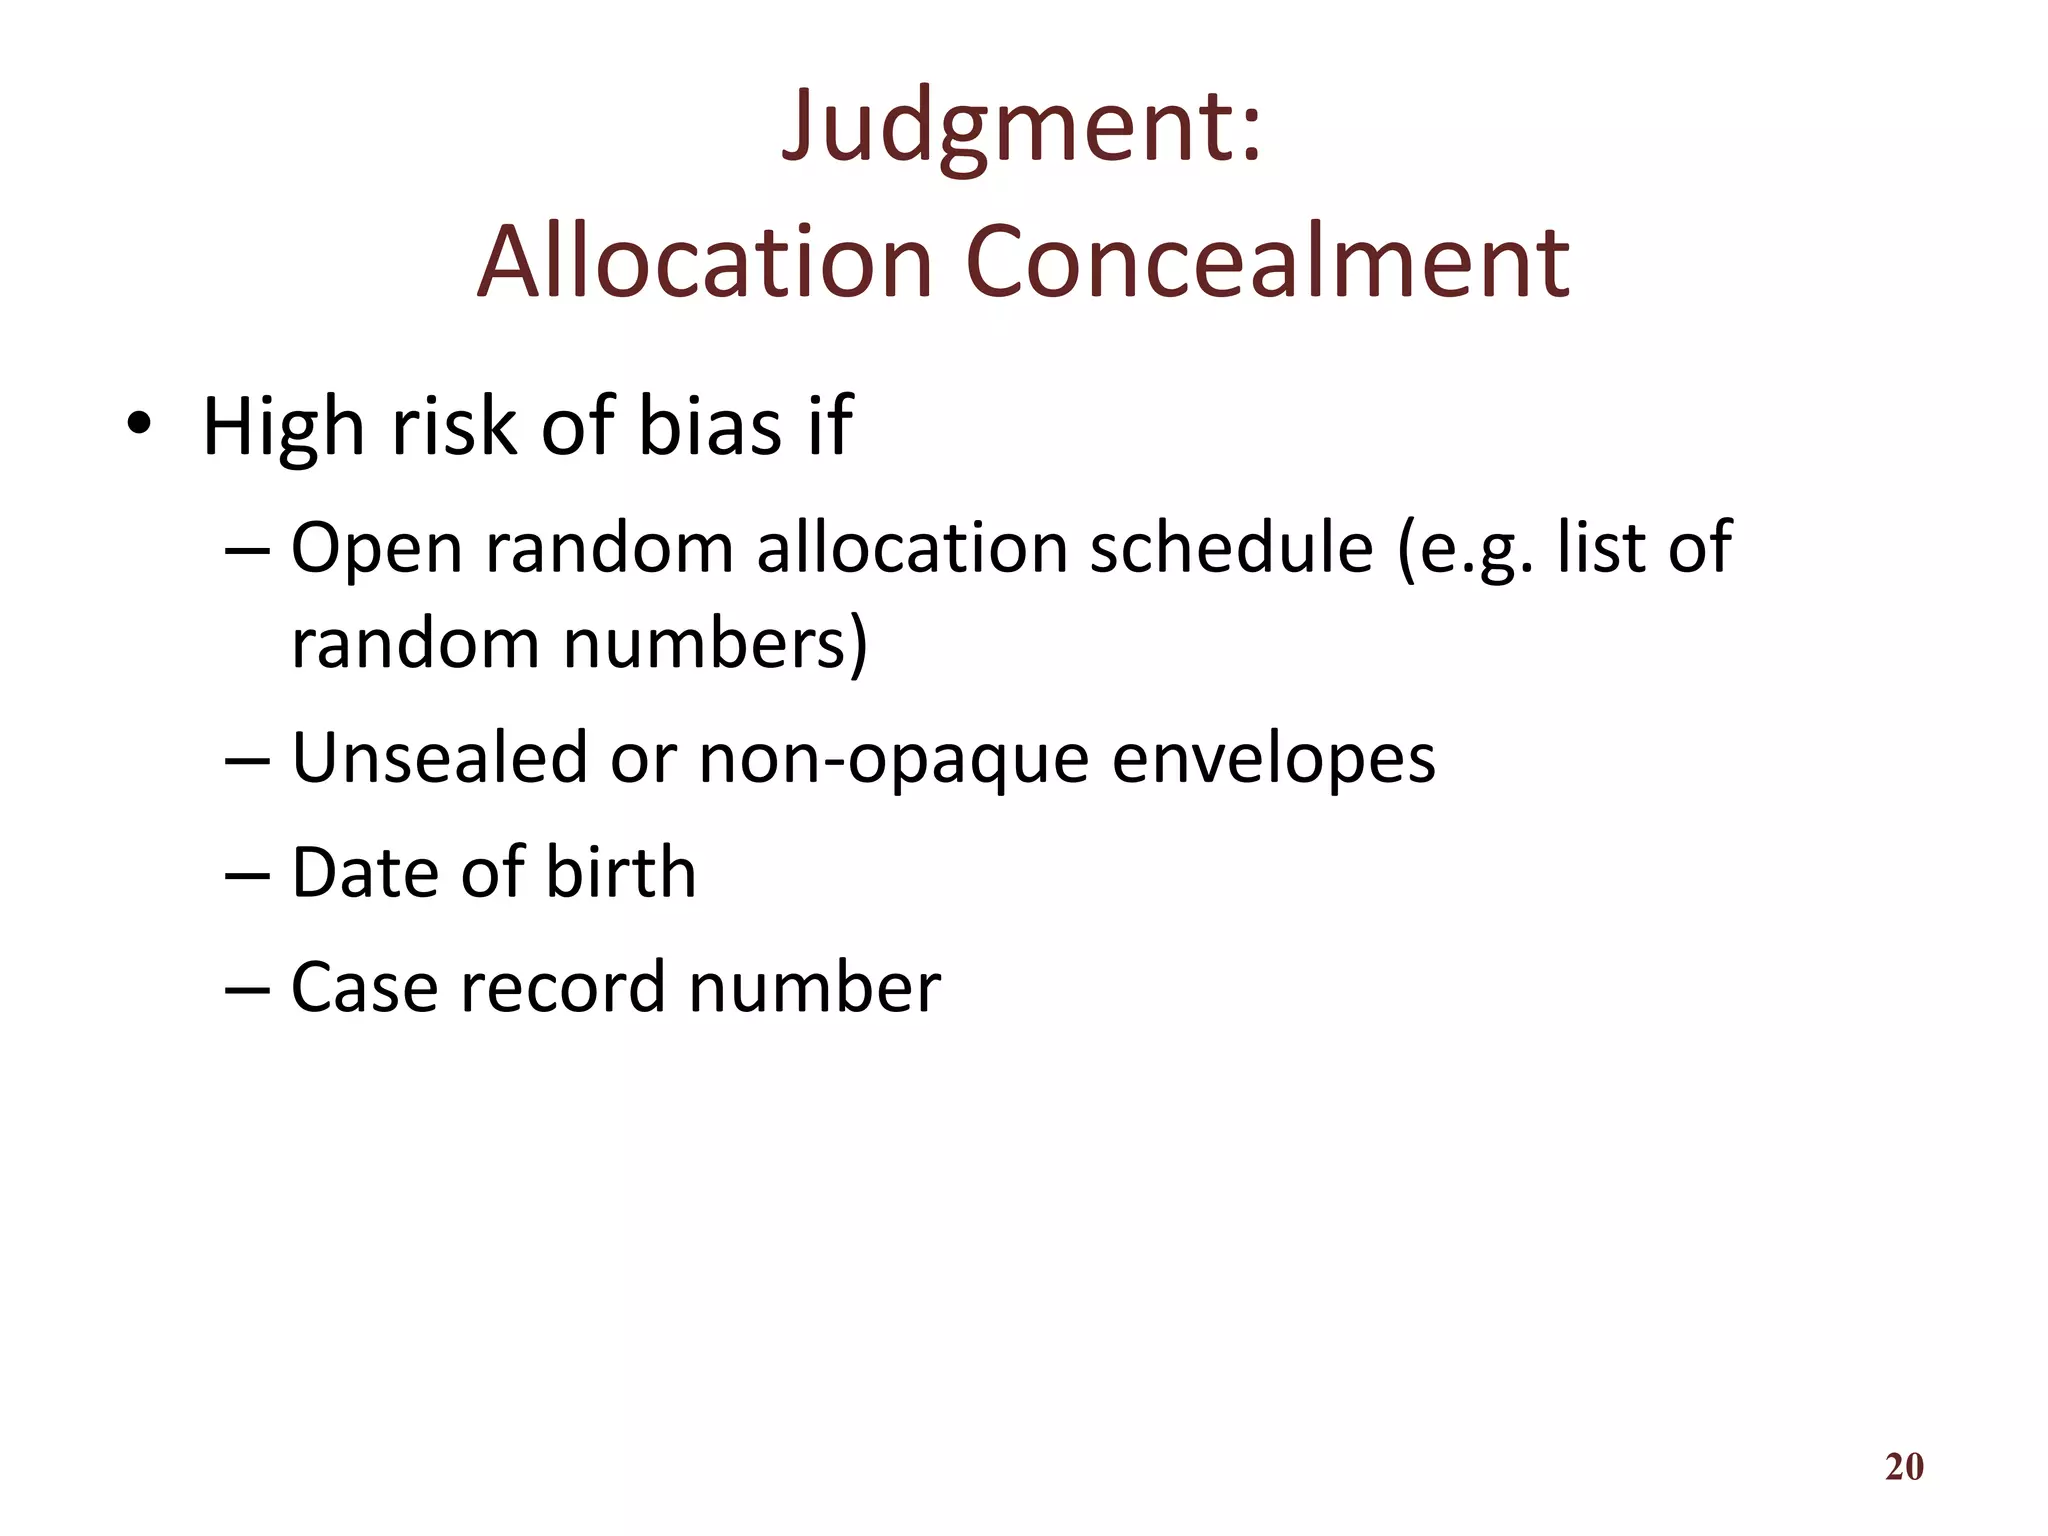
Strategies for assessing risk of bias including random sequence generation and allocation concealment.
The importance of blinding participants and assessors in studies to avoid performance and detection biases.
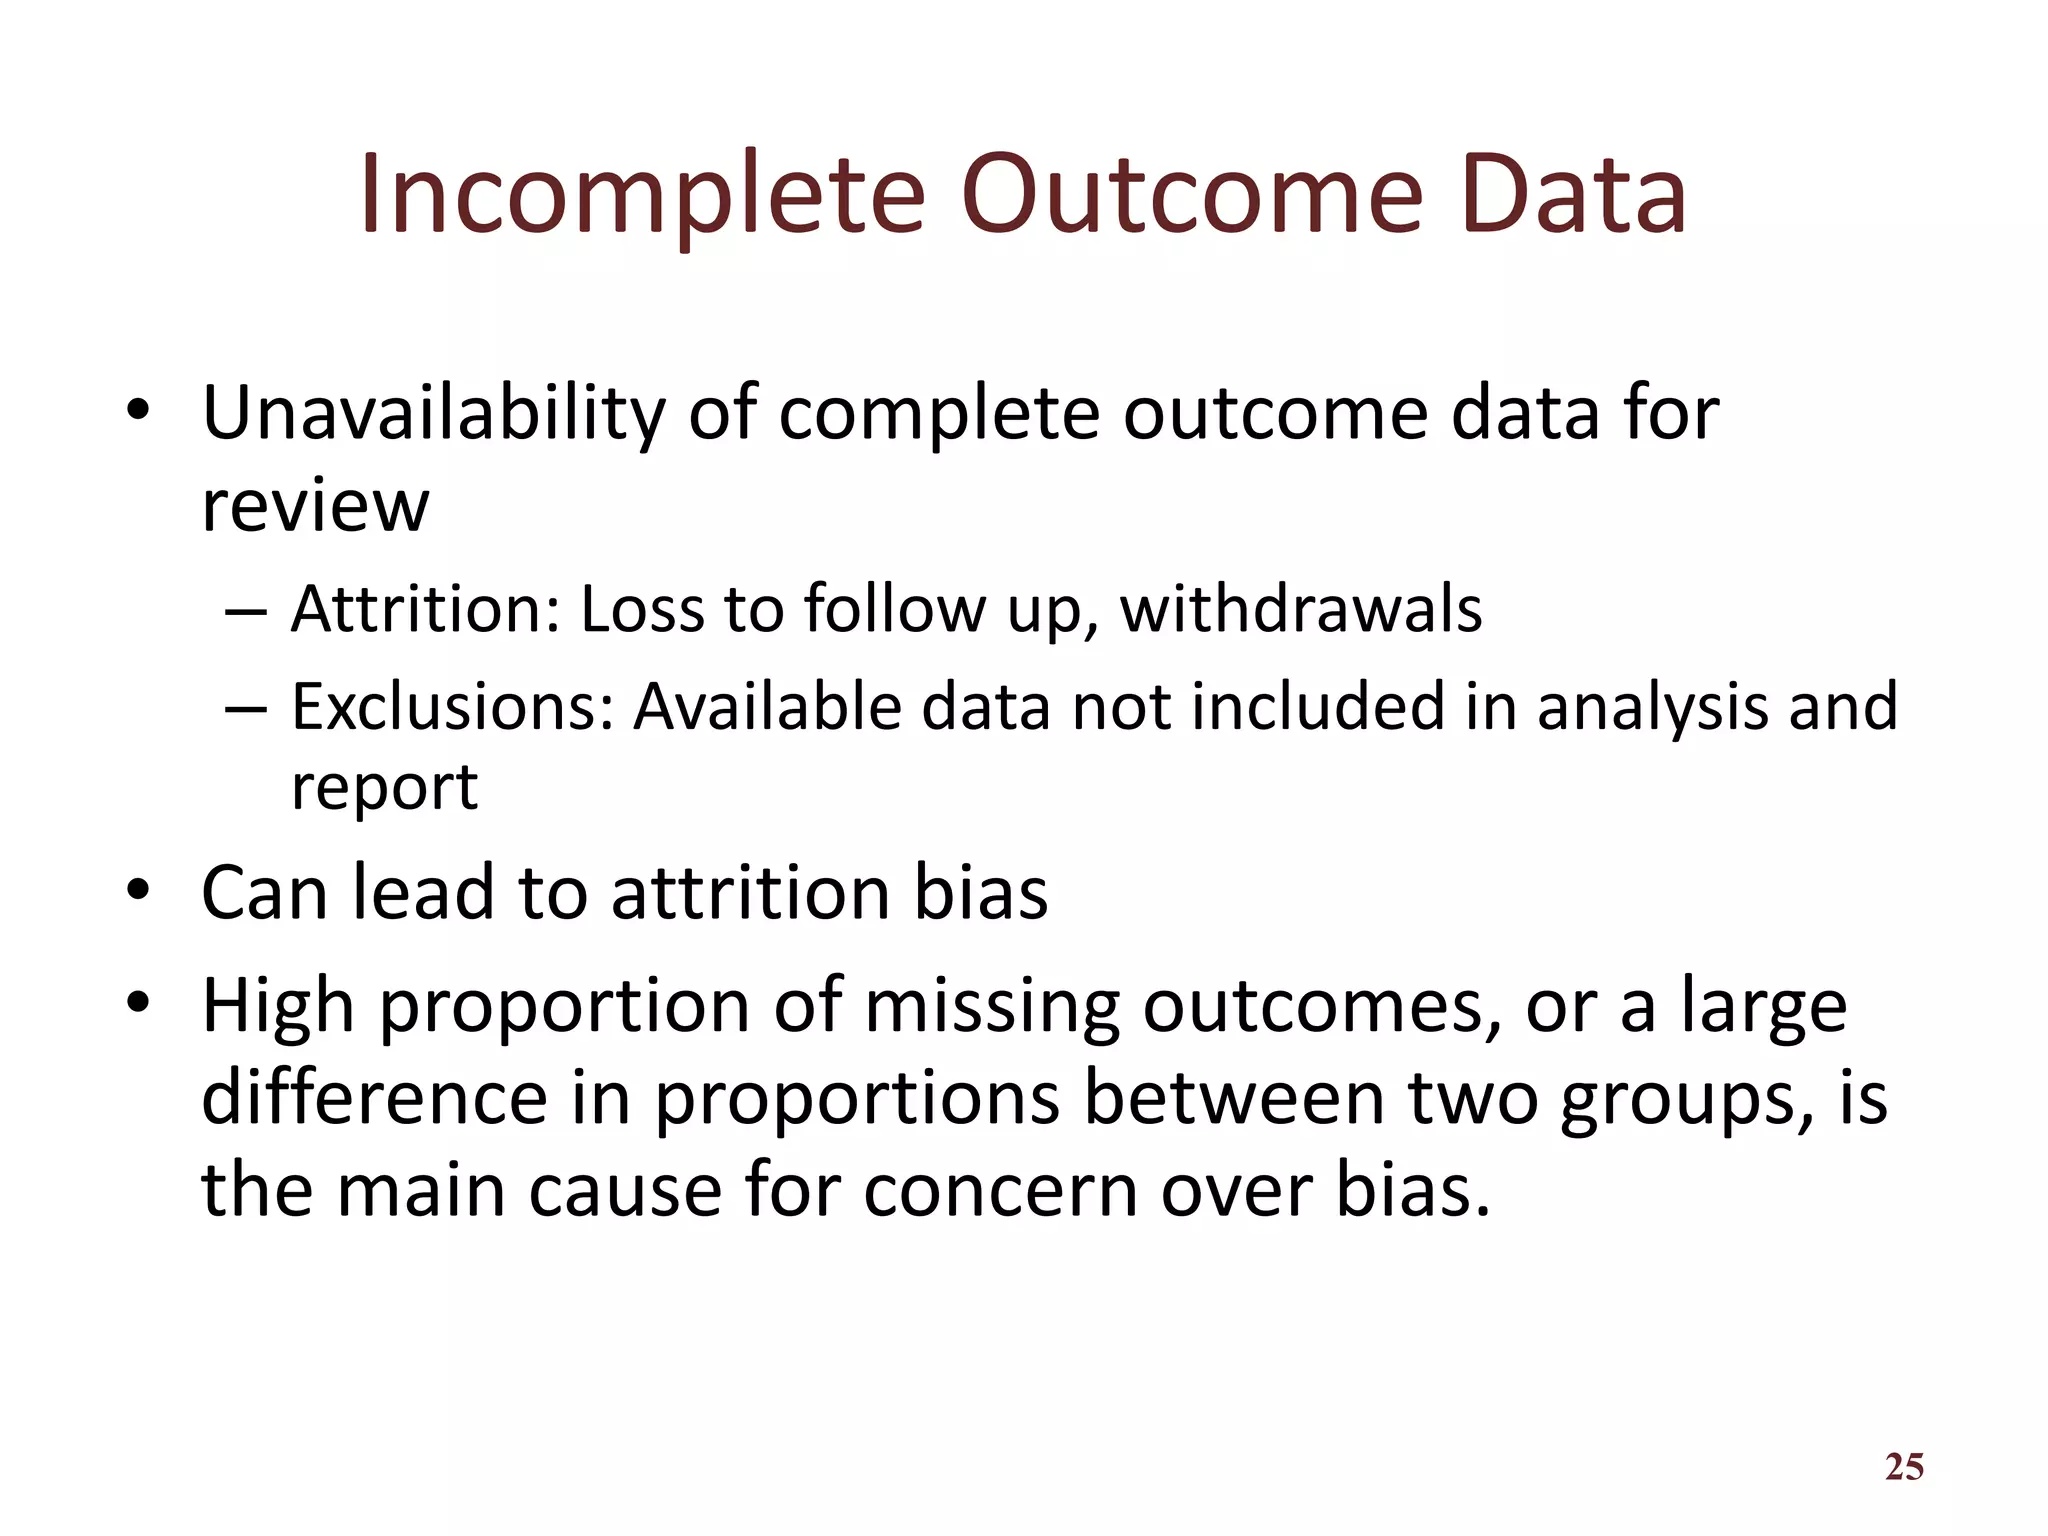
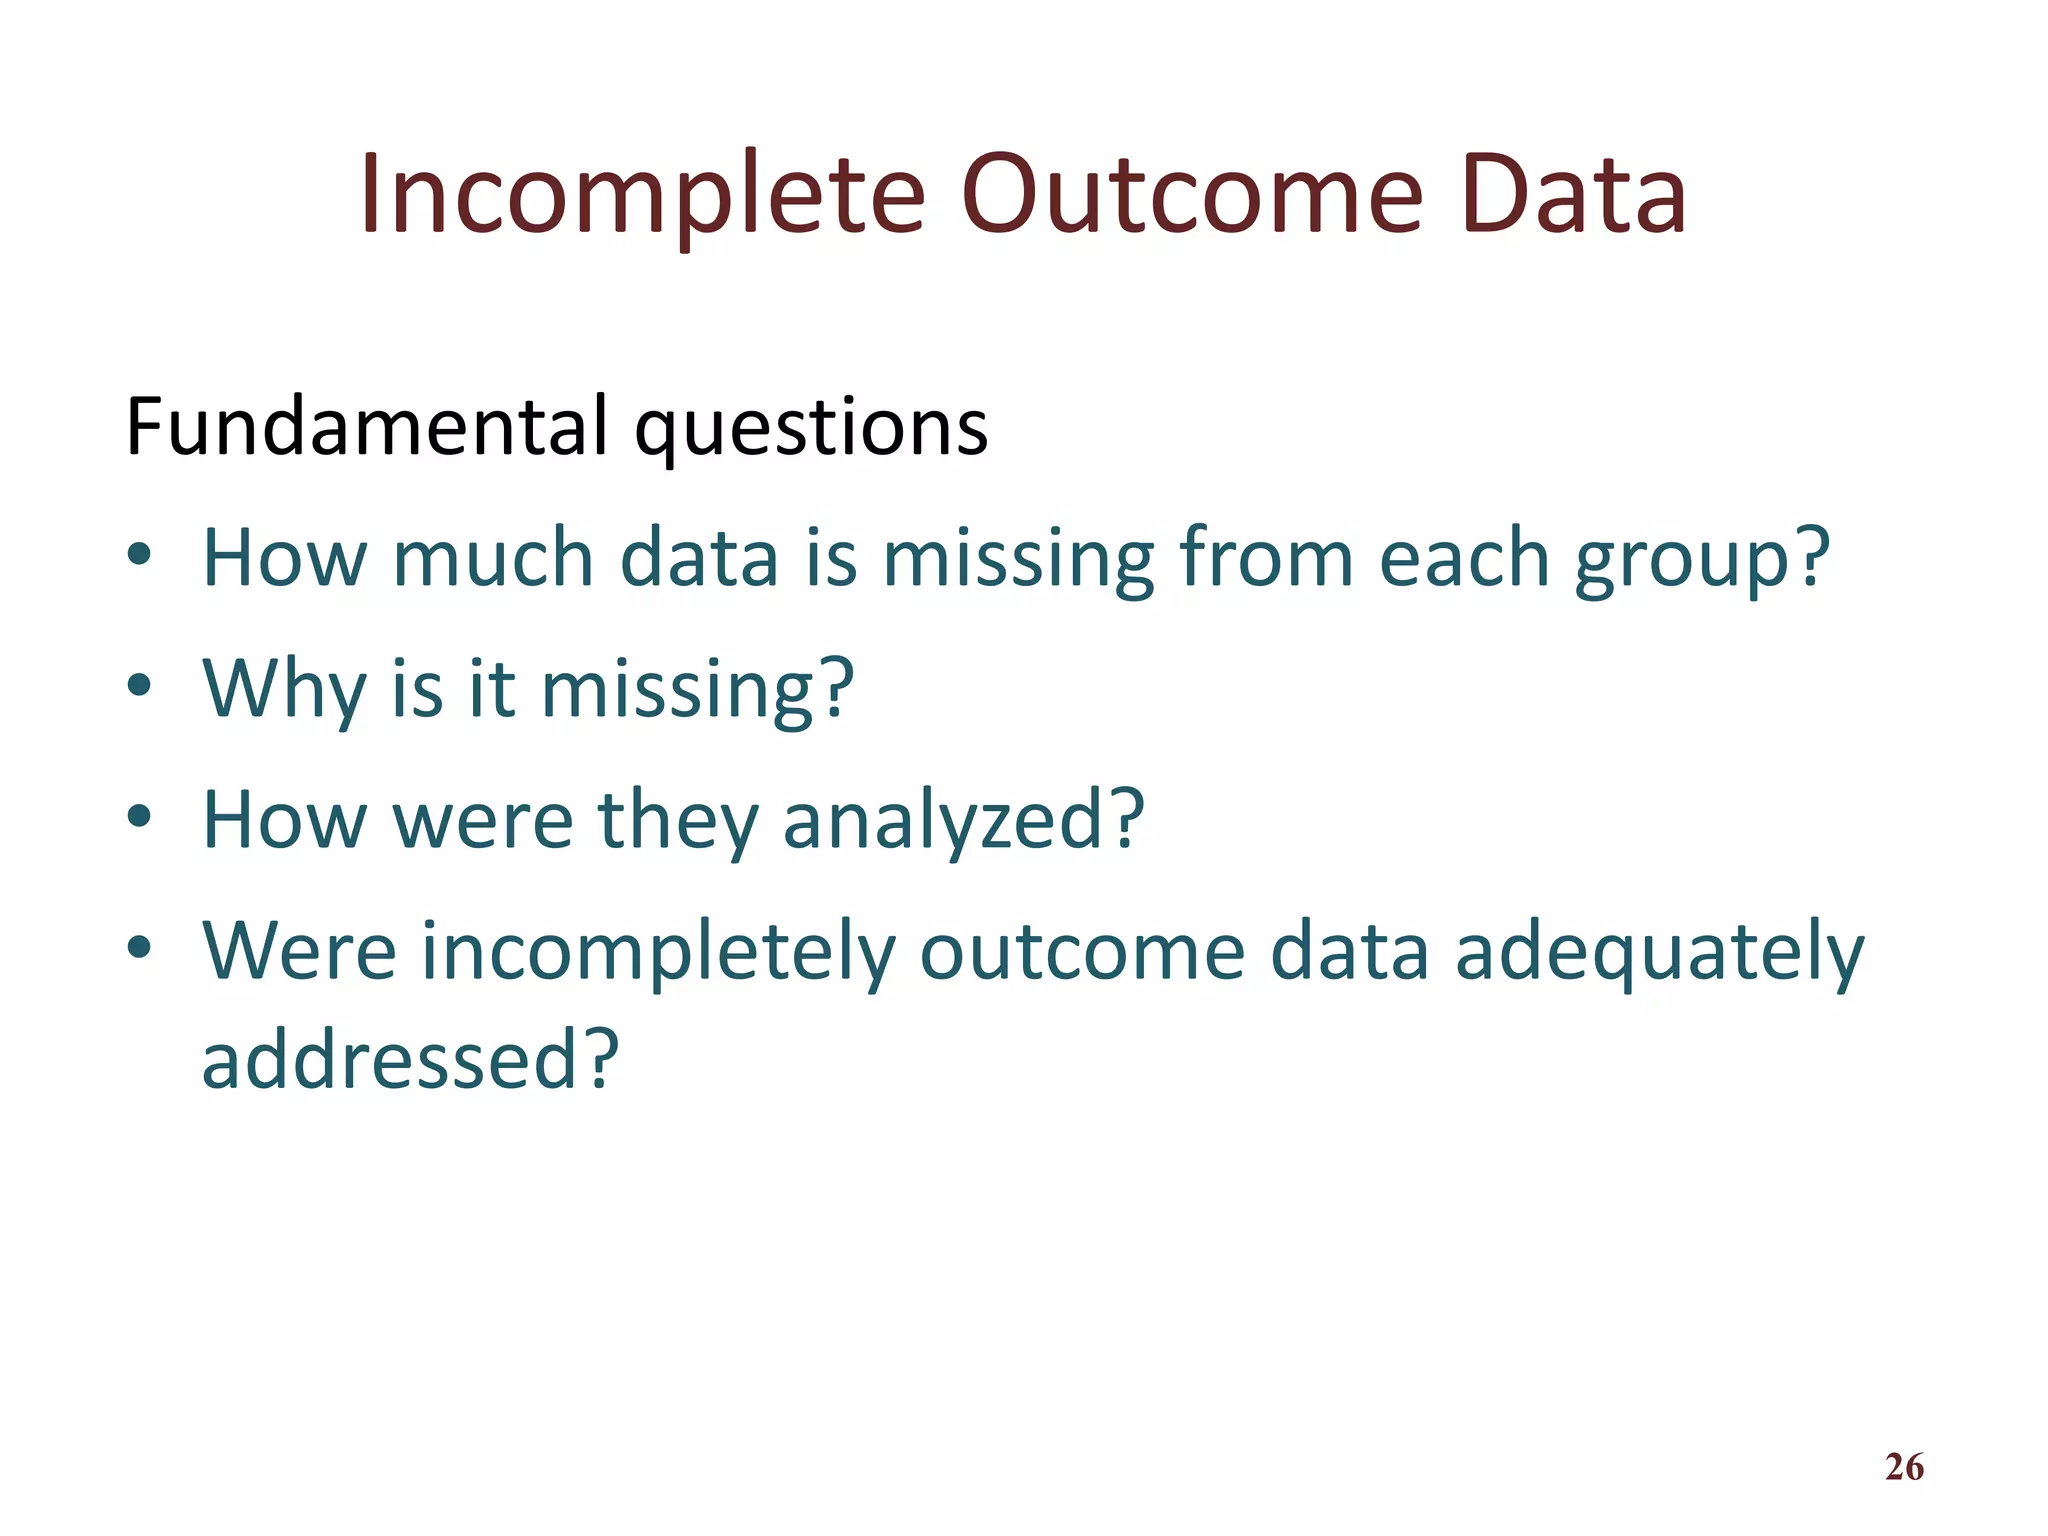
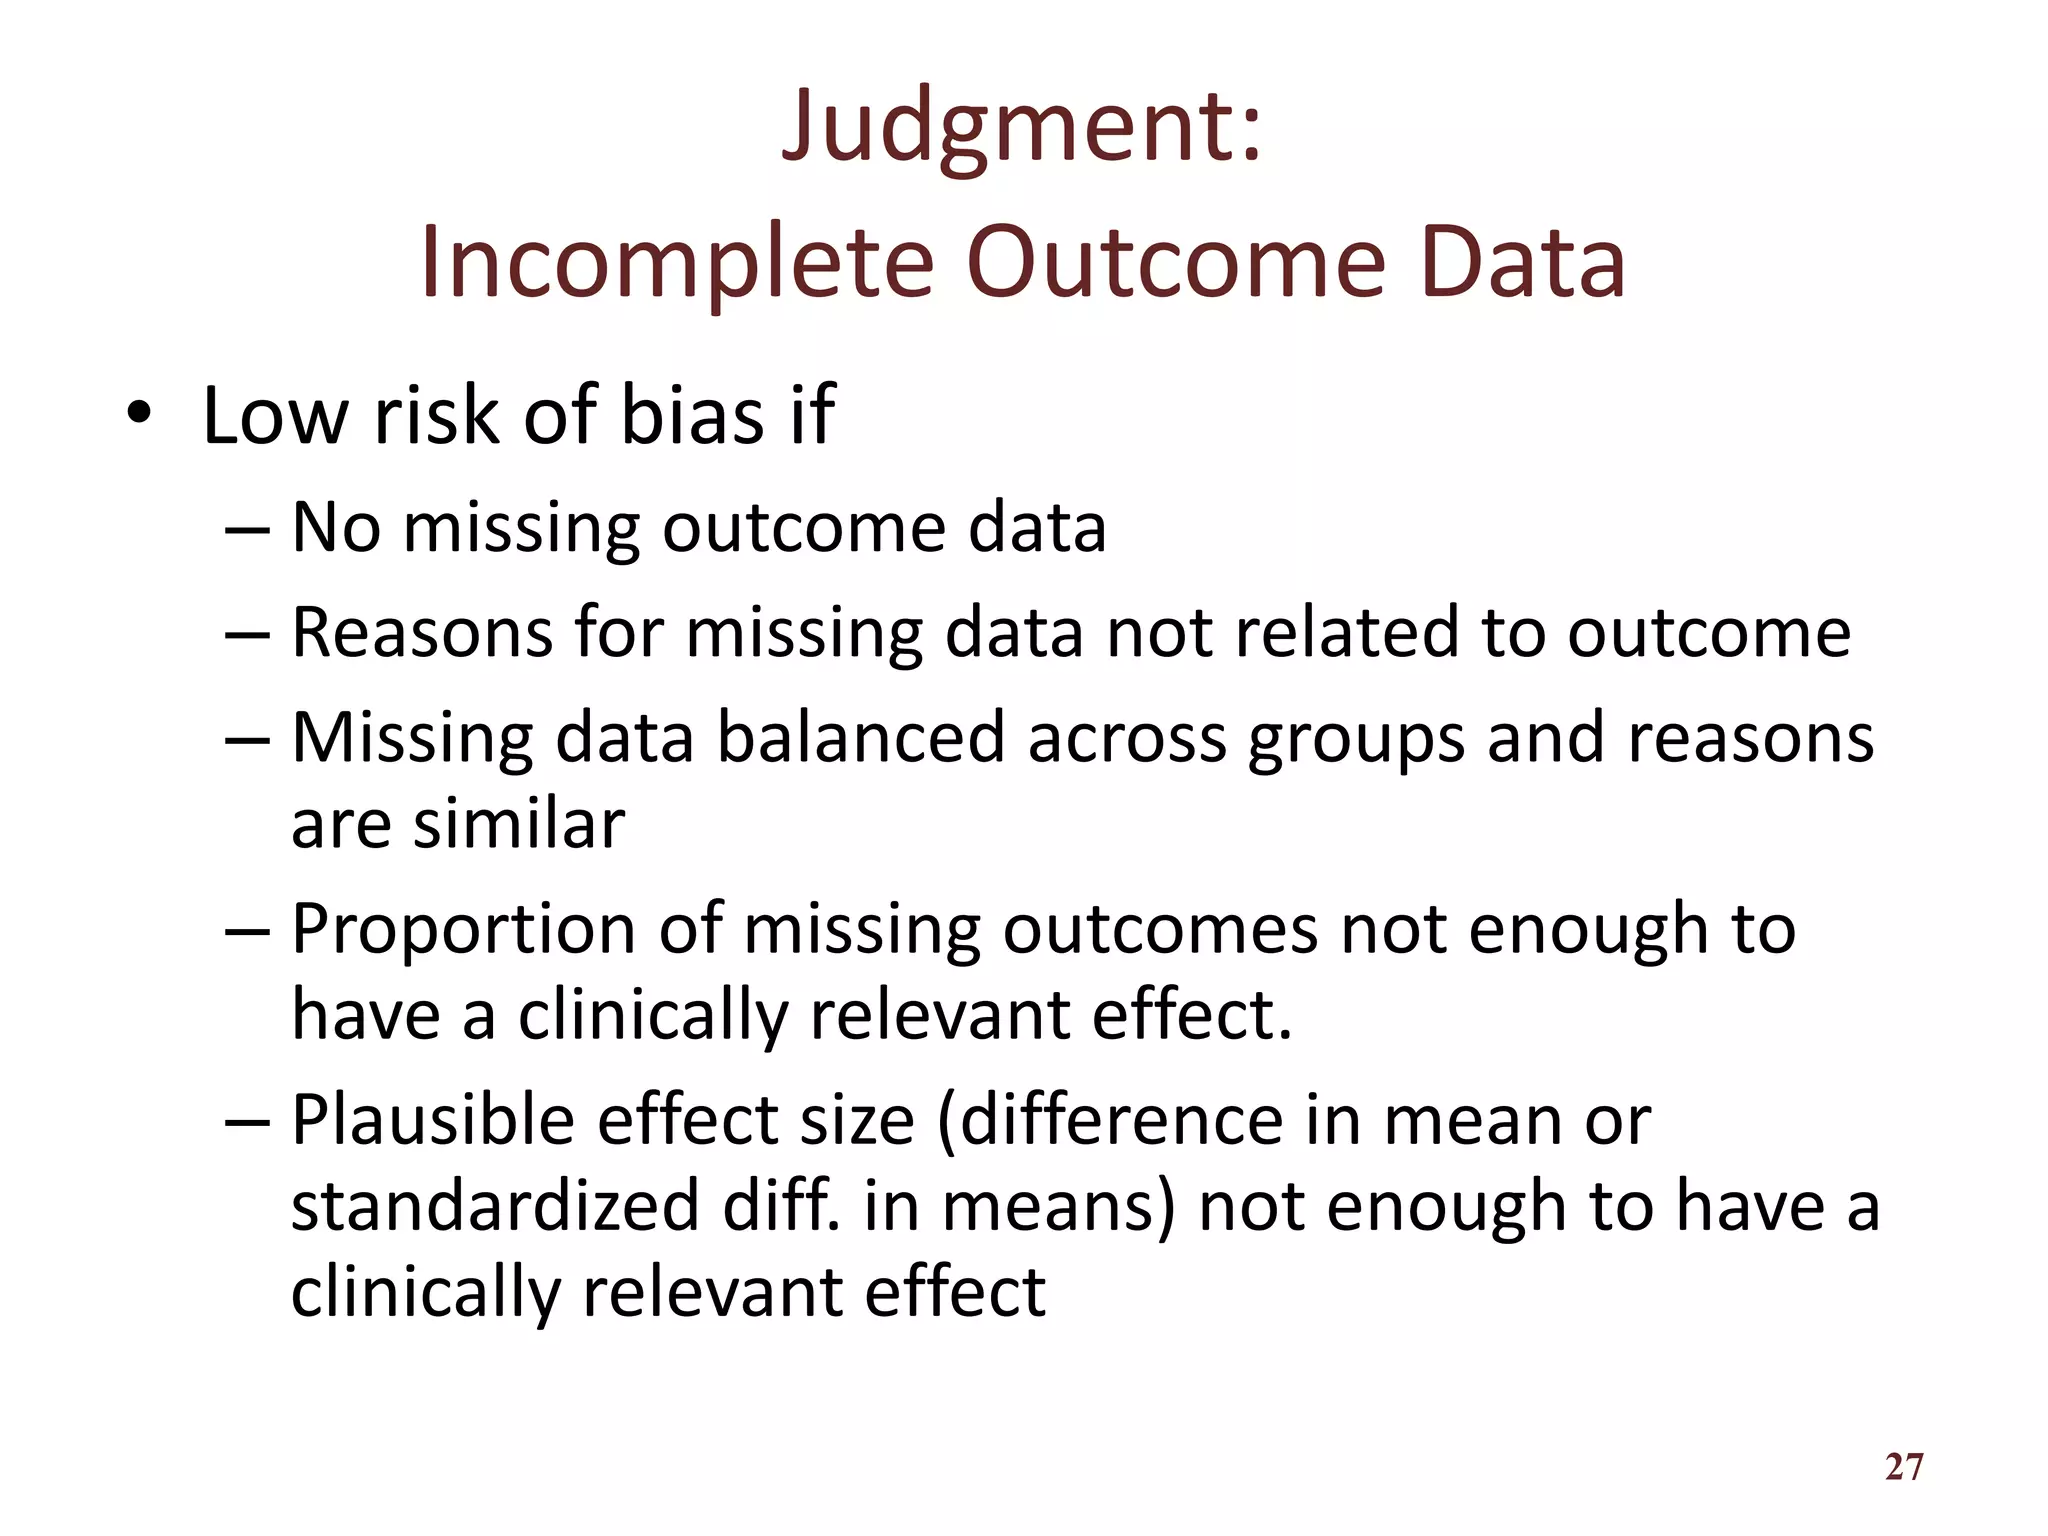
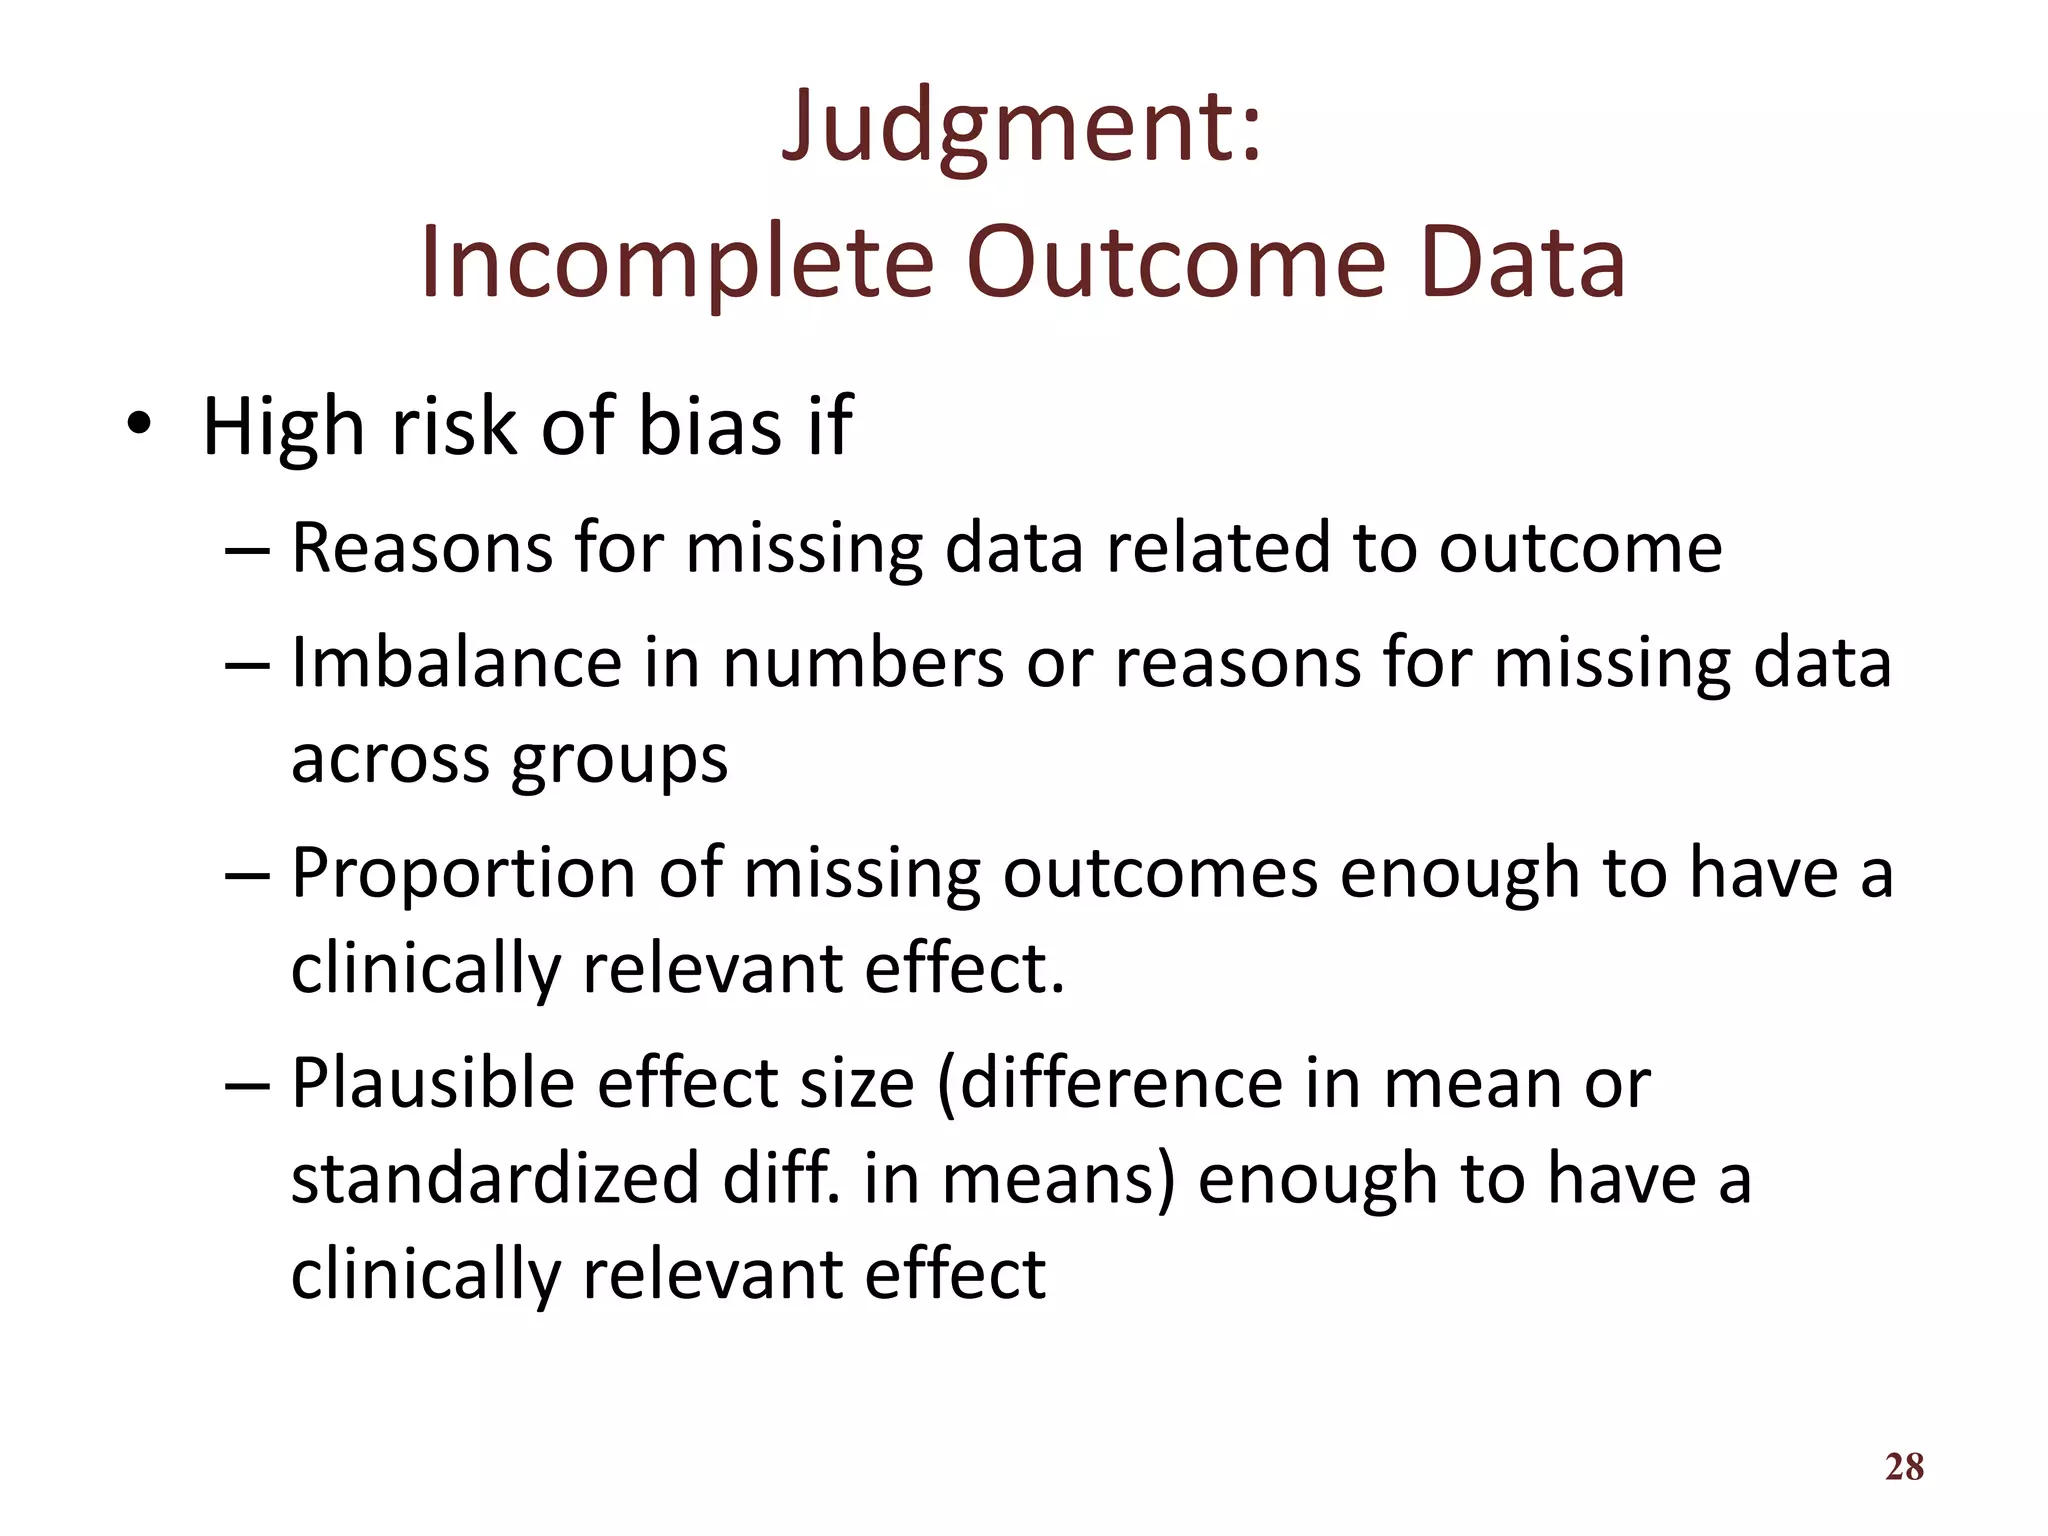
Risks associated with incomplete outcome data and assessment criteria for bias assessment.
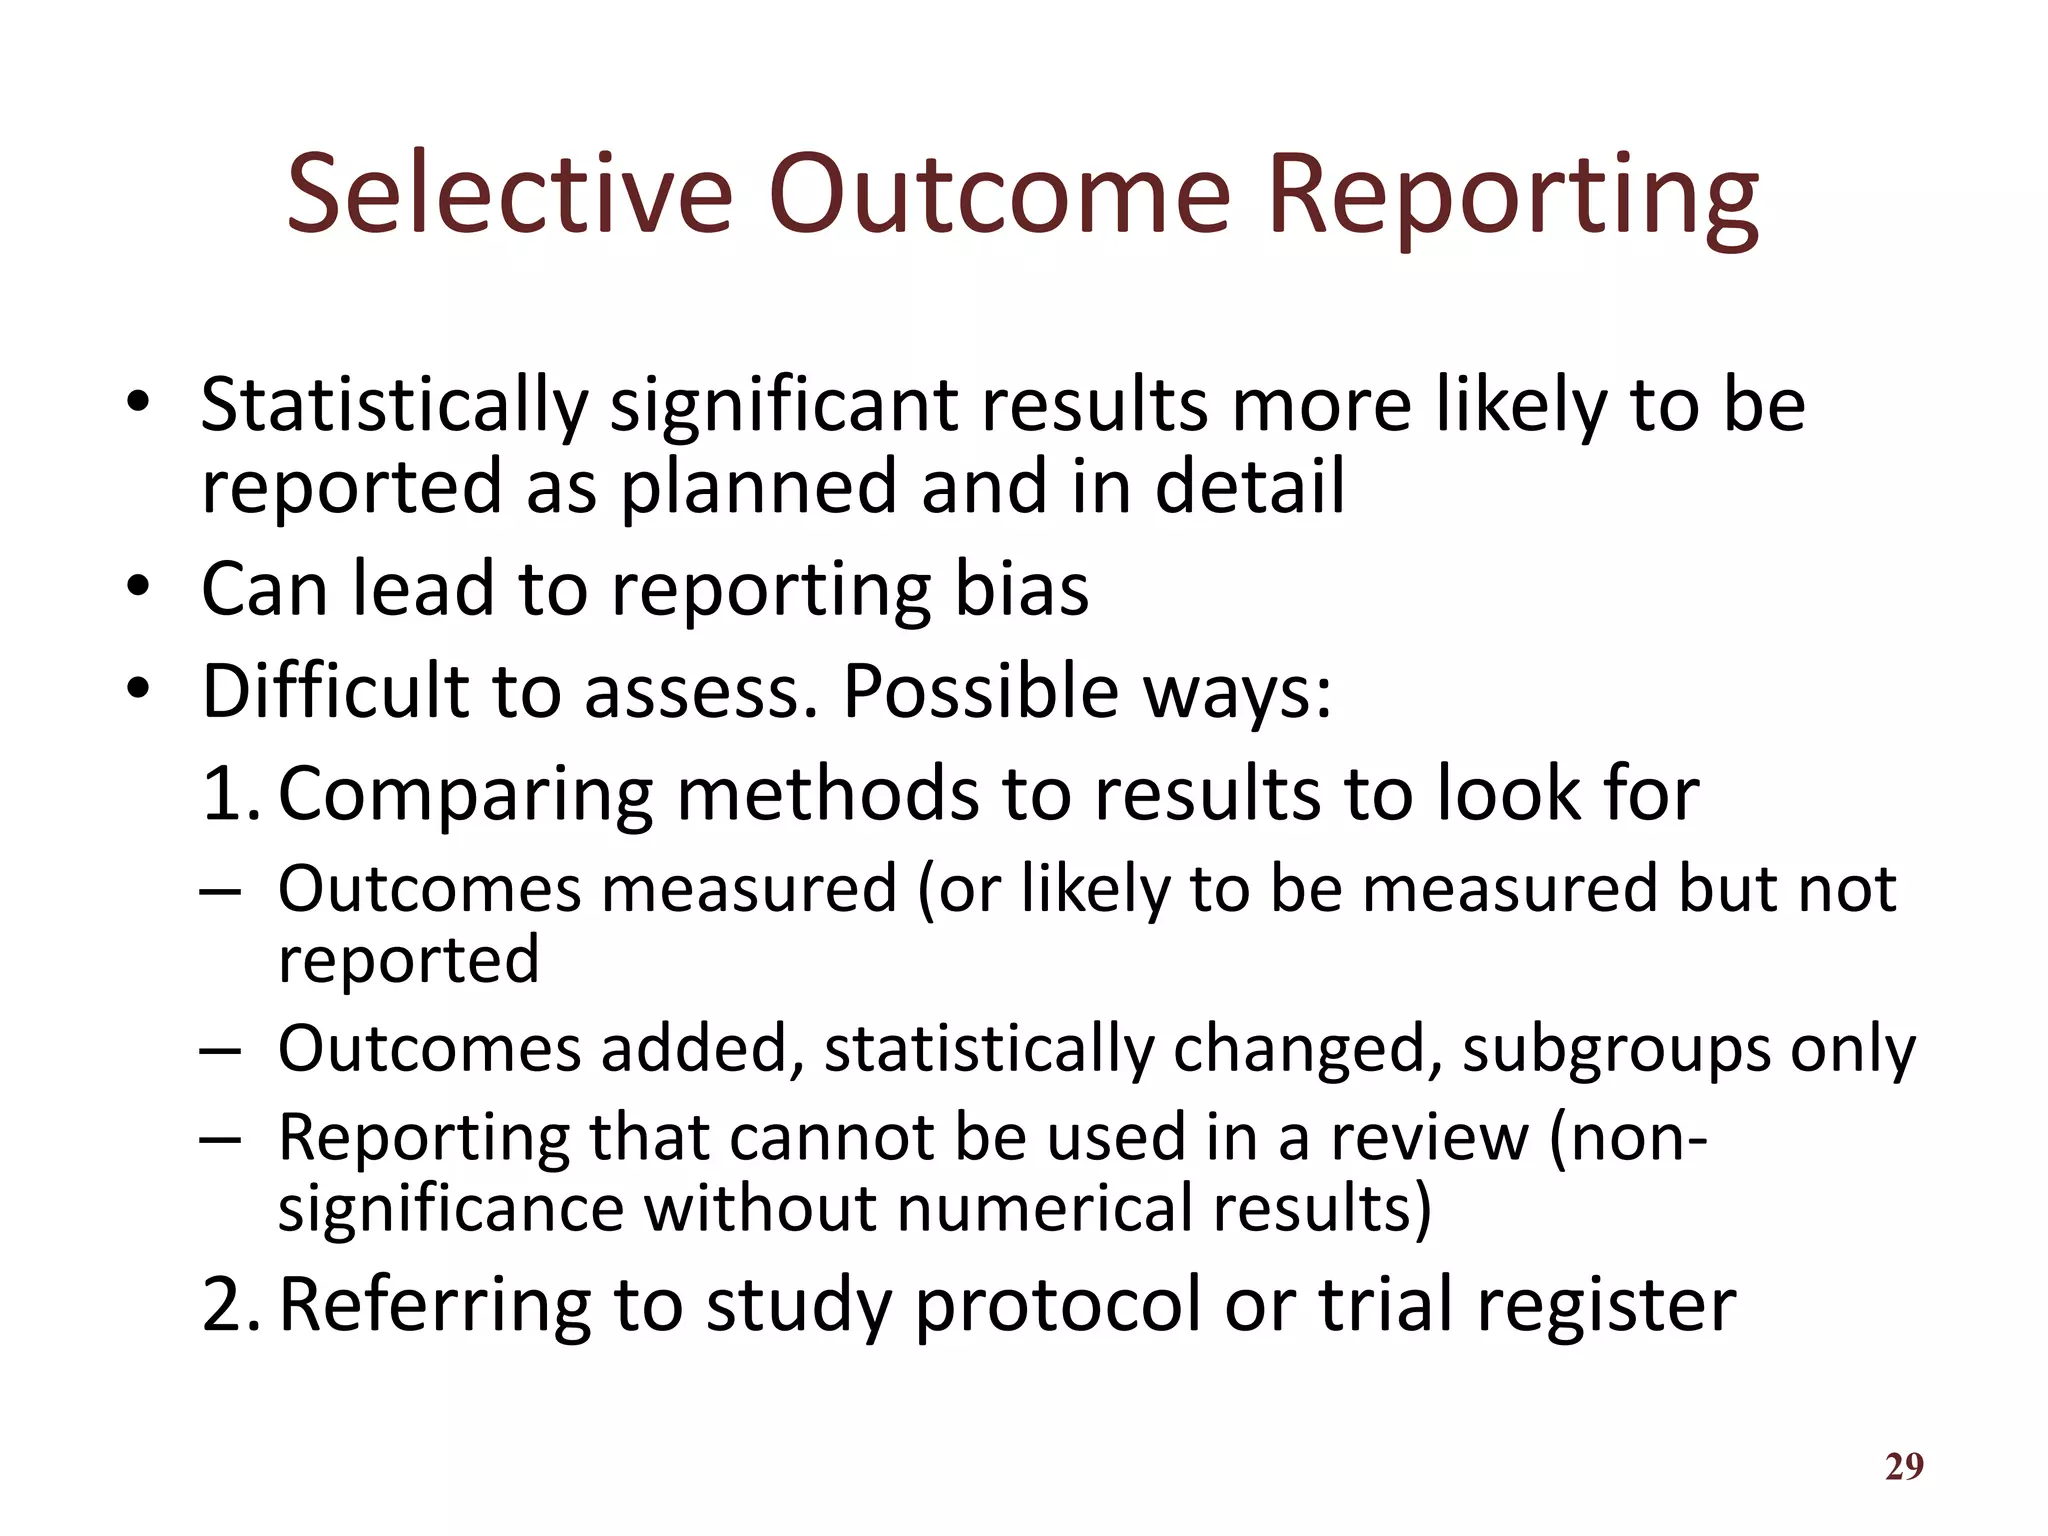
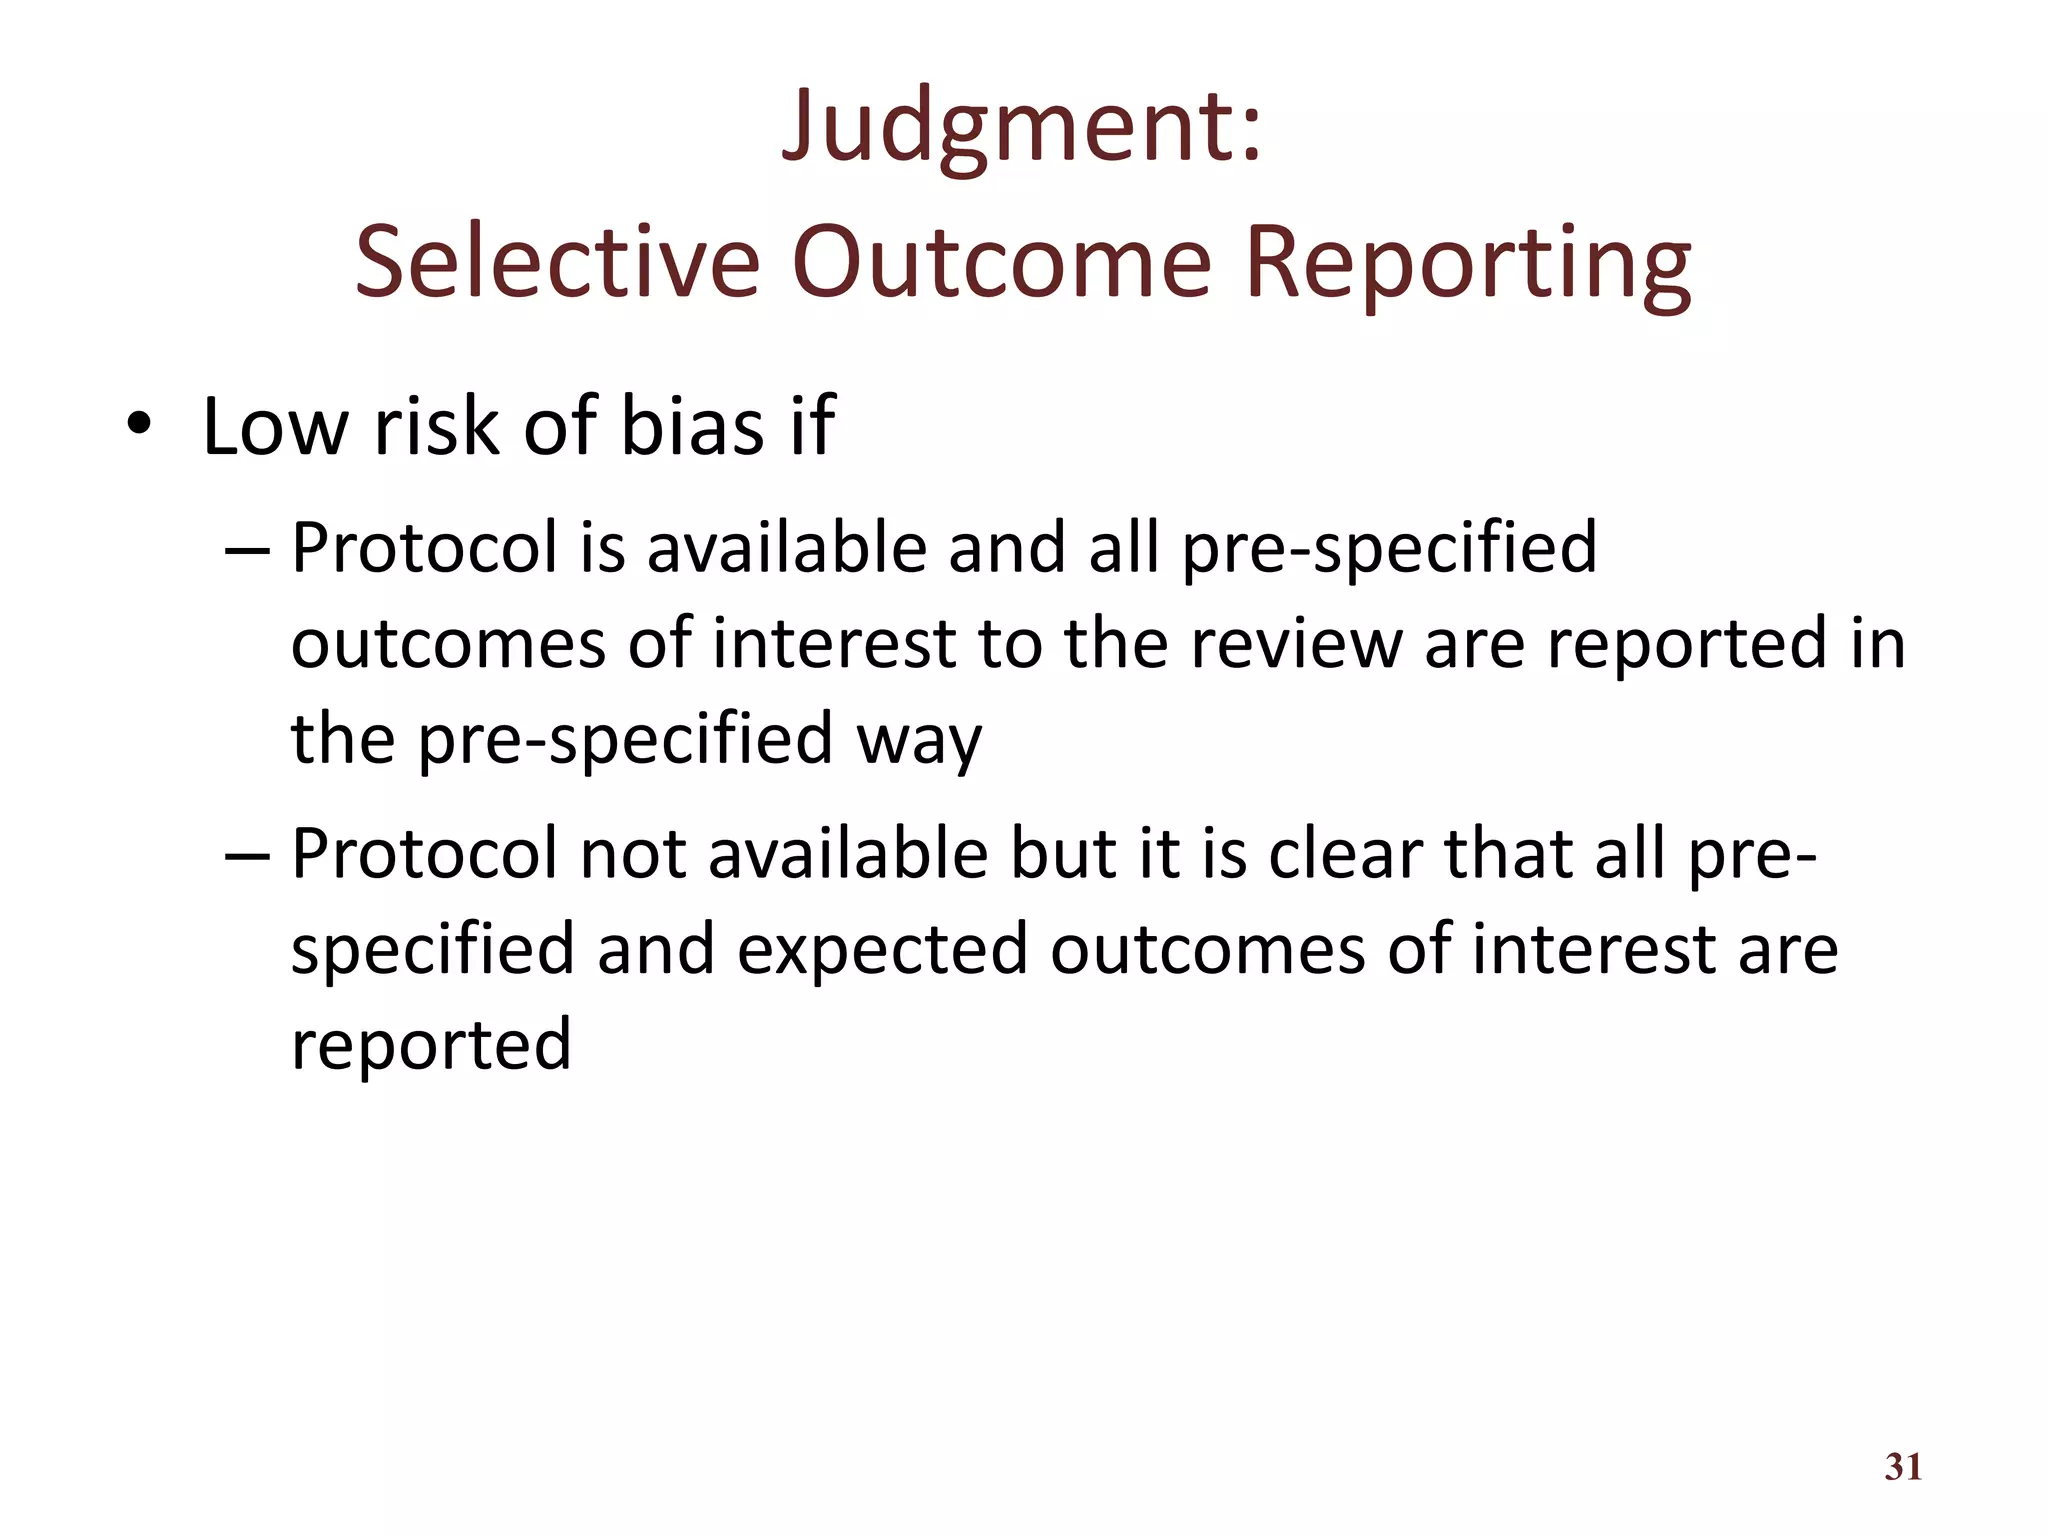
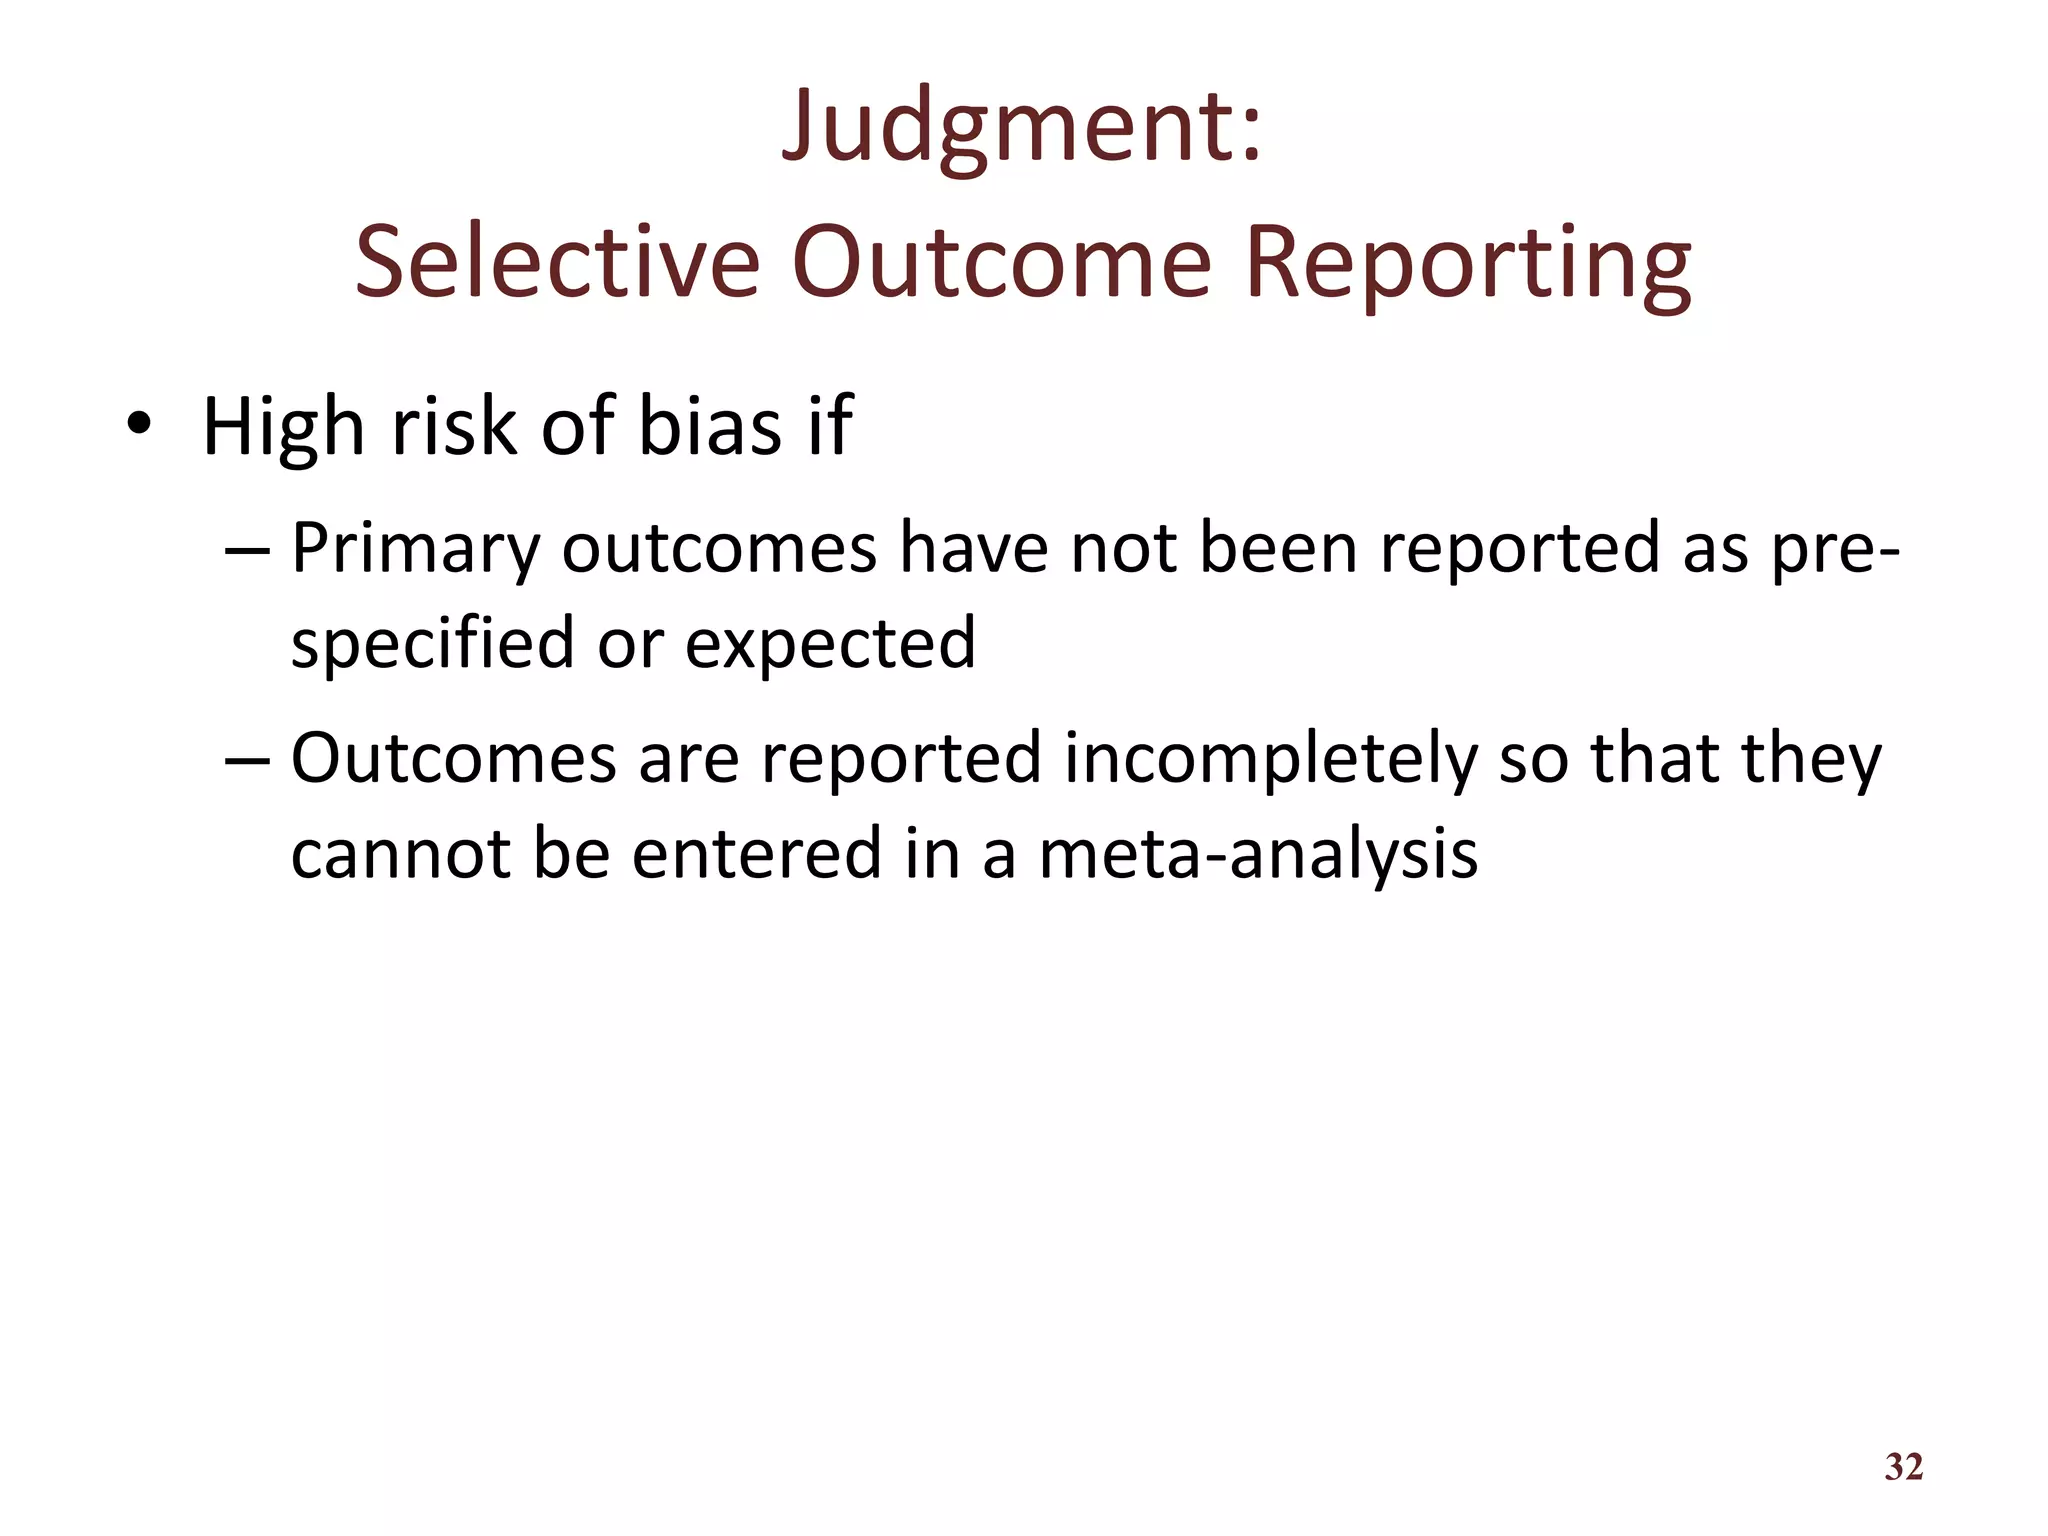
Explains selective outcome reporting and how it leads to bias, including assessment methodologies.
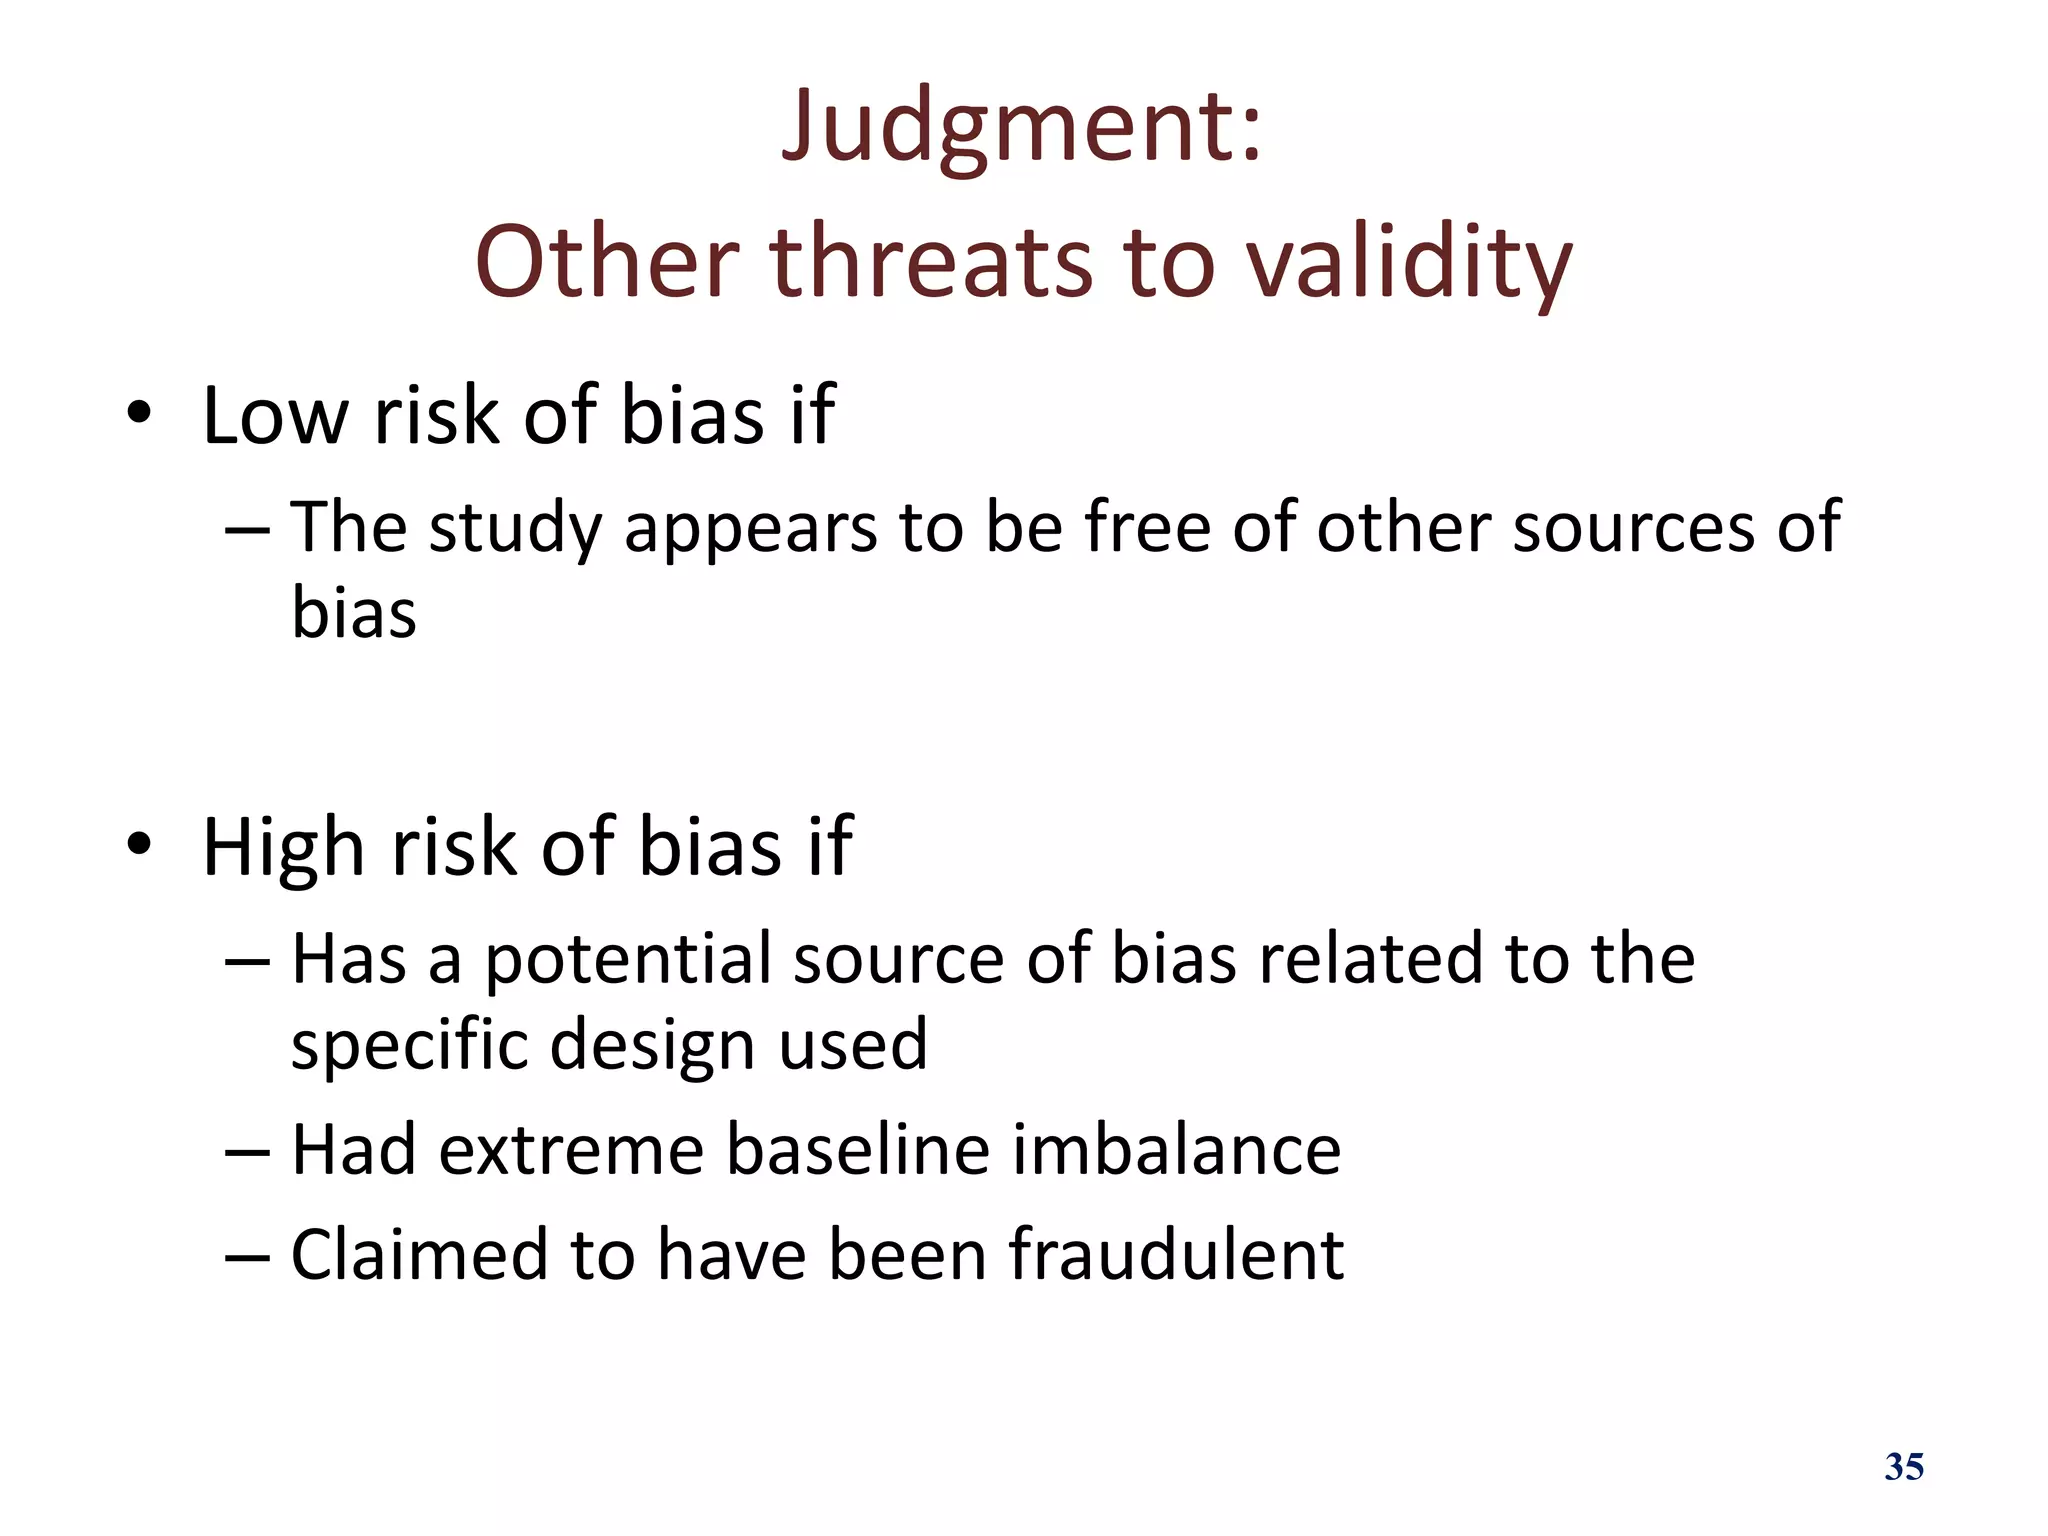
Assessment of other potential threats to validity not previously covered, and judgment criteria.
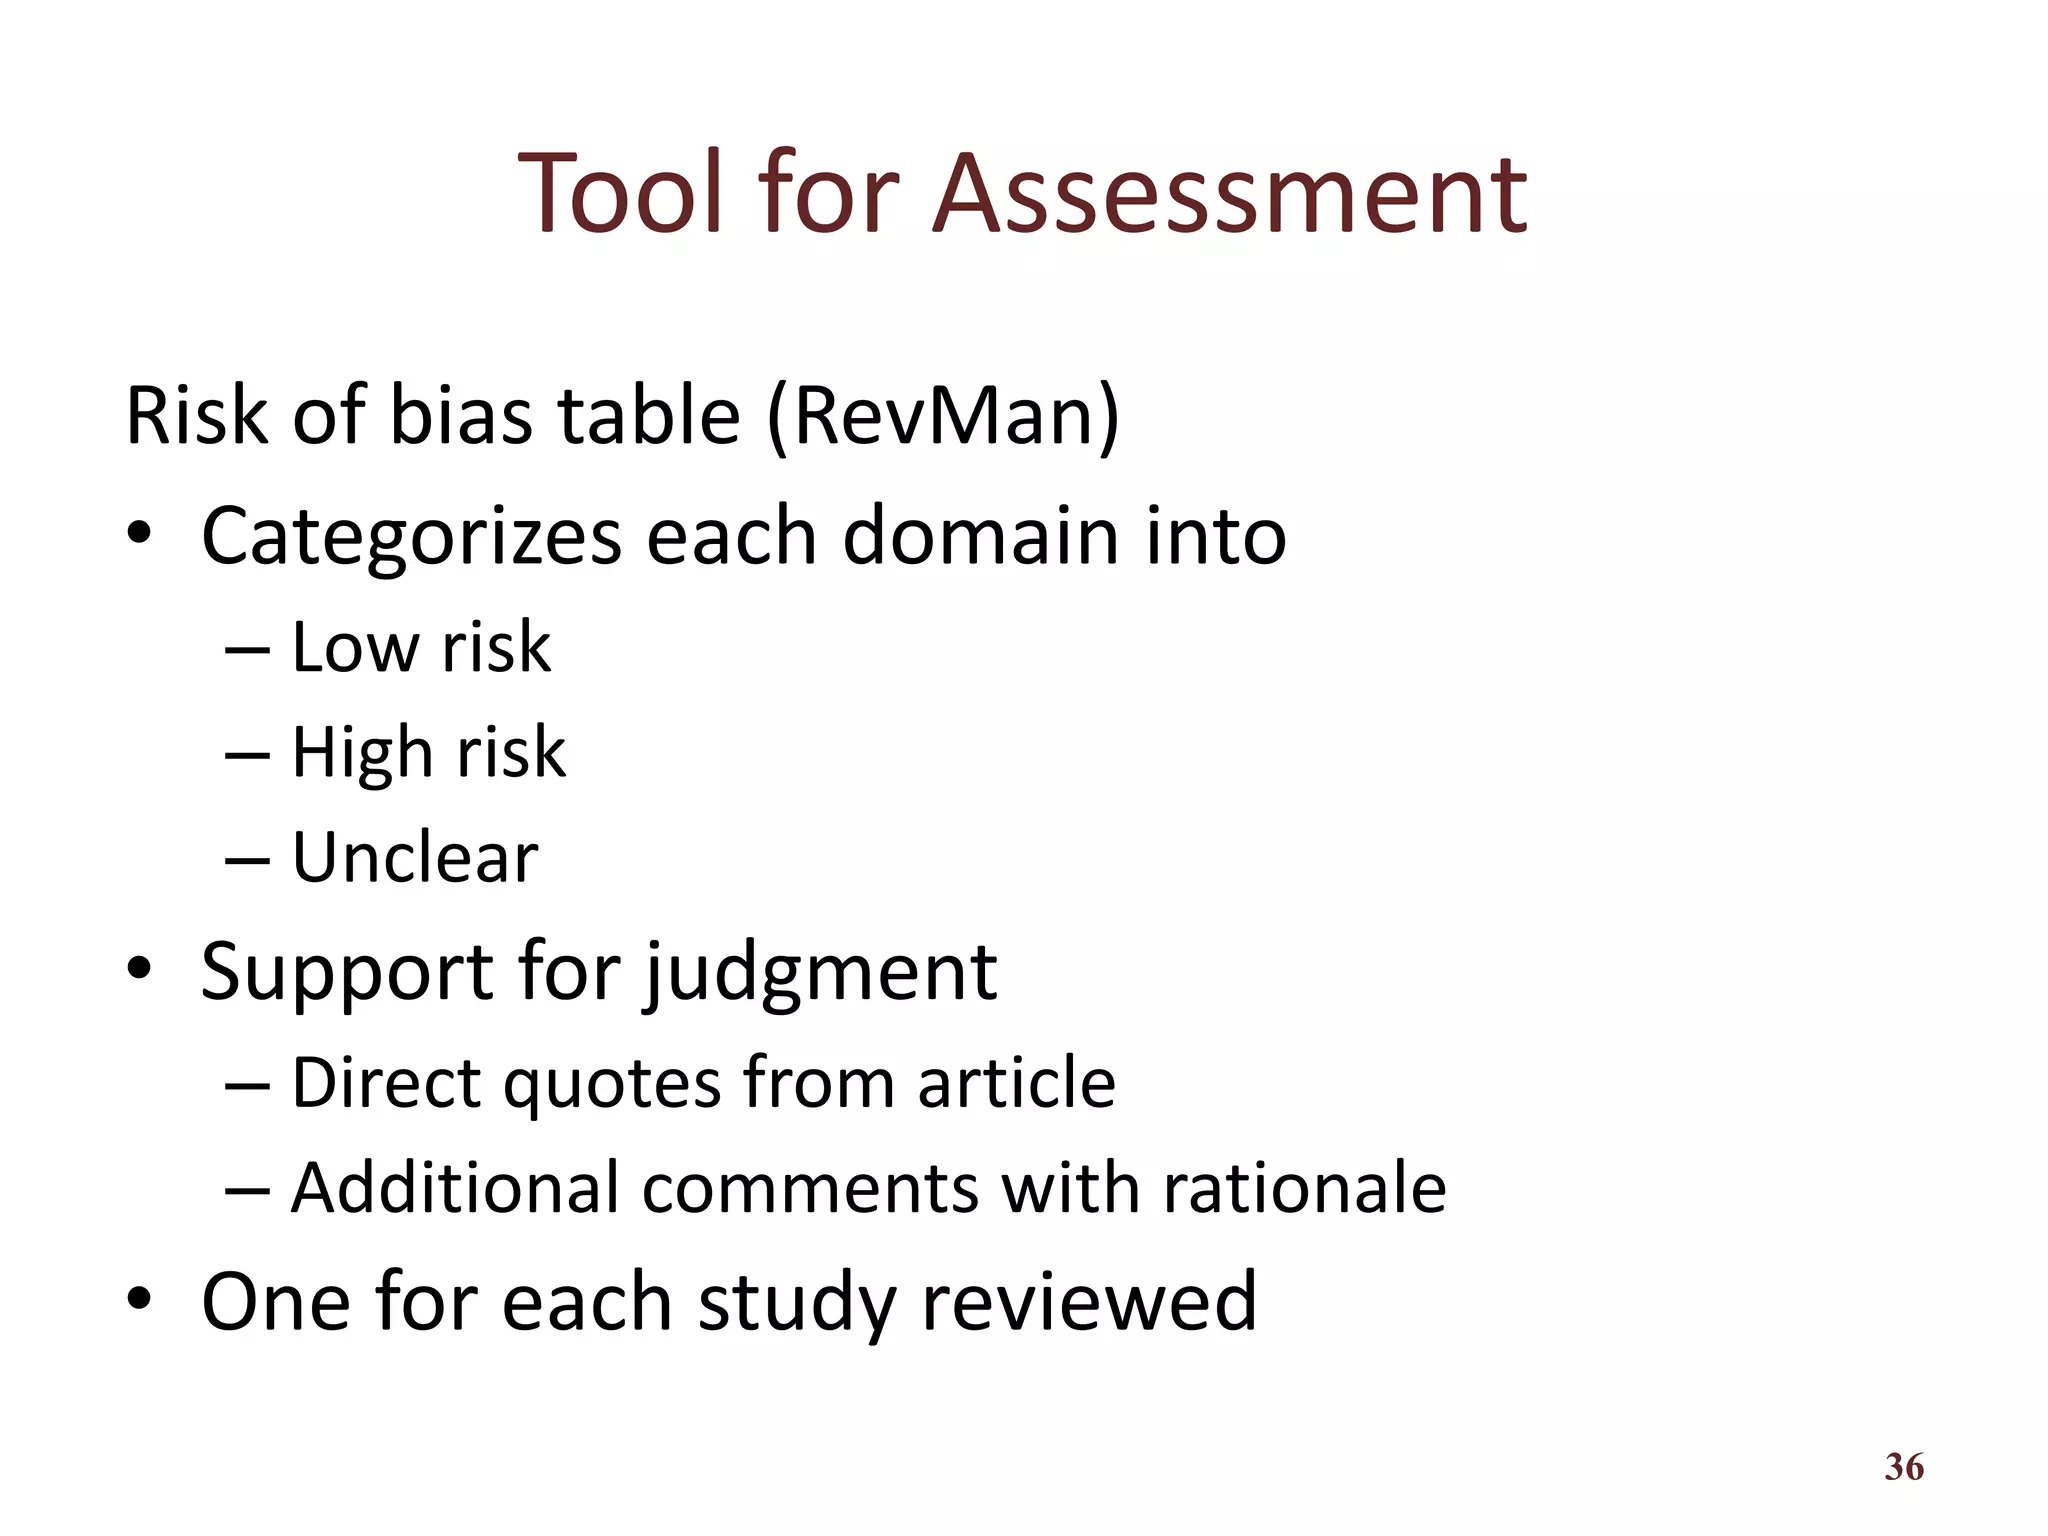
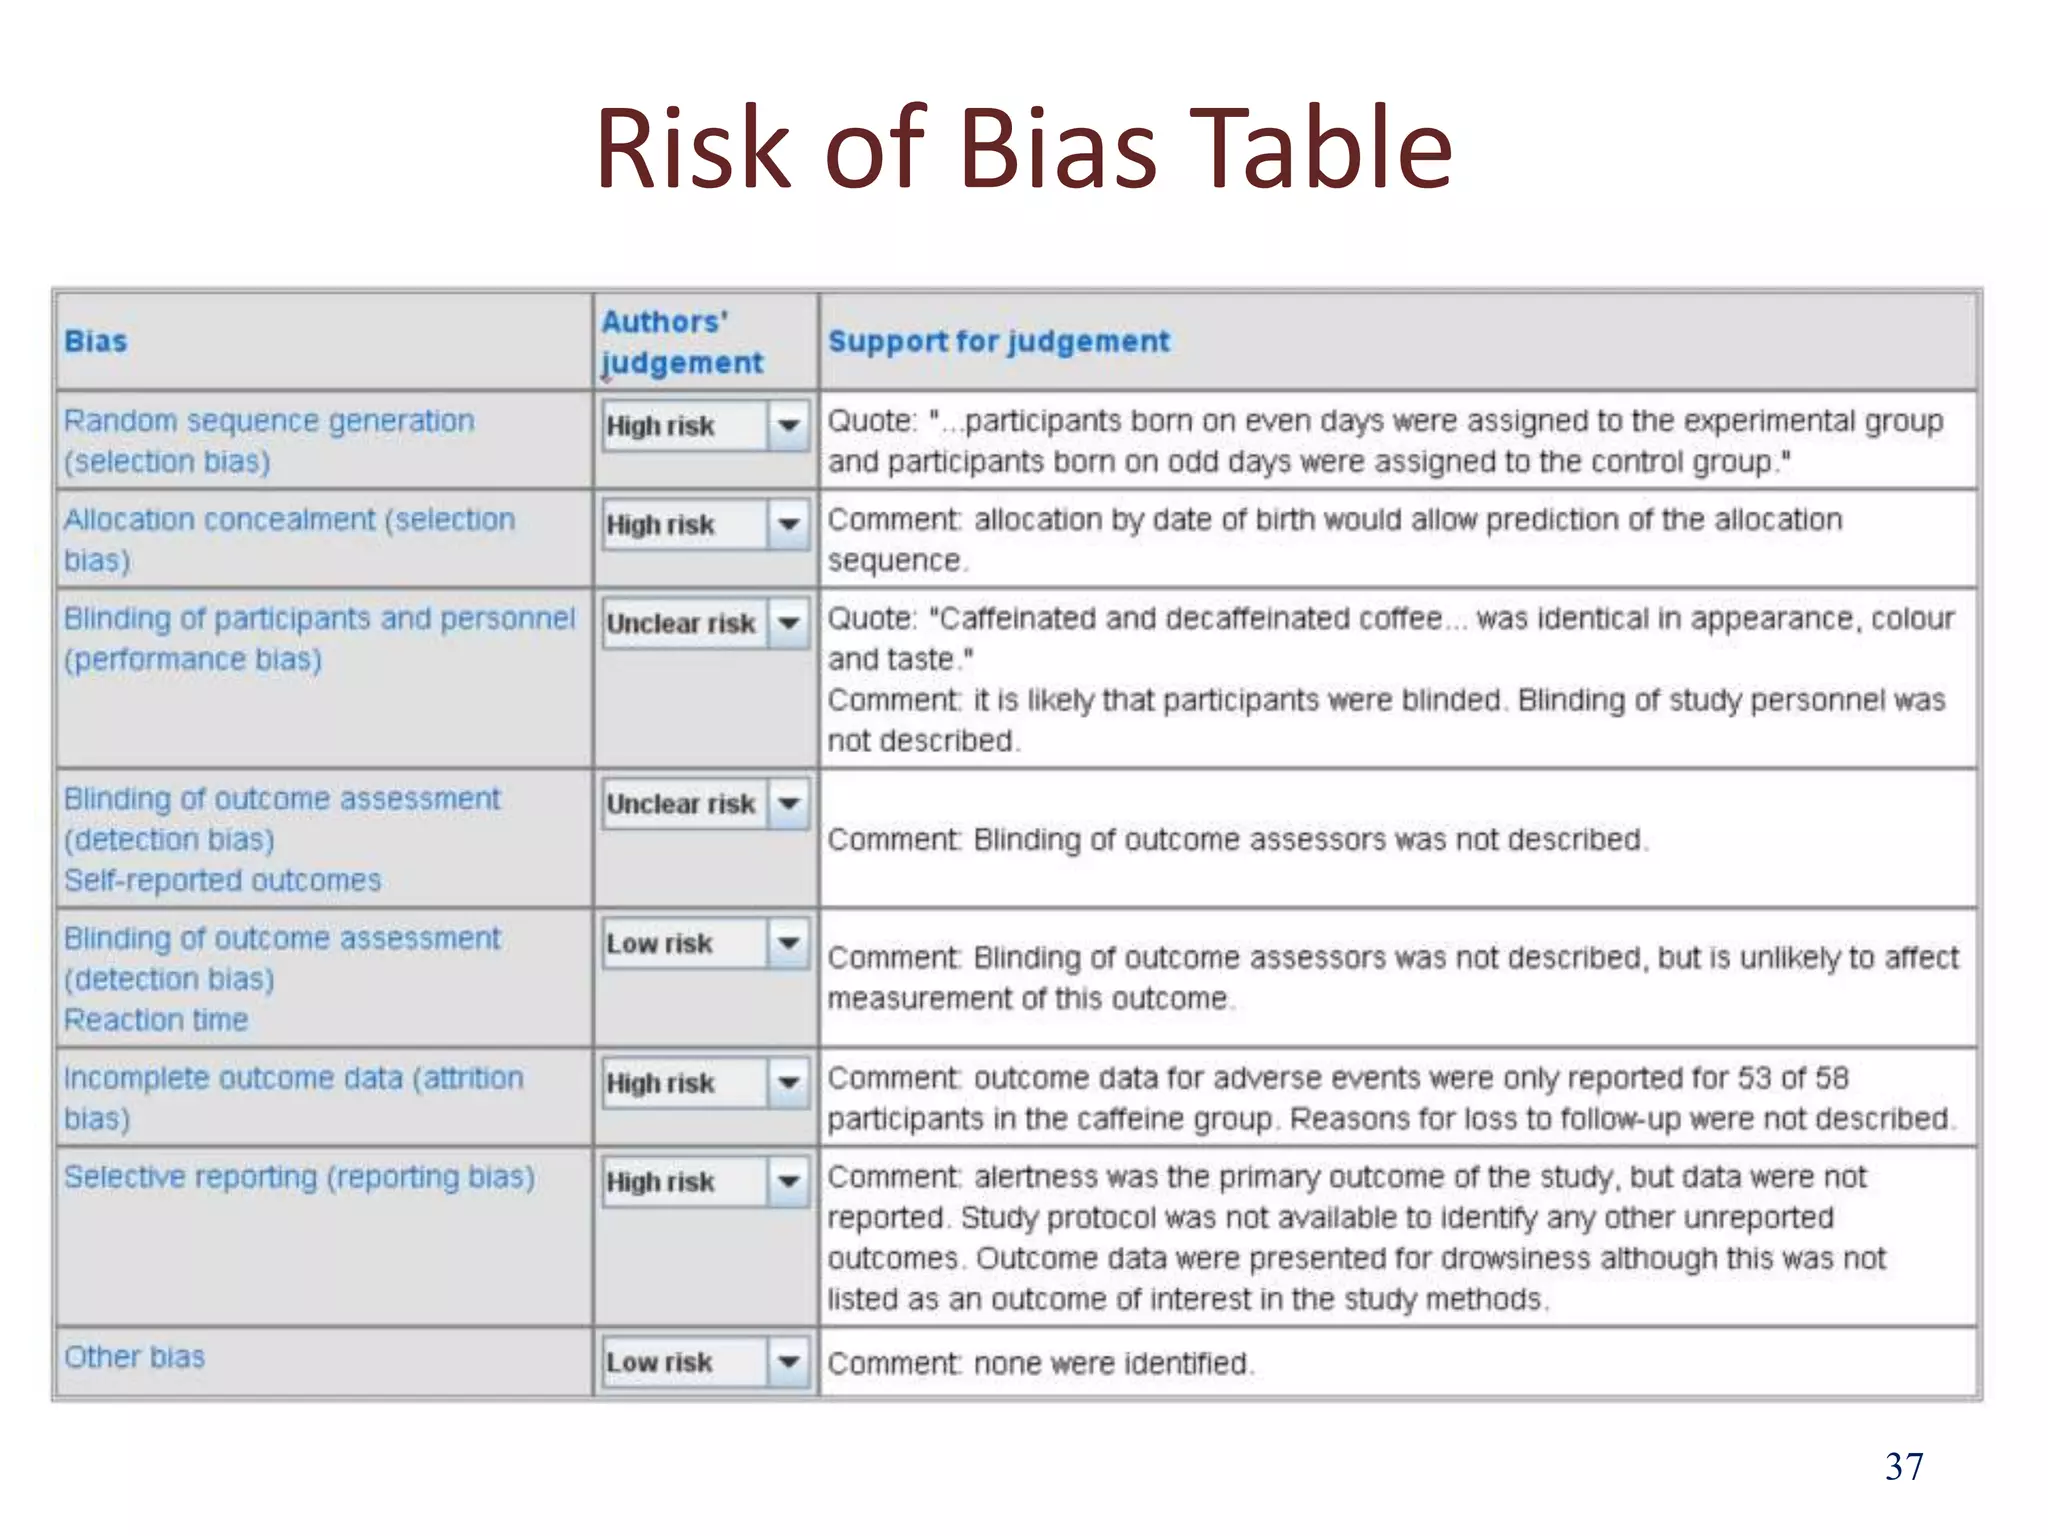
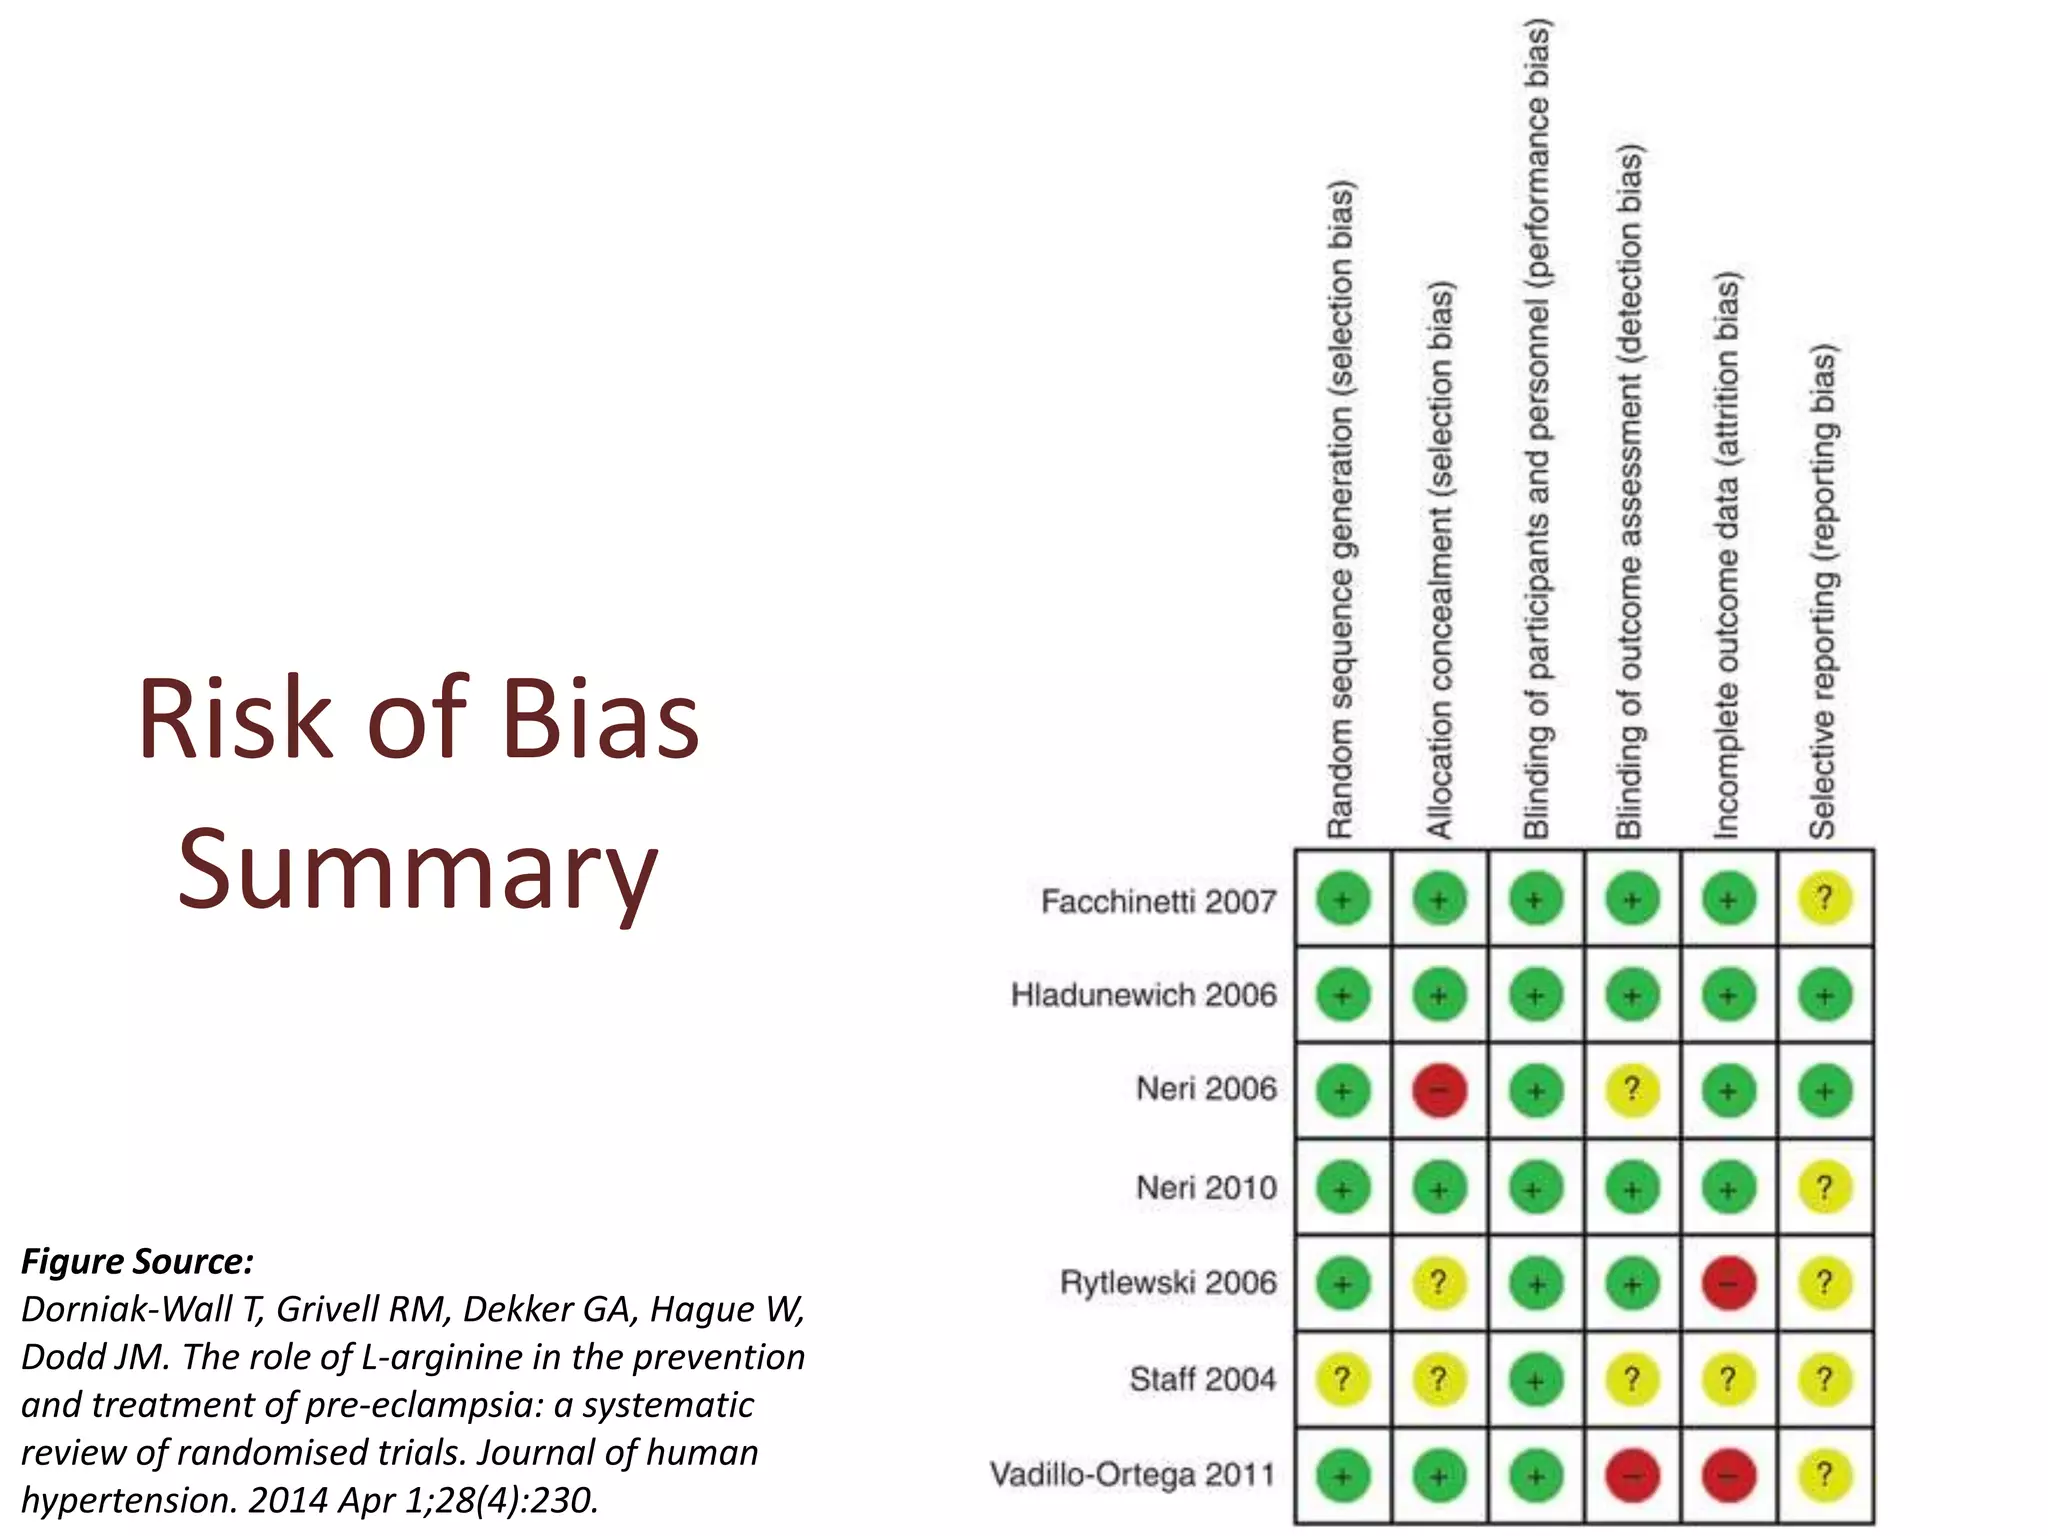
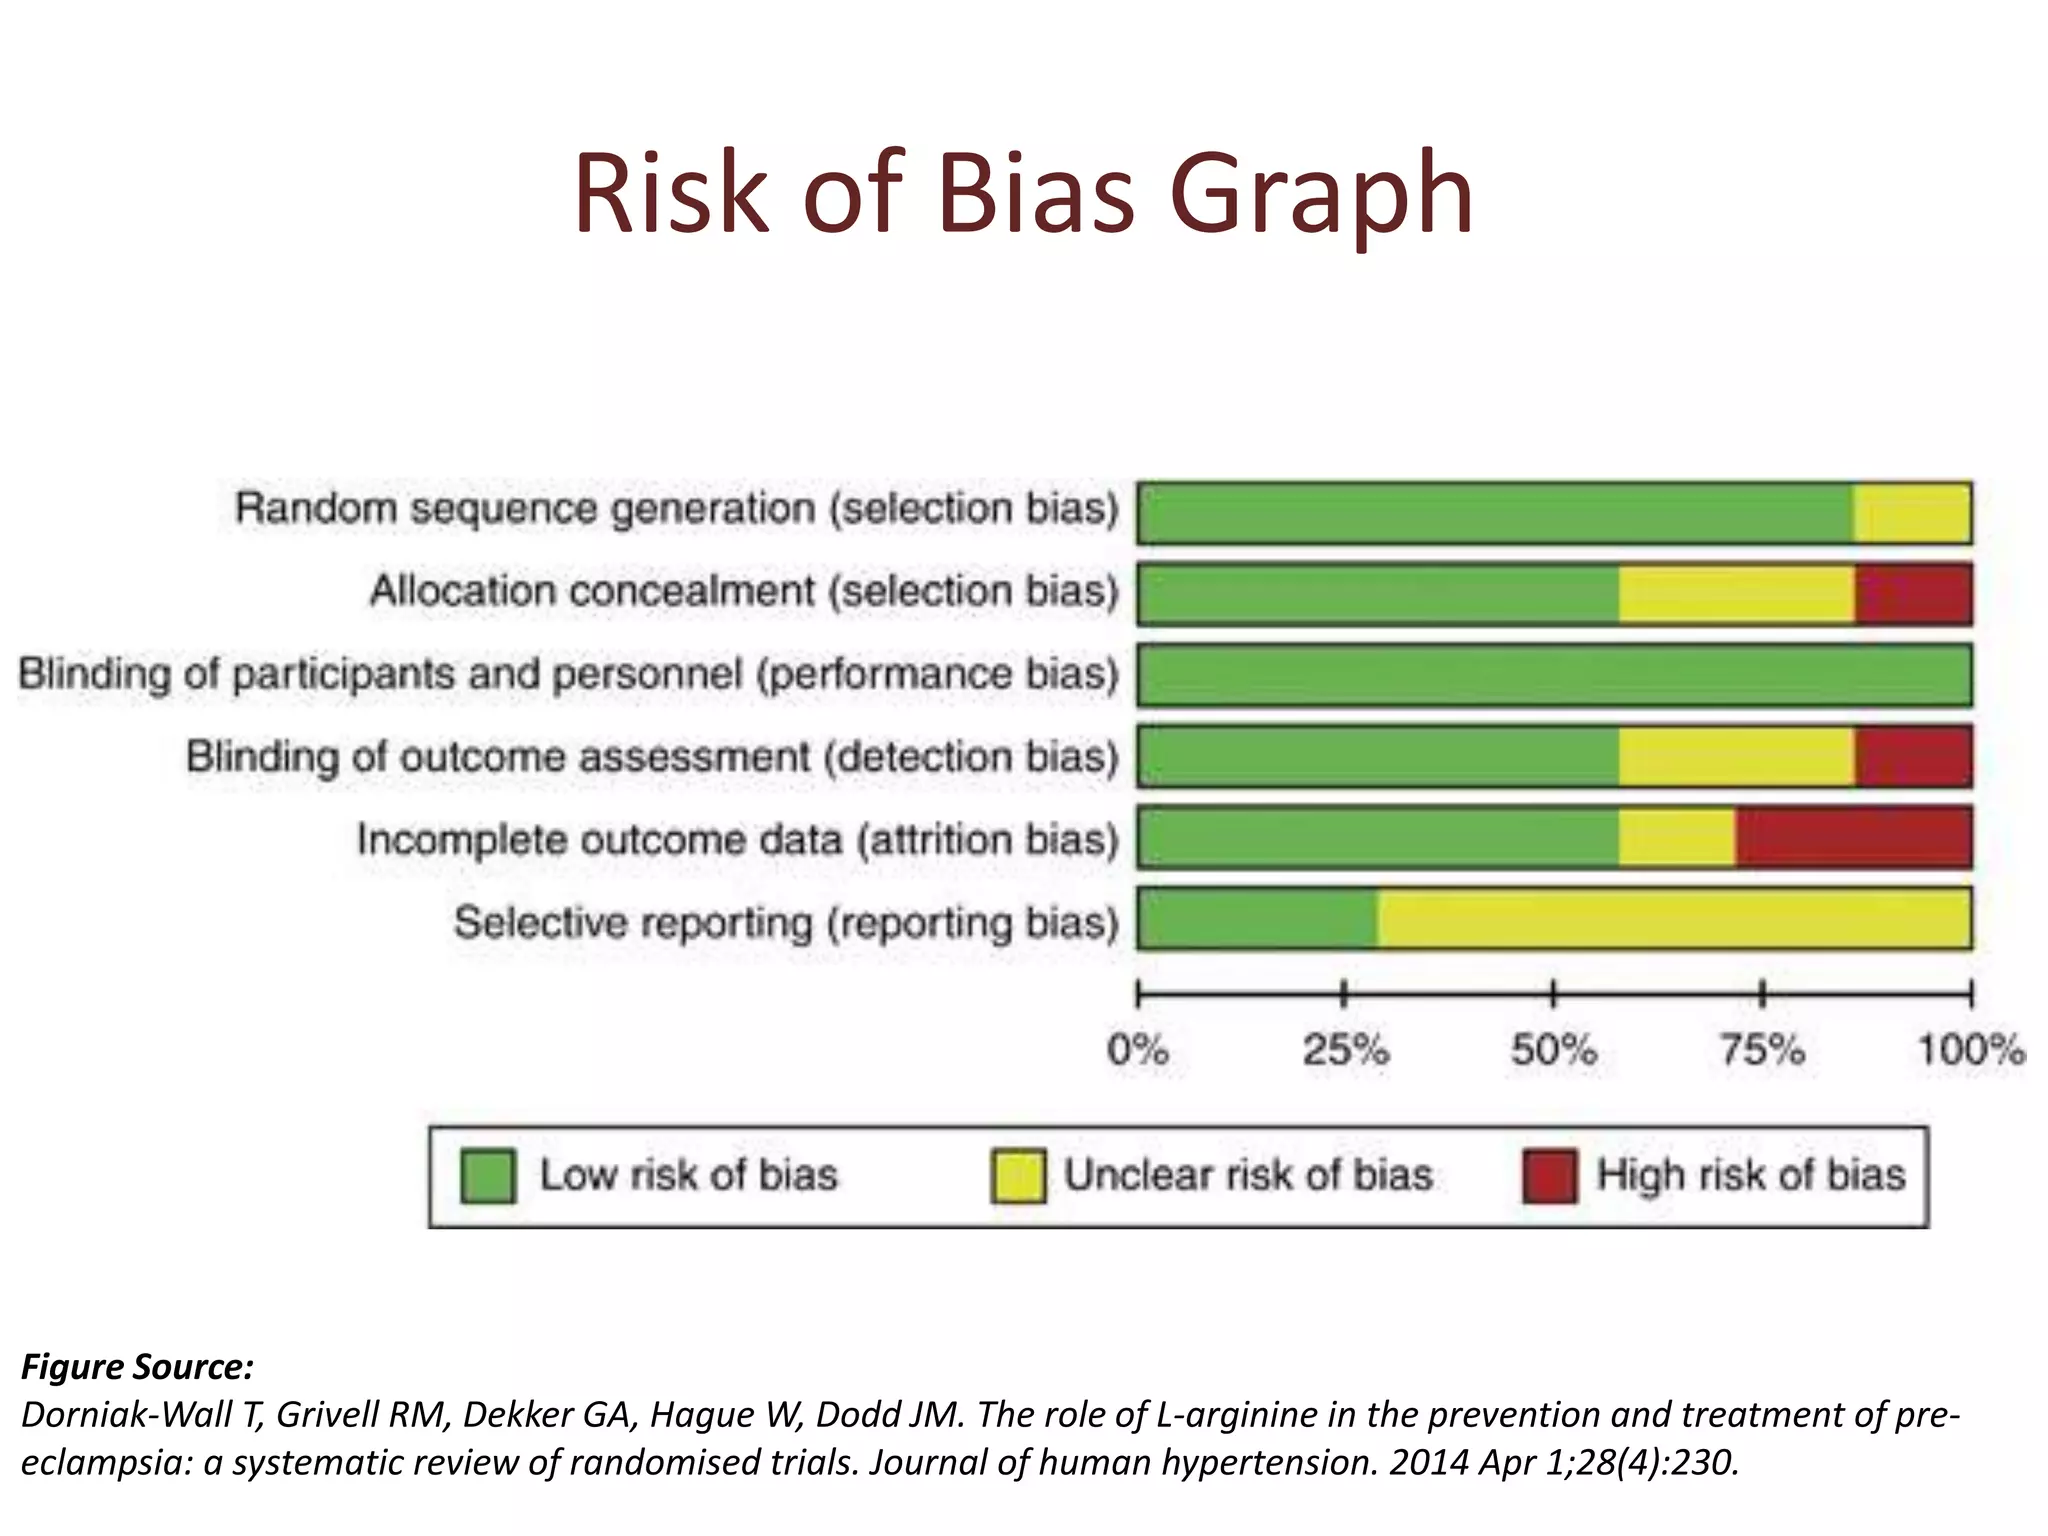
Utilization of the risk of bias table (RevMan) to categorize studies into risk categories.
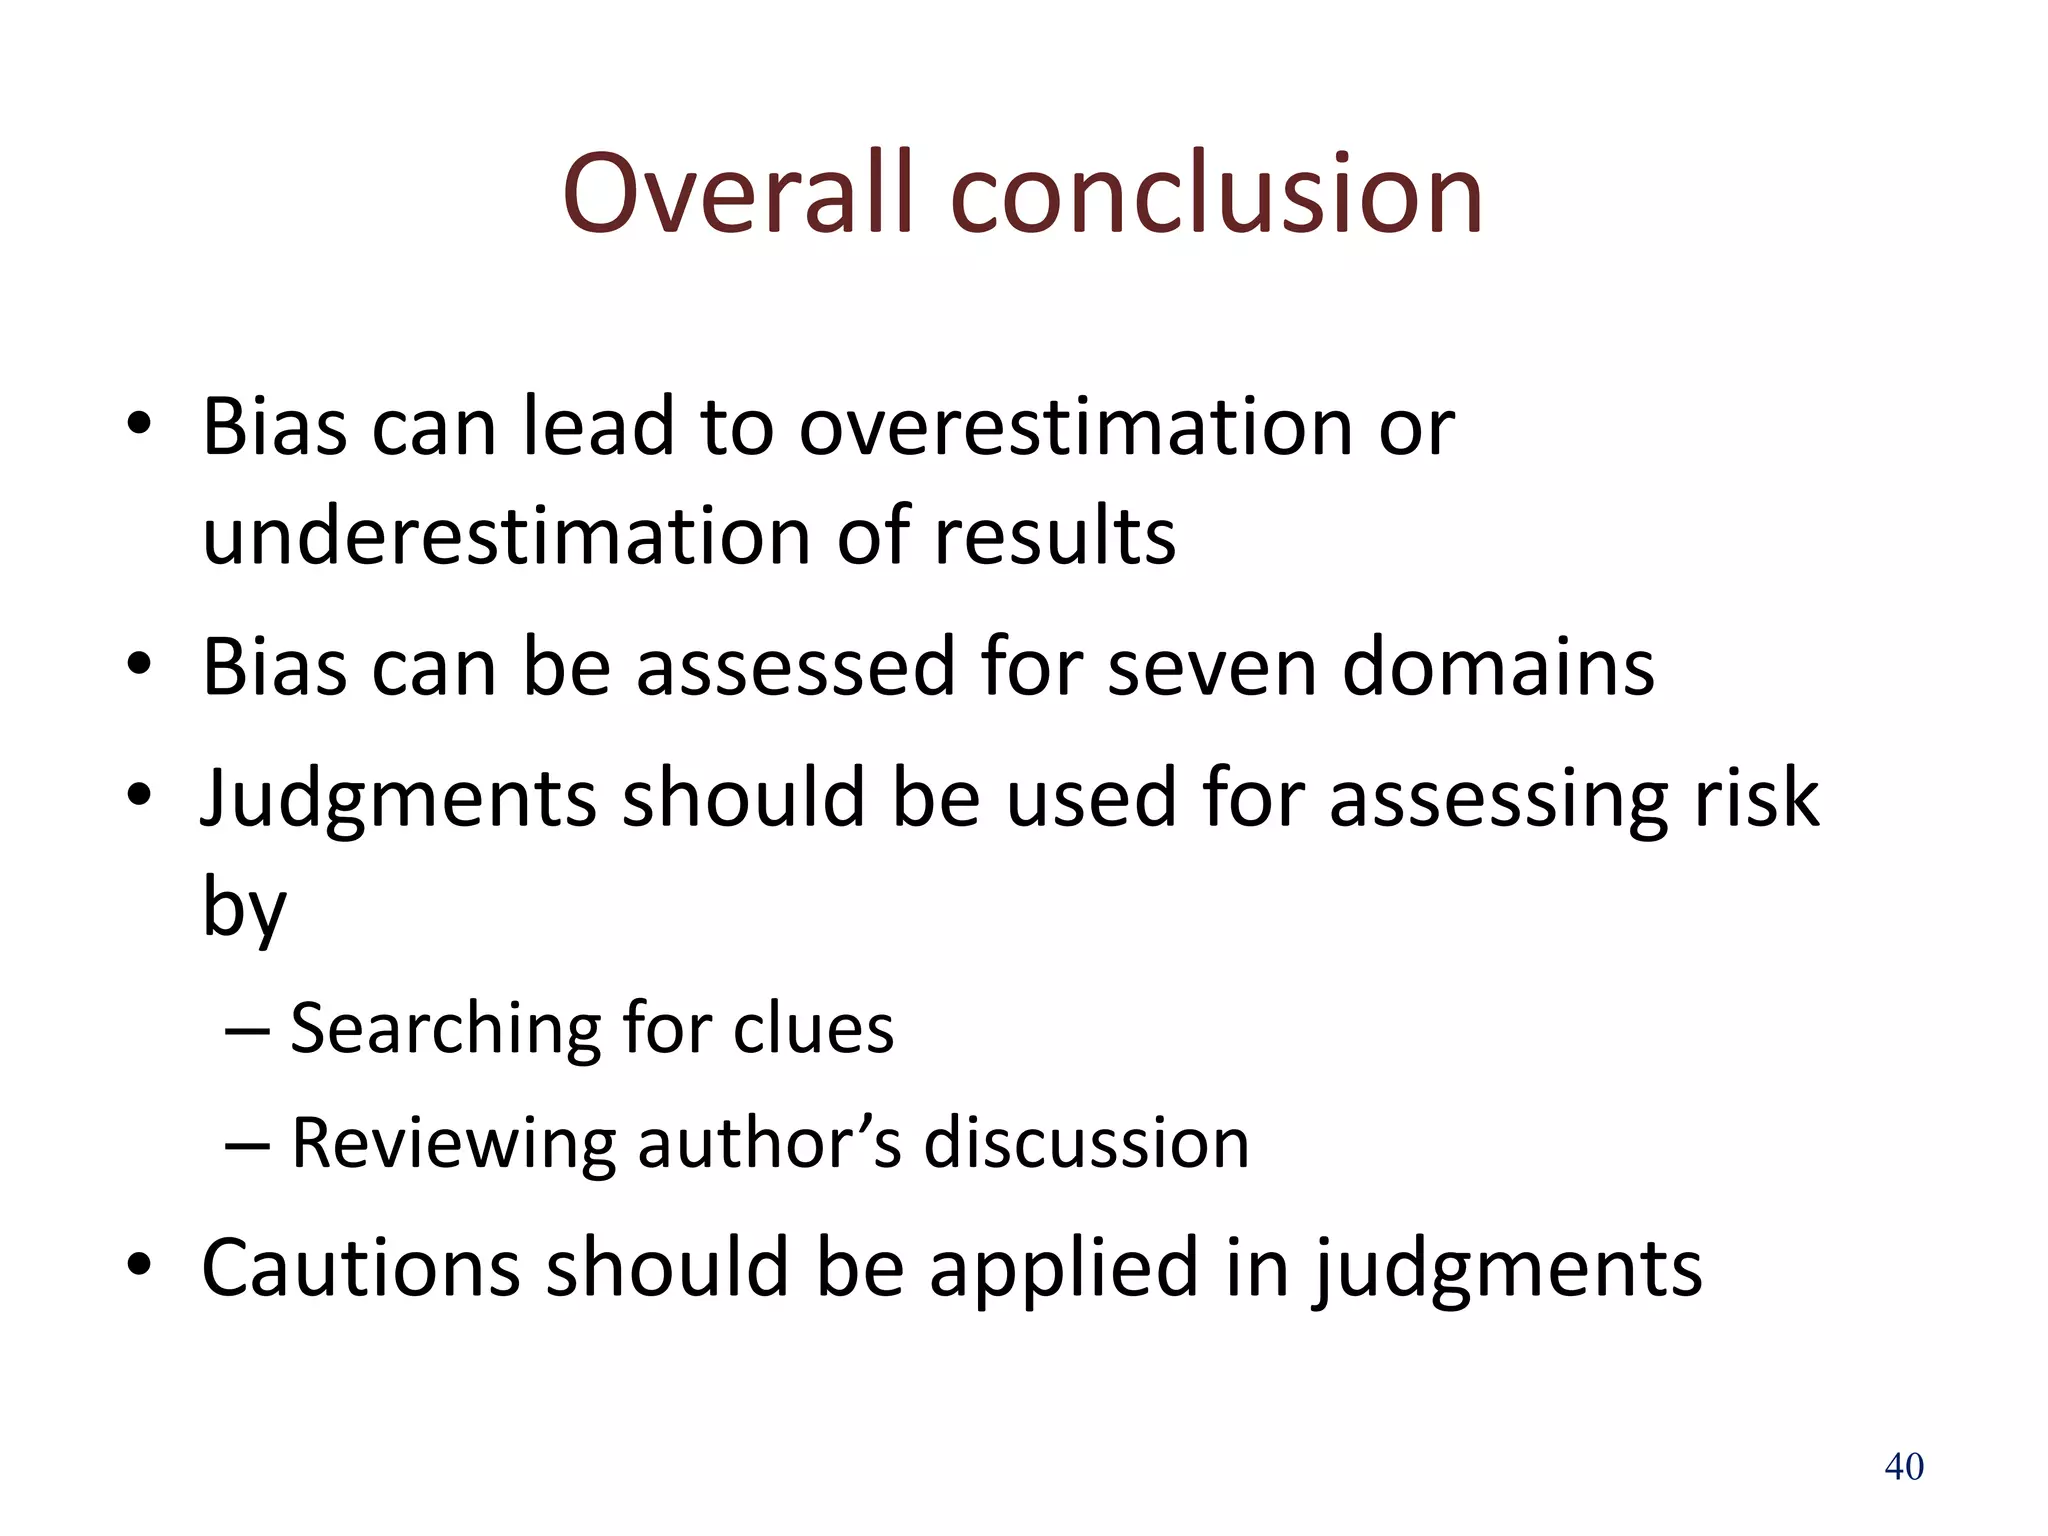
Concluding remarks on bias effects on study results and the importance of careful assessments.
List of references cited in the presentation for further exploration of risk of bias in research.


![Understanding Parkinson’s Disease: Causes, Symptoms, and Treatment [2025]](https://cdn.slidesharecdn.com/ss_thumbnails/understandingparkinson-251208102525-80ba3223-thumbnail.jpg?width=640&height=640&fit=bounds)


