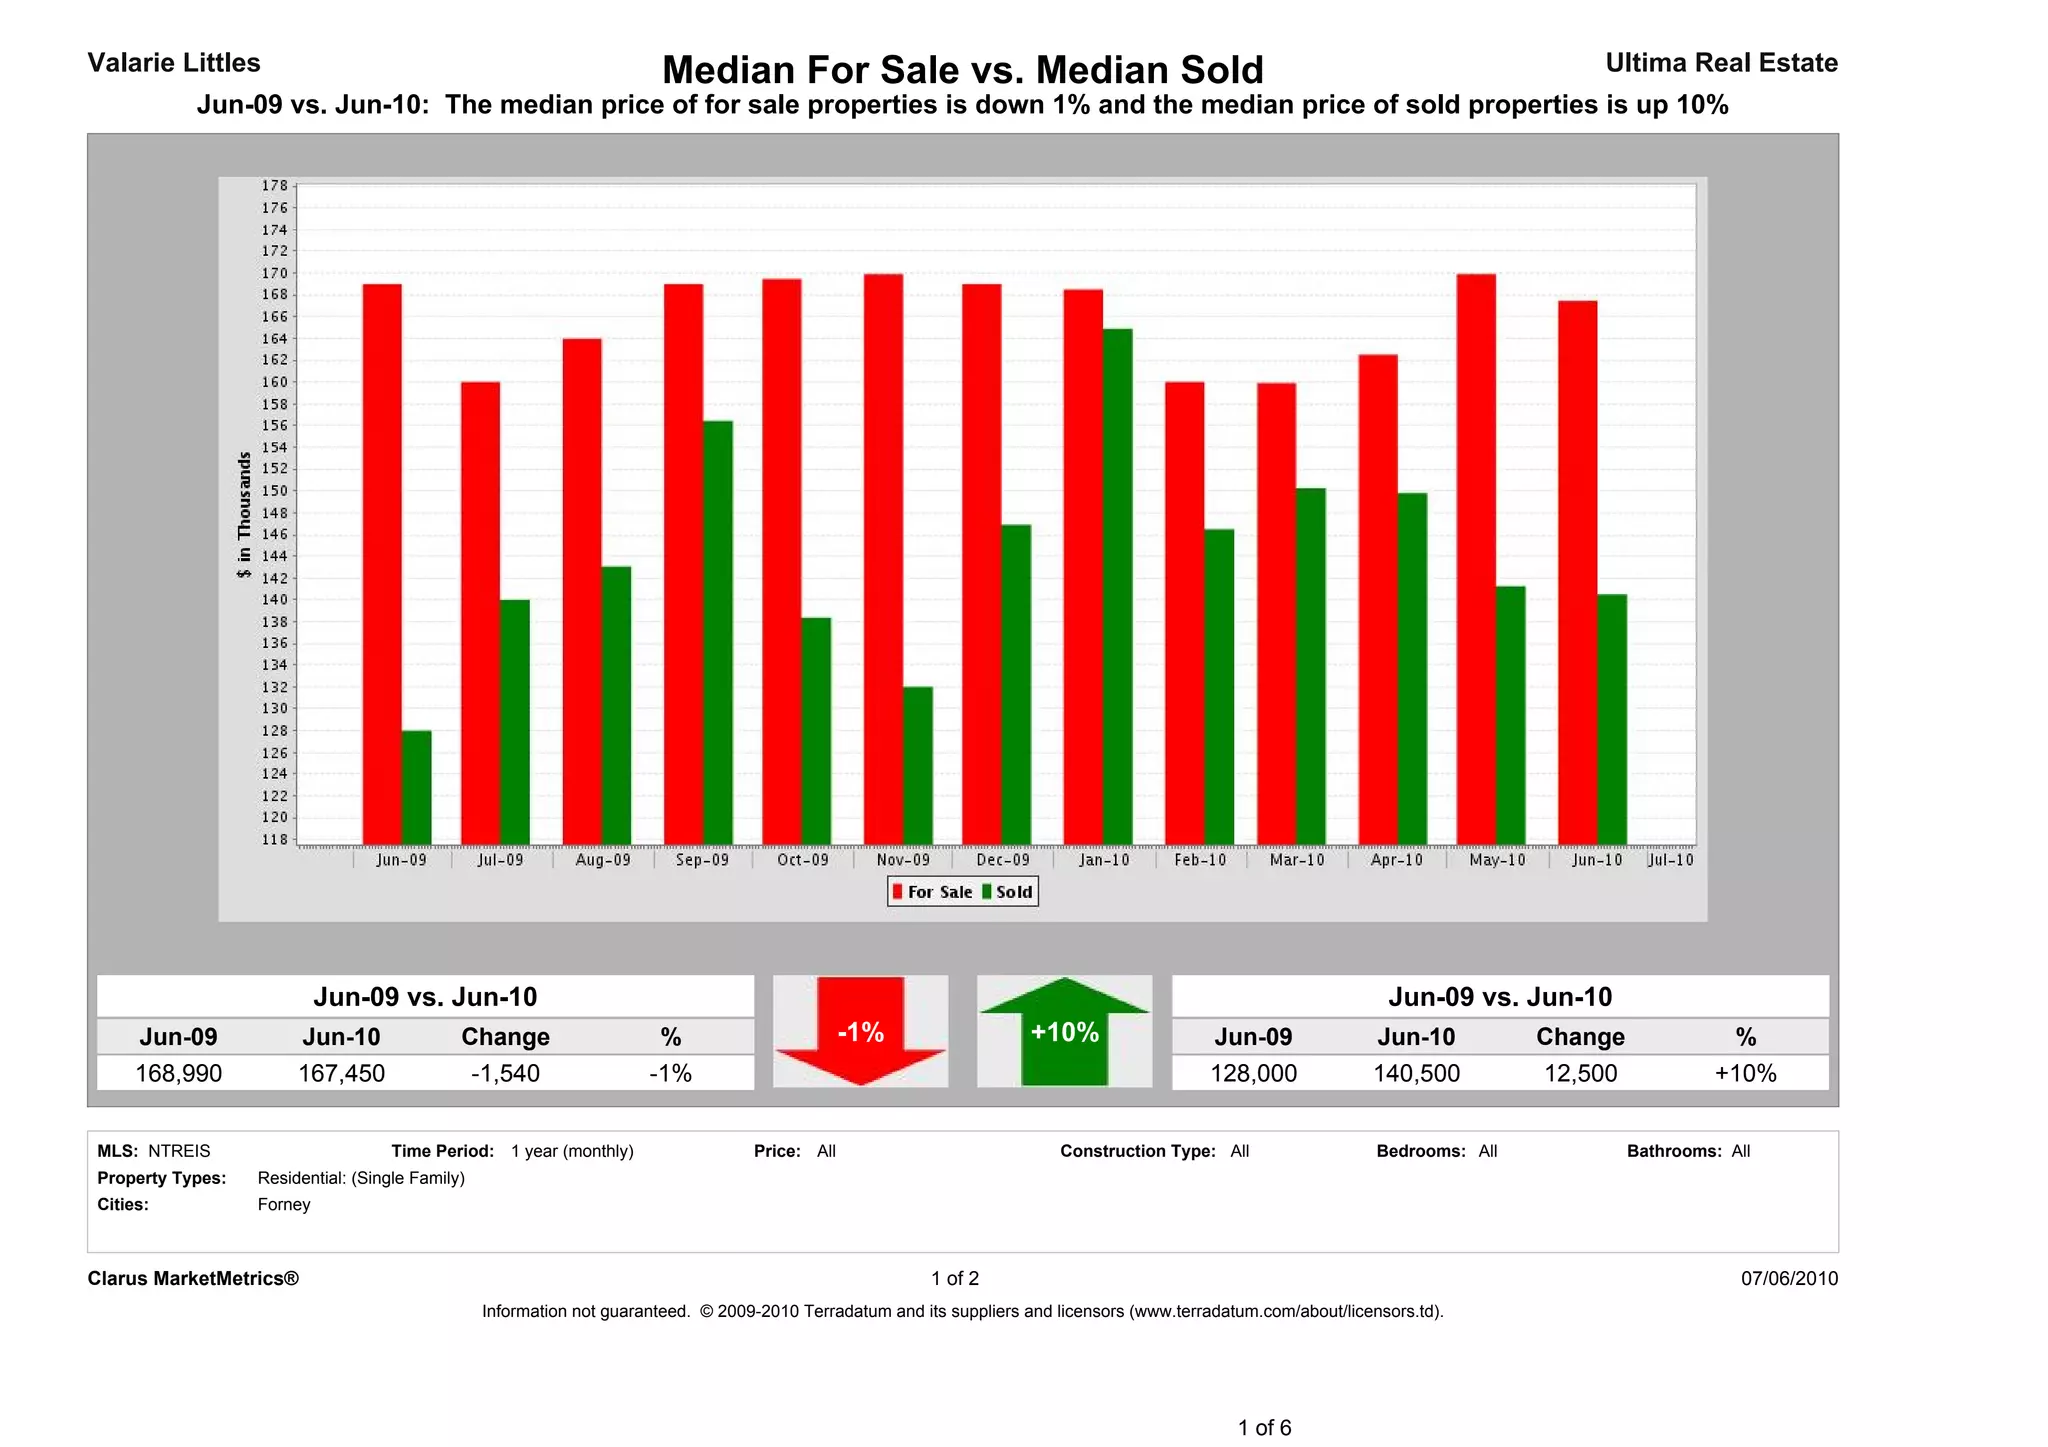
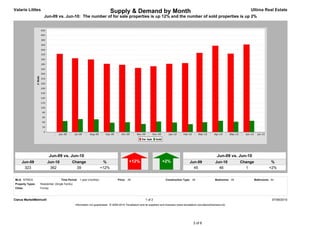
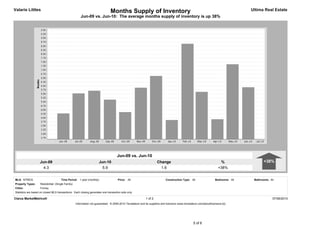
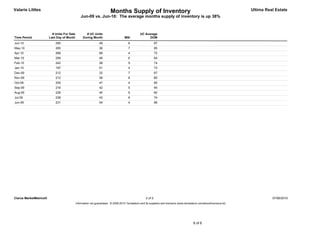
Valarie Littles                                                        Median For Sale vs. Median Sold                                                                                 Ultima Real Estate
           Jun-09 vs. Jun-10: The median price of for sale properties is down 1% and the median price of sold properties is up 10%


                           Jun-09 vs. Jun-10                                                                                                                        Jun-09 vs. Jun-10
     Jun-09            Jun-10                Change                    %                        -1%                    +10%                   Jun-09              Jun-10           Change             %
     168,990           167,450                -1,540                  -1%                                                                     128,000             140,500          12,500            +10%


MLS: NTREIS                         Time Period: 1 year (monthly)                  Price: All                             Construction Type: All                   Bedrooms: All            Bathrooms: All
Property Types:   Residential: (Single Family)
Cities:           Forney


Clarus MarketMetrics®                                                                                     1 of 2                                                                                        07/06/2010
                                                 Information not guaranteed. © 2009-2010 Terradatum and its suppliers and licensors (www.terradatum.com/about/licensors.td).


                                                                                                                                                 1 of 6
Valarie Littles                                            Median For Sale vs. Median Sold                                                                         Ultima Real Estate
          Jun-09 vs. Jun-10: The median price of for sale properties is down 1% and the median price of sold properties is up 10%


                           # Units                   For Sale                                                     Sold
Time Period               For Sale              Average DOM                    # Sold Units               Average DOM
Jun-10                        362                            101                           46                          74
May-10                        324                            126                           42                          75
Apr-10                        357                            131                           46                          98
Mar-10                        327                            148                           40                          71
Feb-10                        285                            162                           32                          81
Jan-10                        282                            167                           39                          79
Dec-09                        272                            176                           43                          65
Nov-09                        265                            181                           33                          69
Oct-09                        278                            182                           40                          93
Sep-09                        282                            186                           38                          64
Aug-09                        300                            180                           52                          79
Jul-09                        305                            179                           53                          83
Jun-09                        323                            181                           45                          68


Clarus MarketMetrics®                                                                           2 of 2                                                                       07/06/2010
                                     Information not guaranteed. © 2009-2010 Terradatum and its suppliers and licensors (www.terradatum.com/about/licensors.td).


                                                                                                                                     2 of 6
Valarie Littles                                                              Supply & Demand by Month                                                                                  Ultima Real Estate
                     Jun-09 vs. Jun-10: The number of for sale properties is up 12% and the number of sold properties is up 2%


                           Jun-09 vs. Jun-10                                                                                                                        Jun-09 vs. Jun-10
     Jun-09             Jun-10               Change                   %                      +12%                       +2%                   Jun-09               Jun-10          Change              %
      323                362                   39                    +12%                                                                       45                   46              1                +2%


MLS: NTREIS                         Time Period: 1 year (monthly)                  Price: All                             Construction Type: All                   Bedrooms: All            Bathrooms: All
Property Types:   Residential: (Single Family)
Cities:           Forney


Clarus MarketMetrics®                                                                                     1 of 2                                                                                        07/06/2010
                                                 Information not guaranteed. © 2009-2010 Terradatum and its suppliers and licensors (www.terradatum.com/about/licensors.td).


                                                                                                                                                 3 of 6
Valarie Littles                                                    Supply & Demand by Month                                                                          Ultima Real Estate
                   Jun-09 vs. Jun-10: The number of for sale properties is up 12% and the number of sold properties is up 2%


                             # Units                   For Sale                                                     Sold
Time Period                 For Sale              Average DOM                    # Sold Units               Average DOM
Jun-10                          362                            101                           46                          74
May-10                          324                            126                           42                          75
Apr-10                          357                            131                           46                          98
Mar-10                          327                            148                           40                          71
Feb-10                          285                            162                           32                          81
Jan-10                          282                            167                           39                          79
Dec-09                          272                            176                           43                          65
Nov-09                          265                            181                           33                          69
Oct-09                          278                            182                           40                          93
Sep-09                          282                            186                           38                          64
Aug-09                          300                            180                           52                          79
Jul-09                          305                            179                           53                          83
Jun-09                          323                            181                           45                          68


Clarus MarketMetrics®                                                                             2 of 2                                                                       07/06/2010
                                       Information not guaranteed. © 2009-2010 Terradatum and its suppliers and licensors (www.terradatum.com/about/licensors.td).


                                                                                                                                       4 of 6
Valarie Littles                                                                Months Supply of Inventory                                                                            Ultima Real Estate
                                                       Jun-09 vs. Jun-10: The average months supply of inventory is up 38%


                                                                                     Jun-09 vs. Jun-10
                    Jun-09                                            Jun-10                                         Change                                             %                   +38%
                      4.3                                               5.9                                            1.6                                             +38%


MLS: NTREIS                           Time Period: 1 year (monthly)                  Price: All                             Construction Type: All                   Bedrooms: All    Bathrooms: All
Property Types:     Residential: (Single Family)
Cities:             Forney
Statistics are based on closed MLS transactions. Each closing generates one transaction side only.

Clarus MarketMetrics®                                                                                       1 of 2                                                                                 07/06/2010
                                                   Information not guaranteed. © 2009-2010 Terradatum and its suppliers and licensors (www.terradatum.com/about/licensors.td).


                                                                                                                                                   5 of 6
Valarie Littles                                                          Months Supply of Inventory                                                                        Ultima Real Estate
                                                 Jun-09 vs. Jun-10: The average months supply of inventory is up 38%


                          # Units For Sale          # UC Units                                   UC Average
Time Period             Last Day of Month         During Month                      MSI                DOM
Jun-10                      290                                 49                      6                      87
May-10                      265                                 36                      7                      85
Apr-10                      266                                 68                      4                      72
Mar-10                      259                                 46                      6                      84
Feb-10                      242                                 28                      9                      74
Jan-10                      197                                 51                      4                      73
Dec-09                      212                                 32                      7                      67
Nov-09                      212                                 36                      6                      80
Oct-09                      205                                 47                      4                      85
Sep-09                      216                                 42                      5                      94
Aug-09                      228                                 40                      6                      60
Jul-09                      238                                 43                      6                      74
Jun-09                      231                                 54                      4                      86


Clarus MarketMetrics®                                                                                 2 of 2                                                                         07/06/2010
                                             Information not guaranteed. © 2009-2010 Terradatum and its suppliers and licensors (www.terradatum.com/about/licensors.td).


                                                                                                                                             6 of 6

Forney TX - June 2010 - Market Report

  • 1.
    Valarie Littles Median For Sale vs. Median Sold Ultima Real Estate Jun-09 vs. Jun-10: The median price of for sale properties is down 1% and the median price of sold properties is up 10% Jun-09 vs. Jun-10 Jun-09 vs. Jun-10 Jun-09 Jun-10 Change % -1% +10% Jun-09 Jun-10 Change % 168,990 167,450 -1,540 -1% 128,000 140,500 12,500 +10% MLS: NTREIS Time Period: 1 year (monthly) Price: All Construction Type: All Bedrooms: All Bathrooms: All Property Types: Residential: (Single Family) Cities: Forney Clarus MarketMetrics® 1 of 2 07/06/2010 Information not guaranteed. © 2009-2010 Terradatum and its suppliers and licensors (www.terradatum.com/about/licensors.td). 1 of 6
  • 2.
    Valarie Littles Median For Sale vs. Median Sold Ultima Real Estate Jun-09 vs. Jun-10: The median price of for sale properties is down 1% and the median price of sold properties is up 10% # Units For Sale Sold Time Period For Sale Average DOM # Sold Units Average DOM Jun-10 362 101 46 74 May-10 324 126 42 75 Apr-10 357 131 46 98 Mar-10 327 148 40 71 Feb-10 285 162 32 81 Jan-10 282 167 39 79 Dec-09 272 176 43 65 Nov-09 265 181 33 69 Oct-09 278 182 40 93 Sep-09 282 186 38 64 Aug-09 300 180 52 79 Jul-09 305 179 53 83 Jun-09 323 181 45 68 Clarus MarketMetrics® 2 of 2 07/06/2010 Information not guaranteed. © 2009-2010 Terradatum and its suppliers and licensors (www.terradatum.com/about/licensors.td). 2 of 6
  • 3.
    Valarie Littles Supply & Demand by Month Ultima Real Estate Jun-09 vs. Jun-10: The number of for sale properties is up 12% and the number of sold properties is up 2% Jun-09 vs. Jun-10 Jun-09 vs. Jun-10 Jun-09 Jun-10 Change % +12% +2% Jun-09 Jun-10 Change % 323 362 39 +12% 45 46 1 +2% MLS: NTREIS Time Period: 1 year (monthly) Price: All Construction Type: All Bedrooms: All Bathrooms: All Property Types: Residential: (Single Family) Cities: Forney Clarus MarketMetrics® 1 of 2 07/06/2010 Information not guaranteed. © 2009-2010 Terradatum and its suppliers and licensors (www.terradatum.com/about/licensors.td). 3 of 6
  • 4.
    Valarie Littles Supply & Demand by Month Ultima Real Estate Jun-09 vs. Jun-10: The number of for sale properties is up 12% and the number of sold properties is up 2% # Units For Sale Sold Time Period For Sale Average DOM # Sold Units Average DOM Jun-10 362 101 46 74 May-10 324 126 42 75 Apr-10 357 131 46 98 Mar-10 327 148 40 71 Feb-10 285 162 32 81 Jan-10 282 167 39 79 Dec-09 272 176 43 65 Nov-09 265 181 33 69 Oct-09 278 182 40 93 Sep-09 282 186 38 64 Aug-09 300 180 52 79 Jul-09 305 179 53 83 Jun-09 323 181 45 68 Clarus MarketMetrics® 2 of 2 07/06/2010 Information not guaranteed. © 2009-2010 Terradatum and its suppliers and licensors (www.terradatum.com/about/licensors.td). 4 of 6
  • 5.
    Valarie Littles Months Supply of Inventory Ultima Real Estate Jun-09 vs. Jun-10: The average months supply of inventory is up 38% Jun-09 vs. Jun-10 Jun-09 Jun-10 Change % +38% 4.3 5.9 1.6 +38% MLS: NTREIS Time Period: 1 year (monthly) Price: All Construction Type: All Bedrooms: All Bathrooms: All Property Types: Residential: (Single Family) Cities: Forney Statistics are based on closed MLS transactions. Each closing generates one transaction side only. Clarus MarketMetrics® 1 of 2 07/06/2010 Information not guaranteed. © 2009-2010 Terradatum and its suppliers and licensors (www.terradatum.com/about/licensors.td). 5 of 6
  • 6.
    Valarie Littles Months Supply of Inventory Ultima Real Estate Jun-09 vs. Jun-10: The average months supply of inventory is up 38% # Units For Sale # UC Units UC Average Time Period Last Day of Month During Month MSI DOM Jun-10 290 49 6 87 May-10 265 36 7 85 Apr-10 266 68 4 72 Mar-10 259 46 6 84 Feb-10 242 28 9 74 Jan-10 197 51 4 73 Dec-09 212 32 7 67 Nov-09 212 36 6 80 Oct-09 205 47 4 85 Sep-09 216 42 5 94 Aug-09 228 40 6 60 Jul-09 238 43 6 74 Jun-09 231 54 4 86 Clarus MarketMetrics® 2 of 2 07/06/2010 Information not guaranteed. © 2009-2010 Terradatum and its suppliers and licensors (www.terradatum.com/about/licensors.td). 6 of 6