The document summarizes real estate data from June 2009 to June 2010 in The Colony, Texas. It shows that the median price of for-sale properties decreased 6% from $170,000 to $159,990, while the median price of sold properties decreased 9% from $142,500 to $129,900 over this period. The number of for-sale properties increased 2% from 219 to 223, but the number of sold properties decreased 26% from 47 to 35. Additionally, the average months of inventory increased 131% from 4.1 months to 9.4 months.
The document compares median home prices and housing inventory in June 2009 to June 2010 in Frisco, Texas. It finds that the median price of for-sale homes was unchanged, while the median price of homes sold increased by 9%. The number of for-sale homes decreased by 7% and the number of homes sold decreased by 13%. The average months of inventory increased by 52% from June 2009 to June 2010.
The document compares housing market data from June 2009 to June 2010 in Allen, Texas. It states that the median price of for-sale properties increased 2% while the median price of sold properties remained unchanged. Additionally, the number of for-sale properties rose 2% but the number of sold properties declined 28%. The average months of inventory increased 62% from 3.6 to 5.8 months.
The document compares housing market data from May 2009 to May 2010 in Allen, Texas. It finds that the median price of for-sale properties increased 1% while the median price of sold properties decreased 4%. The number of for-sale properties decreased 7% and the number of sold properties increased 37%. Additionally, the average months of inventory increased 64% from 3.7 to 6.1 months.
The document compares housing market data from June 2009 to June 2010 in Carrollton, Texas. It shows that the median price of for-sale properties increased 2% while the median price of sold properties decreased 1%. The number of for-sale properties rose 6% but the number of sold properties fell 13%. Additionally, the average months of inventory increased 92% from 3.8 months in June 2009 to 7.4 months in June 2010.
The document contains real estate data from June 2009 to June 2010 for Savannah, GA. It shows that during this period:
- The median price of for-sale properties decreased 3% while the median price of sold properties increased 2%.
- The number of for-sale properties increased 20% while the number of sold properties increased 50%.
- The average months of inventory increased 104%, from 5.5 months in June 2009 to 11.2 months in June 2010.
The median price of for sale properties increased 3% from June 2009 to June 2010, while the median price of sold properties rose 12%. The number of for sale properties decreased 1% while the number of sold properties remained the same. Additionally, the average months supply of inventory was up 52% from June 2009 to June 2010.
The document compares housing market data from June 2009 to June 2010 in Providence Village. It finds that the median price of for-sale properties increased 2% while the median price of sold properties decreased 16%. The number of for-sale properties rose 25% but the number of sold properties declined 65%. Additionally, the average months of inventory increased 106% from 3.5 to 7.2 months.
The document compares median home prices and housing inventory in June 2009 to June 2010 in Plano, Texas. It finds that the median price of for-sale homes was unchanged, while the median price of homes sold increased 11%. The number of for-sale homes rose 7% but the number of homes sold fell 19%. Finally, the average months of inventory increased 67%, indicating a shift to a buyers' market.
The document summarizes real estate data from June 2009 to June 2010 in McKinney, Texas. It states that the median price of for-sale properties decreased 7% while the median price of sold properties increased 5%. Additionally, the number of for-sale properties decreased 5% and the number of sold properties decreased 31%. Finally, the average months of inventory increased 75% from 4.3 months to 7.5 months.
The document contains information from a real estate report comparing housing market data from June 2009 to June 2010 in Richardson, Texas. It shows that:
- The median price of for-sale properties decreased 2% while the median price of sold properties increased 10% between June 2009 and June 2010.
- The number of for-sale properties increased 27% while the number of sold properties decreased 25% between June 2009 and June 2010.
- The average months supply of inventory, a measure of how long it will take to sell current for-sale inventory, increased 253% from June 2009 to June 2010.
The document summarizes real estate data from May 2009 to May 2010 in Savannah, Georgia. It shows that during this period:
- The median price of for-sale properties decreased 5% (from $162,445 to $155,000) while the median price of sold properties decreased 8% (from $139,900 to $129,000).
- The number of for-sale properties increased 26% (from 54 to 68 properties) while the number of sold properties increased 71% (from 7 to 12 properties).
- The average months of inventory increased 418% (from 3.8 months to 19.7 months).
Farmers Branch TX - June 2010 - Market ReportValarie Littles
The document compares housing market data from June 2009 to June 2010 in Farmers Branch, Texas. It reports that:
- The median price of for-sale properties increased 2% while the median price of sold properties increased 38%.
- The number of for-sale properties increased 5% while the number of sold properties also increased 5%.
- The average months of inventory increased 60%, rising from 4.5 months in June 2009 to 7.2 months in June 2010.
The median price of for-sale properties in May 2010 was down 2% from May 2009, while the median price of sold properties was down 7%. The number of for-sale properties was down 10% from May 2009 to May 2010, while the number of sold properties was up 3%. Additionally, the average months supply of inventory was up 74% from May 2009 to May 2010.
The document compares housing market data from June 2009 to June 2010 in Heath, Texas. It finds that the median price of for-sale properties decreased 2% while the median price of sold properties increased 14%. The number of for-sale properties rose 3% and the number of sold properties increased 73%. Additionally, the average months of inventory increased 49%.
The document compares housing market data from June 2009 to June 2010 in Murphy, Texas. It states that the median price of for-sale properties decreased 5% while the median price of sold properties increased 4%. The number of for-sale properties decreased 13% and the number of sold properties increased 19%. Additionally, the average months of inventory increased 39% from 3.5 to 4.8 months.
The document compares housing market data from June 2009 to June 2010 in Forney, Texas. It finds that the median price of for-sale properties decreased 1% while the median price of sold properties increased 10%. The number of for-sale properties increased 12% and the number of sold properties rose 2%. Additionally, the average months of inventory increased 38% from June 2009 to June 2010.
The median price of for-sale properties decreased 3% from May 2009 to May 2010, while the median price of sold properties decreased 10% over the same period. The number of for-sale properties decreased 14% from 143 in May 2009 to 123 in May 2010, while the number of sold properties increased 4% from 24 to 25 over the same period. Additionally, the average months supply of inventory, a measure of housing demand and supply balance, increased 36% from 5.3 months in May 2009 to 7.2 months in May 2010.
The document compares housing data from May 2009 to May 2010 in The Colony, Texas. It states that the median price of for-sale properties was unchanged, while the median price of sold properties increased 6%. The number of for-sale properties decreased 16% while the number of sold properties rose 4%. Additionally, the average months of inventory increased 93% from 3.7 to 7.1 months.
The document compares housing market data from May 2009 to May 2010 in Rockwall, Texas. It finds that the median price of for-sale properties increased 2% while the median price of sold properties rose 6%. The number of for-sale properties decreased 2% whereas the number of sold properties was up 22%. Additionally, the average months of inventory increased 25% from May 2009 to May 2010.
The median price of for-sale properties in March 2010 was down 8% from March 2009, while the median price of sold properties was up 3%. The number of for-sale properties was down 6% from March 2009 to March 2010, and the number of sold properties was down 1%. The document provides data on median prices and number of units for both for-sale and sold residential properties in Allen, Texas from March 2009 to March 2010.
The document compares housing data from April 2009 to April 2010 in The Colony. It shows that the median price of for-sale properties decreased 2% while the median price of sold properties increased 10%. The number of for-sale properties increased 6% while the number of properties sold decreased 25%. Additionally, the average months supply of inventory, a measure of housing demand and supply balance, increased 43% from April 2009 to April 2010.
The document compares real estate data from March 2009 to March 2010 in Carrollton. It shows that:
- The median price of for-sale properties increased 6% while the median price of sold properties rose 3%.
- The number of for-sale properties grew 17% while the number of sold properties declined slightly by 2%.
- The average months of inventory decreased 15% from 4.1 months in March 2009 to 3.5 months in March 2010.
The median price of for-sale properties in May 2010 was up 1% from May 2009, while the median price of sold properties was down 8%. The number of for-sale properties decreased 7% from May 2009 to May 2010, while the number of sold properties increased 9%. Additionally, the average months supply of inventory increased 52% from May 2009 to May 2010.
The document compares housing market data from May 2009 to May 2010 in Farmers Branch, Texas. It states that the median price of for-sale properties increased by 8%, while the median price of sold properties decreased by 5%. The number of for-sale properties rose by 13%, but the number of sold properties fell by 9%. Additionally, the average months of inventory increased by 85% from 4.3 months to 7.9 months.
The document summarizes real estate data from May 2009 to May 2010 in Plano, Texas. It states that the median price of for-sale properties decreased 2% from May 2009 to May 2010, while the median price of sold properties increased 6% in that period. The number of for-sale properties decreased 0% while the number of sold properties decreased 10%. Additionally, the average months of inventory increased 99% from May 2009 to May 2010.
The median price of for-sale properties in May 2010 was up 2% from May 2009, while the median price of sold properties was up 1%. The number of for-sale properties was down 11% from May 2009 to May 2010, while the number of sold properties was up 27%. The average months of inventory increased 49% from May 2009 to May 2010.
The document contains real estate data for Providence Village from May 2009 to May 2010. It shows that:
- The median price of for-sale properties was unchanged (up 0%), while the median price of sold properties rose 12% from May 2009 to May 2010.
- The number of for-sale properties increased 5% while the number of properties sold rose 120% over the same period.
- The average months of inventory increased 367% from May 2009 to May 2010, rising from 3.3 months to 15.2 months.
The document compares housing market data from May 2009 to May 2010 in Carrollton, Texas. It shows that the median price of for-sale properties was unchanged, while the median price of sold properties decreased by 4%. The number of for-sale properties decreased by 2% and the number of sold properties also decreased by 2%. Additionally, the average months of inventory increased by 84% from 4.1 months to 7.6 months.
Carrollton TX - Housing Market Report - August 2010Valarie Littles
The document compares housing market data from August 2009 to August 2010 in Carrollton, Texas. It finds that the median price of homes for sale increased 3% while the median price of homes sold increased 5%. The number of homes for sale grew 16% from August 2009 to August 2010 while the number of homes sold declined 34% over the same period.
This document provides tips and resources for teachers to use social media, including Twitter, blogging, and visual storytelling. For Twitter, it recommends participating in chats, sharing classroom moments, and engaging respectfully. For blogging, it suggests focusing on passion and including others' voices. For visual storytelling, it offers tips like starting with the ending, using text and details in photos/videos, and focusing audio quality for videos. Several teacher profiles are also included for each platform.
This document promotes a company called Everlifestyle Sdn. Bhd. that sells drinking water systems to filter and purify water for entire homes. The company is located in Penang, Malaysia and can be contacted through their website at www.waterfilterpenang.com or by phone at 04-538 5590 or email at info@everlifestyle.com.
This document discusses a research project that implemented a choice reading program in an 11th and 12th grade English classroom to address issues like "fake reading" and help students become authentic readers. The context provides demographics of the 487 student school. Research questions explore how choice reading helps students become authentic readers and what this looks like. Problems addressed are fake reading and "readicide". The purpose is to explore ownership of reading lives, share research, and refine teaching practice. Implementation involved ending fake reading, modeling a reading life, setting up a library, book talks, and reading conferences. Observations found ownership matters, variety of books helps, and a connection between reading and writing. Final thoughts discuss balancing choice and whole-class texts
The events of the last two years constitute more than an economic recession. Rather, they shape a global realignment -- "The New Normal." This position papers describes four fundamental areas where change has occurred in society and provides recommended responses for service brands and service marketers.
This document summarizes key topics from a presentation on eDiscovery issues for 2011, including: 1) machine review is becoming more common and the EDRM model may be outdated; 2) cloud computing and social media present new challenges for eDiscovery; and 3) proportionality and cooperation between parties, as advocated in the Sedona Cooperation Proclamation, will be important issues to address in 2011. Sanctions for failures to properly conduct eDiscovery were also discussed.
The document compares housing market data from June 2009 to June 2010 in Corinth, Texas. It states that the median price of for-sale properties decreased 3% while the median price of sold properties increased 5%. The number of for-sale properties decreased 2% and the number of sold properties decreased 21%. Additionally, the average months of inventory increased 91% from 4.3 to 8.2 months.
The document compares housing market data from June 2009 to June 2010 in Little Elm, Texas. It finds that the median price of for-sale properties was unchanged, while the median price of sold properties rose 14%. The number of for-sale properties increased 9% while the number of sold properties declined 34%. Additionally, the average months of inventory increased 33% from June 2009 to June 2010.
- The median price of for-sale properties increased 2% from June 2009 to June 2010, while the median price of sold properties decreased 24% over the same period.
- The number of for-sale properties increased 19% from June 2009 to June 2010, while the number of sold properties increased 50% over the same period.
- The average months supply of inventory, a measure of housing demand and supply balance, increased 69% from June 2009 to June 2010.
The median price of for-sale properties in March 2010 was down 2% from March 2009, and the median price of sold properties was down 3%. The number of for-sale properties was down 3% from March 2009 to March 2010, while the number of sold properties was down 9%. The document provides data on housing prices and supply/demand in the city of Frisco from March 2009 to March 2010.
- The median price of for-sale properties increased 1% from May 2009 to May 2010, while the median price of sold properties decreased 9% over the same period.
- The number of for-sale properties decreased 5% from May 2009 to May 2010, while the number of sold properties increased 45% over the same period.
- The average months supply of inventory, a measure of how long it will take to sell current for-sale inventory, increased 140% from May 2009 to May 2010.
The document compares housing market data from May 2009 to May 2010 in Addison, Texas. It shows that the median price of for-sale properties increased 2% while the median price of sold properties decreased 3%. The number of for-sale properties increased 16% while the number of sold properties remained the same. Additionally, the average months of inventory increased 21%.
The median price of for-sale properties in May 2010 was down 5% from May 2009, and the median price of sold properties was down 3%. The number of for-sale properties was down 2% from May 2009 to May 2010, while the number of sold properties was down 6%. Additionally, the average months supply of inventory was up 7% from May 2009 to May 2010.
The median price of for-sale properties in March 2010 was down 5% from March 2009, while the median price of sold properties was up 11%. The number of for-sale properties decreased by 8% from March 2009 to March 2010, and the number of sold properties decreased by 6% over the same period.
The document compares median home prices and housing inventory from April 2009 to April 2010 in Mckinney, Texas. It finds that the median price of homes for sale decreased 5% while the median price of homes sold increased 2%. The number of homes for sale decreased 8% and the number of homes sold decreased 6%. Additionally, the average months of inventory decreased 12%.
The median price of for-sale properties in May 2010 was down 11% from May 2009, while the median price of sold properties was up 20%. The number of for-sale properties increased 2% from 168 in May 2009 to 171 in May 2010, while the number of sold properties remained unchanged at 9. The average months supply of inventory decreased 53% from 20.9 months in May 2009 to 9.8 months in May 2010.
The document contains information from a real estate report comparing housing market statistics from May 2009 to May 2010 in Richardson, Texas. It states that the median price of for-sale properties decreased 2% from May 2009 to May 2010, while the median price of sold properties decreased 7% in that period. Additionally, the number of for-sale properties increased 17% from May 2009 to May 2010, while the number of sold properties decreased 7%. Finally, the average months supply of inventory, a measure of housing demand and supply, increased 144% from May 2009 to May 2010.
The median price of for sale properties increased 1% from May 2009 to May 2010, while the median price of sold properties increased 7% over the same period. The number of for sale properties decreased 1% from 328 to 326 properties, while the number of sold properties decreased 27% from 48 to 35 properties sold. Additionally, the average months supply of inventory, a measure of housing demand and supply balance, increased 77% from 4.8 months in May 2009 to 8.4 months in May 2010.
Similar to The Colony - June 2010 Market Report (12)
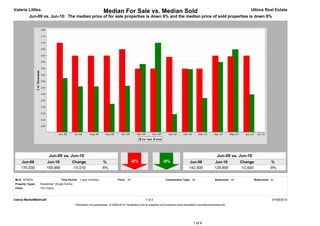
The document compares housing market data from March 2010 to March 2011 in The Colony, Texas. It finds that the median price of for-sale properties was unchanged, while the median price of sold properties declined 17%. The number of for-sale properties increased 12% from March 2010 to March 2011, while the number of properties sold declined 62% over the same period.
The document compares real estate data from March 2010 to March 2011 in Rockwall, Texas. It finds that the median price of for-sale properties decreased 4% while the median price of sold properties decreased 13%. Additionally, the number of for-sale properties decreased 5% and the number of sold properties decreased 41%. The average months of inventory increased 12% from March 2010 to March 2011.
The document compares real estate data from March 2010 to March 2011 in McKinney, Texas. It finds that the median price of for-sale properties decreased 5% while the median price of sold properties increased 4%. Additionally, the number of for-sale properties decreased 8% and the number of properties sold decreased 34%. Finally, the average months of inventory increased 19% from March 2010 to March 2011.
Plano TX - Feb/March 2011 - Housing Market ReportValarie Littles
The document compares housing market data from March 2010 to March 2011 in Plano, Texas. It finds that the median price of for-sale properties decreased 2% while the median price of sold properties increased 1%. Additionally, the number of for-sale properties decreased 6% and the number of properties sold decreased 15% from one year ago.
Little Elm - Feb/March 2011 - Housing Market ReportValarie Littles
The document compares real estate data from March 2010 to March 2011 in Little Elm, Texas. It finds that the median price of for-sale properties decreased 2% while the median price of sold properties decreased 13%. The number of for-sale properties increased 3% while the number of properties sold decreased 46%.
The document compares real estate data from March 2010 to March 2011 in Heath, Texas. It shows that the median price of for-sale properties increased 2% while the median price of sold properties decreased 11%. The number of for-sale properties increased 2% and the number of sold properties increased 33%. Additionally, the average months of inventory decreased 13% from March 2010 to March 2011.
The document contains two tables comparing housing market data from March 2010 to March 2011 in a certain region:
1) The median price of for-sale properties decreased 10% while the median price of sold properties increased 2%.
2) The number of for-sale properties increased 30% while the number of properties sold decreased 80%.
The document compares real estate market data from March 2010 to March 2011 in Frisco, Texas. It shows that the median price of for-sale properties was unchanged, while the median price of sold properties decreased slightly. The number of for-sale properties decreased 10% from March 2010 to March 2011, while the number of properties sold decreased more sharply at 40%.
The document summarizes real estate data from March 2010 to March 2011 in Forney, Texas. It shows that the median price of for-sale properties decreased 3% from March 2010 to March 2011, while the median price of sold properties decreased 12%. The number of for-sale properties increased 5% while the number of sold properties decreased 34%. Additionally, the average months of inventory increased 2% from March 2010 to March 2011.
The document compares real estate data from March 2010 to March 2011 in Carrollton, Texas. It finds that the median price of for-sale properties decreased 3% from $179,000 to $173,950, while the median price of sold properties decreased 1% from $164,750 to $163,500. The number of for-sale properties increased 12% from 563 to 630, while the number of properties sold decreased 44% from 98 to 55.
Allen TX - Feb/March 2011 - Housing Market ReportValarie Littles
The document contains real estate data for Allen, Texas from March 2010 to March 2011. It shows that:
1) The median price of homes for sale increased 2% from March 2010 to March 2011, while the median price of homes sold increased 6%.
2) The number of homes for sale decreased 7% from March 2010 to March 2011, while the number of homes sold decreased 35% over the same period.
3) Both the supply of homes for sale and demand as measured by homes sold declined from March 2010 to March 2011 in Allen, Texas according to the data presented.
The document compares real estate data from March 2010 to March 2011 in Rowlett, Texas. It finds that the median price of for-sale properties decreased 1% while the median price of sold properties increased 1%. The number of for-sale properties decreased slightly by 0% while the number of properties sold decreased more sharply by 38%. Finally, the average months of inventory increased by 32% from 3.9 to 5.1 months.
Allen TX - January 2011 - Housing Market ReportValarie Littles
The document compares housing market data from January 2010 to January 2011 in Allen, Texas. It finds that:
- The median price of homes for sale decreased 5% while the median price of homes sold increased 6% between January 2010 and January 2011.
- The number of homes for sale increased 7% while the number of homes sold increased 5% between January 2010 and January 2011.
Plano TX - January 2011 - Housing Market ReportValarie Littles
The median price of for-sale properties in January 2011 was down 7% from January 2010, while the median price of sold properties was up 6%. The number of for-sale properties increased 11% from January 2010 to January 2011, and the number of sold properties was up 17%. Additionally, the average months supply of inventory was up 27% in January 2011 compared to January 2010.
Forney TX - January 2011 - Housing Market ReportValarie Littles
The document summarizes real estate data from January 2010 to January 2011 for Forney, Texas. It shows that the median price of for-sale properties decreased 11% from January 2010 to January 2011, while the median price of sold properties decreased 18%. Additionally, the number of for-sale properties increased 15% from January 2010 to January 2011, while the number of sold properties decreased 21% over the same period.
Rowlett TX - January 2011 - Housing Market ReportValarie Littles
The document compares real estate data from January 2010 to January 2011 in Rowlett, Texas. It finds that the median price of for-sale properties decreased 6% while the median price of sold properties increased 14%. Additionally, the number of for-sale properties increased 17% while the number of properties sold decreased 8%.
Rockwall TX - January 2011 - Housing Market ReportValarie Littles
The document compares housing market data from January 2010 to January 2011 in Rockwall, Texas. It finds that the median price of homes for sale decreased 9% from $219,500 to $200,000 over this period, while the median price of homes sold decreased 6% from $180,250 to $170,000. The number of homes for sale increased 7% from 417 to 447 properties, while the number of homes sold decreased 13% from 30 to 26 properties over the same period.
Rowlett TX - January 2011 - Housing Market ReportValarie Littles
The document compares real estate data from January 2010 to January 2011 in Rowlett, Texas. It finds that the median price of for-sale properties decreased 6% while the median price of sold properties increased 14%. Additionally, the number of for-sale properties increased 17% while the number of properties sold decreased 8%.
Richardson TX - January 2011 - Housing Market ReportValarie Littles
The document compares housing market data from January 2010 to January 2011 in Richardson, Texas. It shows that the median price of for-sale properties was unchanged, while the median price of sold properties decreased by 17%. The number of for-sale properties increased by 33%, while the number of properties sold decreased by 33%.
McKinney TX - January 2011 - Housing Market ReportValarie Littles
The number of properties for sale increased 4% from January 2010 to January 2011, while the number of properties sold increased 1%. The average months of inventory, which measures the supply and demand of properties, increased 3% from 4.9 months in January 2010 to 5.0 months in January 2011.
Listing Turkey - Piyalepasa Istanbul CatalogListing Turkey
We are working around the clock to transform a long-time dream into reality. As a result, Piyalepasa Istanbul will be the largest privately developed urban regeneration project in Turkey.
THE NEIGHBORHOOD WE HAVE BEEN LONGING FOR IS COMING TO LIFE
The good old days of the Piyalepasa neighborhood are being brought back to life with Piyalepasa Istanbul houses, residences, offices, hotels and a pedestrianized shopping avenue.
The wide streets of this 82.000 square meter development conveniently face the main boulevard in a prime Beyoglu location. “Piyalepaşa İstanbul” stands out as the only project designed to offer a neighborhood lifestyle, complete with its grocers, bagel sellers and greengrocer. Piyalepasa Istanbul has all the values to make it an authentic neighborhood, our very own community.
A NEIGHBORHOOD FULL OF LIFE, IN THE HEART OF THE CITY!
“Piyalepaşa İstanbul” is a “mixed-use” concept containing all the elements for a vibrant social life with houses, residences, offices, hotels and high street shopping.
“Piyalepaşa İstanbul” will take the liveliness of Istanbul into its heart. The elegant sparkle of Nisantasi, the young and colorful Besiktas, the variety and multicultural heritage of Istiklal Street will all be contained within the streets of this neighborhood.
“Piyalepaşa İstanbul” bears traces of the most beautiful examples of Turkish architecture from the Seljuks to the Ottomans and from Anatolia to Rumelia. With its graded facades, wide eaves, bay windows, pools, and interior courtyard systems, it offers a new living space without disrupting the city’s silhouette and neighborhood.
“Piyalepaşa İstanbul” is the new attraction of this splendid city.
TO BE AT THE CENTER OF ISTANBUL… THIS IS REAL LUXURY!
With its proximity to D-100 highway, connecting roads and tunnels, “Piyalepaşa İstanbul” is only minutes away from Kabatas, Besiktas, the Golden Horn and Karakoy.
“Piyalepaşa İstanbul” is close to the prestigious new Istanbul Court House, a major hospital, the Perpa trade center and the city’s most lively neighborhoods. With its shuttle service to Okmeydani Metrobus station, Sishane and the Court House subway stations, “Piyalepaşa İstanbul” will provide you with the most convenient transport connections.
https://listingturkey.com/property/piyalepasa-istanbul/
Anilesh Ahuja Pioneering a Paradigm Shift in Real Estate Success.pptxneilahuja668
Anilesh Ahuja journey is a testament to the power of vision, resilience, and unwavering determination. As a visionary leader, he continues to inspire and empower others to dream big and challenge the status quo. His legacy extends far beyond the realm of real estate, leaving an indelible mark on the industry and the world at large.
Signature Global TITANIUM SPR | 3.5 & 4.5BHK High rise Apartments in Gurgaonglobalsignature2022
Signature Global TITANIUM SPR launched a high rise apartments in Gurgaon . In this project Signature Global offers 3.5 & 4.5 BHK high rise Apartment at sector 71 Gurgaon SPR Road. Signature Global Titanium SPR is IGBC Gold certified, a testament to our commitment to sustainability.
Stark Builders: Where Quality Meets Craftsmanship!shuilykhatunnil
At Stark Builders our vision is to redefine the renovation experience by combining both stunning design and high quality construction skills. We believe that by delivering both these key aspects together we are able to achieve incredible results for our clients and ensure every project reflects their vision and enhances their lifestyle.
Although we are not all related by blood we have created a team of highly professional and hardworking individuals who share the common goal of delivering beautiful and functional renovated spaces. Our tight nit team are able to work together in a way where we pour our passion into each and every project as we have a love for what we do. Building is our life.
Living in an UBER World - June '24 Sales MeetingTom Blefko
June 2024 Lancaster County Sales Meeting for Berkshire Hathaway HomeServices Homesale Realty covering the following topics: 1. VA Suspends Buyer Agent Payment Plan (article), 2. Frequently Used Terms in title, 3. Zillow Showcase Overview, 4. QuickBuy commission promotion, 5. Documenting Cooperative Compensation, 6. NAR's Code of Ethics - Mass Media Solicitations, 7. Is it really cheaper to rent? 8. Do's and Don't's when Terminating the Agreement of Sale, 9. Living in an UBER World
36,778 sq. ft. building; Zoning: SE (Suburban Employment): The (SE) District allows numerous commercial site uses; Passenger elevator; Private and common restrooms; Fully sprinkled; Data center with a grounded floor and a specialized HVAC system; 60 KVA back-up generator; Building/pylon signage; Potential to purchase adjacent parcels; Sale Price: $4,413,360
The SVN® organization shares a portion of their new weekly listings via their SVN Live® Weekly Property Broadcast. Visit https://svn.com/svn-live/ if you would like to attend our weekly call, which we open up to the brokerage community.
Why is Revit MEP Outsourcing considered an as good option for construction pr...MarsBIM1
Outsourcing MEP modeling services require effective collaboration and coordination amongst multiple engineering trades. The engineers and the designers often change the details of the MEP projects, but the work of Revit MEP drafting services is having the master plan and model of the complete project. To have proper coordination and installation, there is a need to execute the project effectively. Hence, the work of Revit family creation facilitates the MEP engineers.
Andhra Pradesh, known for its strategic location on the southeastern coast of India, has emerged as a key player in India’s industrial landscape. Over the decades, the state has witnessed significant growth across various sectors,