Revisiting the 1963_aristarchus_events
•
1 like•2,306 views

This document discusses two famous observations of Transient Lunar Phenomena (TLP) known as the "1963 Aristarchus events" that were observed at Lowell Observatory. It provides background on the USAF lunar mapping program that was underway in the 1960s to support the Apollo program. The most experienced observers in this program, James Clarke Greenacre and William D. Cannell, observed glowing reddish spots on the Aristarchus Plateau on the Moon in late 1963. The document reexamines these observations 50 years later to clarify details and discuss whether they represented real lunar phenomena or observational artifacts.
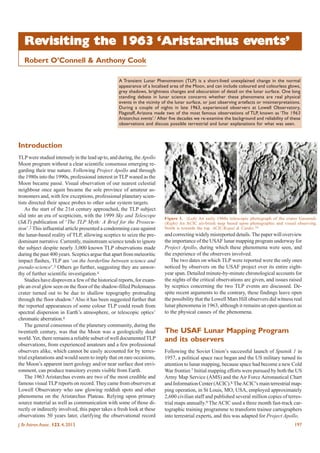
![O’Connell & Cook: Revisiting the 1963 ‘Aristarchus events’
Figure 2. (Left) The Lowell Observatory
24-inch [60cm] Alvan Clark f/16 refractor is one of the world’s finest planetary
refractors. Note 6-inch finder and 12-inch
guide scopes. Lowell Observatory Archives.
(Above) Lunar cartographer-observer
William D. Cannell at the eyepiece of the
24-inch Clark adding details to a base photo
for Lunar Aeronautical Chart (LAC-75),
‘Letronne.’ Popular Astronomy.
Initially, their lunar charting relied upon Earth-based telescopic
photographs, but these proved of insufficient resolution for the
Apollo cartographic requirements. However the then director of
Yerkes Observatory, Gerard P. Kuiper, realised that atmospheric
seeing would both distort and blur the relatively long photographic
exposures, whereas the human eye could glimpse appearances as
short as 1/20th of a second, or better, and detect detail 2 to 3 times
sharper.10 To prove this, Kuiper invited ACIC cartographers to the
40-inch [100cm] Yerkes refractor to draw the lunar surface. Figure 1
is a comparison of one of the best available lunar photographs at
the time and an airbrushed ACIC sample map produced by incorporating details seen visually at the eyepiece.
The ACIC decided to use the 24-inch [60cm] f/16 Alvan Clark
planetary refractor at Lowell Observatory, which provided resolution of small lunar features that seemed to be at least as good as
the 40-inch Yerkes at a location with fewer cloudy nights and adequate supporting facilities. During times of best seeing, observers using the Clark refractor could detect (albeit not resolve) objects as small as 200 metres in size and surpassed easily the best
photographic resolution at that time. ACIC cartographer William
D. Cannell was asked to establish and manage the lunar mapping
program through negotiations with Lowell’s director, John S. Hall.
(See Figure 2).
The idea of a USAF lunar mapping program for NASA’s Project
Apollo based at Lowell was compatible with Hall’s desire to establish his observatory as a world-class institution and he became
involved directly in starting the programme at the observatory.
Cannell summarised the mapping process as follows: ‘The observer works at the telescope with the rectified photos sent from
St Louis overlaid with tracing paper. As he observes new features
and intricate details, he carefully traces them on the overlay’.11
Adding details to photographs is a mapping technique borrowed
from classical selenography, developed by Bavarian draftsman and
198
amateur astronomer Johann N. Krieger
(1865−1902) and others. It was also realised
that having observations from as many different lighting conditions as possible would
improve the accurate representation of features on the lunar surface. The final Lunar
Aeronautical Charts (LAC) were the responsibility of scientific illustrators, using
new techniques pioneered by Patricia M.
Bridges who combined the observers’ telescopic observations with lunar photographic details via pen and airbrush to map
projected lunar charts.12
Cannell, having secured a location, telescope, support facilities, a mapping method
and close working partnership with Hall,
now turned his attention to the pressing
issue of finding suitable cartographic candidates for the lunar mapping program.
James Clarke Greenacre
Prior to his arrival at Lowell Observatory in
1961, James C. Greenacre had been an archaeologist who transitioned into military
cartography in 1942 with America’s entrance
into World War II. In 1943−1944, he supervised up to three hundred staff who were producing maps of Europe and North Africa,
culminating in highly classified work on translating foreign map
place names and the production of invasion route maps in preparation for D-Day. After the war he remained in cartography in several capacities and in 1957 began working for the ACIC in St Louis.
It was here he would be drawn into his third and final career as a
lunar cartographer, to provide vitally needed charts for Project
Apollo.13
At the ACIC St Louis headquarters in 1961, Cannell asked
Greenacre if he would like to join the fledgling USAF lunar mapping programme at Lowell. Greenacre expressed interest and was
asked quickly to produce a resumé and fill out the employment
application, which asked what the applicant knew about the Moon.
Greenacre later recalled he only put down two items − ‘Comes out
at night’ and ‘I wooed and won my wife under it’.14 Greenacre’s
self-effacing response was a humorous understatement as he was
certainly familiar with the Moon as, according to Greenacre, he
had earned 40 credit hours in astronomy while attending college
and seriously considered a degree in geodesy.15
In 1961 September, Greenacre packed up his family, moved to
Flagstaff, and began his lunar cartographic training under Cannell
He was the first to enter the ACIC’s lunar mapping training programme. He quickly developed visual observing skills, a good
operating knowledge of the Clark refractor, and the ability to chart
accurately lunar features through the eyepiece. The ACIC now
had a full-time presence at Lowell and Greenacre officially became
a charter member of the Apollo lunar mapping team. Greenacre was
instrumental in helping Cannell and Hall establish and maintain
many aspects of the programme. For example, he built the programme’s first modest dark room and became its first film and print
processor for lunar images taken through the Clark. He also, as did
Cannell, flew routinely to the University of Arizona’s Lunar and
J. Br. Astron. Assoc. 123, 4, 2013](data:image/gif;base64,R0lGODlhAQABAIAAAAAAAP///yH5BAEAAAAALAAAAAABAAEAAAIBRAA7)
More Related Content
What's hot
What's hot (20)
Similar to Revisiting the 1963_aristarchus_events
Similar to Revisiting the 1963_aristarchus_events (20)
More from Sérgio Sacani
More from Sérgio Sacani (20)
Recently uploaded
Recently uploaded (20)
Revisiting the 1963_aristarchus_events
- 1. Revisiting ‘Aristarchus events’ Revisiting the 1963 ‘Aristarchus events’ Robert O’Connell & Anthony Cook A Transient Lunar Phenomenon (TLP) is a short-lived unexplained change in the normal appearance of a localised area of the Moon, and can include coloured and colourless glows, grey shadows, brightness changes and obscuration of detail on the lunar surface. One long standing debate in lunar science concerns whether these phenomena are real physical events in the vicinity of the lunar surface, or just observing artefacts or misinterpretations. During a couple of nights in late 1963, experienced observers at Lowell Observatory, Flagstaff, Arizona made two of the most famous observations of TLP, known as ‘The 1963 Aristarchus events’.1 After five decades we re-examine the background and reliability of these observations and discuss possible terrestrial and lunar explanations for what was seen. Introduction TLP were studied intensely in the lead up to, and during, the Apollo Moon program without a clear scientific consensus emerging regarding their true nature. Following Project Apollo and through the 1980s into the 1990s, professional interest in TLP waned as the Moon became passé. Visual observation of our nearest celestial neighbour once again became the sole province of amateur astronomers and, with few exceptions, professional planetary scientists directed their space probes to other solar system targets. As the start of the 21st century approached, the TLP subject slid into an era of scepticism, with the 1999 Sky and Telescope (S&T) publication of ‘The TLP Myth: A Brief for the Prosecution’.2 This influential article presented a condemning case against the lunar-based reality of TLP, allowing sceptics to seize the predominant narrative. Currently, mainstream science tends to ignore the subject despite nearly 3,000 known TLP observations made during the past 400 years. Sceptics argue that apart from meteoritic impact flashes, TLP are ‘on the borderline between science and pseudo-science’.3 Others go further, suggesting they are unworthy of further scientific investigation.4 Studies have disproven a few of the historical reports, for example an oval glow seen on the floor of the shadow-filled Ptolemaeus crater turned out to be due to shallow topography protruding through the floor shadow.5 Also it has been suggested further that the reported appearances of some colour TLP could result from spectral dispersion in Earth’s atmosphere, or telescopic optics’ chromatic aberration.6 The general consensus of the planetary community, during the twentieth century, was that the Moon was a geologically dead world. Yet, there remains a reliable subset of well documented TLP observations, from experienced amateurs and a few professional observers alike, which cannot be easily accounted for by terrestrial explanations and would seem to imply that on rare occasions, the Moon’s apparent inert geology and/or near surface dust environment, can produce transitory events visible from Earth. The 1963 Aristarchus events are two of the most credible and famous visual TLP reports on record. They came from observers at Lowell Observatory who saw glowing reddish spots and other phenomena on the Aristarchus Plateau. Relying upon primary source material as well as communication with some of those directly or indirectly involved, this paper takes a fresh look at these observations 50 years later, clarifying the observational record J. Br. Astron. Assoc. 123, 4, 2013 Figure 1. (Left) An early 1960s telescopic photograph of the crater Gassendi. (Right) An ACIC air-brush map based upon photographic and visual observing. North is towards the top. ACIC/Kopal & Carder.10 and correcting widely misreported details. The paper will overview the importance of the USAF lunar mapping program underway for Project Apollo, during which these phenomena were seen, and the experience of the observers involved. The two dates on which TLP were reported were the only ones noticed by observers on the USAF project over its entire eightyear span. Detailed minute-by-minute chronological accounts for the nights of the critical observations are given, and issues raised by sceptics concerning the two TLP events are discussed. Despite recent arguments to the contrary, these findings leave open the possibility that the Lowell Mars Hill observers did witness real lunar phenomena in 1963, although it remains an open question as to the physical causes of the phenomena. The USAF Lunar Mapping Program and its observers Following the Soviet Union’s successful launch of Sputnik 1 in 1957, a political space race began and the US military turned its attention to lunar mapping, because space had become a new Cold War frontier.7 Initial mapping efforts were pursued by both the US Army Map Service (AMS) and the Air Force Aeronautical Chart and Information Center (ACIC).8 The ACIC’s main terrestrial mapping operation, in St Louis, MO, USA, employed approximately 2,600 civilian staff and published several million copies of terrestrial maps annually.9 The ACIC used a three month fast-track cartographic training programme to transform trainee cartographers into terrestrial experts, and this was adapted for Project Apollo. 197
- 2. O’Connell & Cook: Revisiting the 1963 ‘Aristarchus events’ Figure 2. (Left) The Lowell Observatory 24-inch [60cm] Alvan Clark f/16 refractor is one of the world’s finest planetary refractors. Note 6-inch finder and 12-inch guide scopes. Lowell Observatory Archives. (Above) Lunar cartographer-observer William D. Cannell at the eyepiece of the 24-inch Clark adding details to a base photo for Lunar Aeronautical Chart (LAC-75), ‘Letronne.’ Popular Astronomy. Initially, their lunar charting relied upon Earth-based telescopic photographs, but these proved of insufficient resolution for the Apollo cartographic requirements. However the then director of Yerkes Observatory, Gerard P. Kuiper, realised that atmospheric seeing would both distort and blur the relatively long photographic exposures, whereas the human eye could glimpse appearances as short as 1/20th of a second, or better, and detect detail 2 to 3 times sharper.10 To prove this, Kuiper invited ACIC cartographers to the 40-inch [100cm] Yerkes refractor to draw the lunar surface. Figure 1 is a comparison of one of the best available lunar photographs at the time and an airbrushed ACIC sample map produced by incorporating details seen visually at the eyepiece. The ACIC decided to use the 24-inch [60cm] f/16 Alvan Clark planetary refractor at Lowell Observatory, which provided resolution of small lunar features that seemed to be at least as good as the 40-inch Yerkes at a location with fewer cloudy nights and adequate supporting facilities. During times of best seeing, observers using the Clark refractor could detect (albeit not resolve) objects as small as 200 metres in size and surpassed easily the best photographic resolution at that time. ACIC cartographer William D. Cannell was asked to establish and manage the lunar mapping program through negotiations with Lowell’s director, John S. Hall. (See Figure 2). The idea of a USAF lunar mapping program for NASA’s Project Apollo based at Lowell was compatible with Hall’s desire to establish his observatory as a world-class institution and he became involved directly in starting the programme at the observatory. Cannell summarised the mapping process as follows: ‘The observer works at the telescope with the rectified photos sent from St Louis overlaid with tracing paper. As he observes new features and intricate details, he carefully traces them on the overlay’.11 Adding details to photographs is a mapping technique borrowed from classical selenography, developed by Bavarian draftsman and 198 amateur astronomer Johann N. Krieger (1865−1902) and others. It was also realised that having observations from as many different lighting conditions as possible would improve the accurate representation of features on the lunar surface. The final Lunar Aeronautical Charts (LAC) were the responsibility of scientific illustrators, using new techniques pioneered by Patricia M. Bridges who combined the observers’ telescopic observations with lunar photographic details via pen and airbrush to map projected lunar charts.12 Cannell, having secured a location, telescope, support facilities, a mapping method and close working partnership with Hall, now turned his attention to the pressing issue of finding suitable cartographic candidates for the lunar mapping program. James Clarke Greenacre Prior to his arrival at Lowell Observatory in 1961, James C. Greenacre had been an archaeologist who transitioned into military cartography in 1942 with America’s entrance into World War II. In 1943−1944, he supervised up to three hundred staff who were producing maps of Europe and North Africa, culminating in highly classified work on translating foreign map place names and the production of invasion route maps in preparation for D-Day. After the war he remained in cartography in several capacities and in 1957 began working for the ACIC in St Louis. It was here he would be drawn into his third and final career as a lunar cartographer, to provide vitally needed charts for Project Apollo.13 At the ACIC St Louis headquarters in 1961, Cannell asked Greenacre if he would like to join the fledgling USAF lunar mapping programme at Lowell. Greenacre expressed interest and was asked quickly to produce a resumé and fill out the employment application, which asked what the applicant knew about the Moon. Greenacre later recalled he only put down two items − ‘Comes out at night’ and ‘I wooed and won my wife under it’.14 Greenacre’s self-effacing response was a humorous understatement as he was certainly familiar with the Moon as, according to Greenacre, he had earned 40 credit hours in astronomy while attending college and seriously considered a degree in geodesy.15 In 1961 September, Greenacre packed up his family, moved to Flagstaff, and began his lunar cartographic training under Cannell He was the first to enter the ACIC’s lunar mapping training programme. He quickly developed visual observing skills, a good operating knowledge of the Clark refractor, and the ability to chart accurately lunar features through the eyepiece. The ACIC now had a full-time presence at Lowell and Greenacre officially became a charter member of the Apollo lunar mapping team. Greenacre was instrumental in helping Cannell and Hall establish and maintain many aspects of the programme. For example, he built the programme’s first modest dark room and became its first film and print processor for lunar images taken through the Clark. He also, as did Cannell, flew routinely to the University of Arizona’s Lunar and J. Br. Astron. Assoc. 123, 4, 2013
- 3. O’Connell & Cook: Revisiting the 1963 ‘Aristarchus events’ Planetary Laboratory, to deliver LAC proofs to G. P. Kuiper, D. W. G. Arthur and E. A. Whitaker for review and consultation.16 Greenacre and others continued telescopic mapping of the lunar surface until NASA’s high resolution Lunar Orbiter missions (1966−1967) made further visual observations unnecessary. Greenacre then assumed Cannell’s position as Acting Chief of the ACIC Lunar Observation Section at Lowell from 1967−1969, supervising refinements of lunar charts for Apollo landings based on Lunar Orbiter imagery.17 Greenacre oversaw the programme’s eventual closure in 1969 September and retired from the ACIC in St Louis, MO in 1973.18 In the early 1960s, Greenacre’s observing routine involved spending long hours at the eyepiece intensely scrutinising the lunar surface, interpreting its features through the Earth’s atmosphere and meticulously charting and documenting the observations. Given his military cartographic background, Greenacre quickly became a competent lunar observer. While not on a par with life-long lunar and planetary observers like Walter Haas, Clyde Tombaugh and Gene Cross, all three of whom reported their own TLP, by late 1963 Greenacre’s observing experience allowed him to recognise the normal appearance of the lunar surface, and also when atmospheric effects and optical aberrations of the Clark were affecting the image appearance.19 Based on that experience, as will be seen, he concluded the phenomena that he, and others, saw in October and November 1963 had to be lunar in origin. Greenacre’s TLP observations were published, with approval of the USAF, in the 1963 December Sky and Telescope, in the proceedings of a symposium on lunar geological problems in 1964 May at the New York Academy of Sciences, and in a 1964 May USAF report, Lunar Color Phenomena. In the autumn of 1965, he gave a presentation at a National Academy of Sciences lunar symposium at the Jet Propulsion Laboratory, California Institute of Technology, Pasadena, CA. Aware of the controversial nature of TLP reports originating from his observatory, John Hall wrote the following in a supplement to Greenacre’s 1963 Dec article ‘A Recent Observation of Lunar Color Phenomena’ published in S&T: ‘As director of Lowell Observatory, I wish to supply some additional information related to the Greenacre−Barr observation... In evaluating the reliability of any visual observation, the attitude and qualifications of the observer are most important. Greenacre is a very cautious observer. He had long been sceptical of reported changes on the lunar surface, and consequently found it difficult at first to believe what he was seeing. As to his observing reliability, Cannell has stated that he could not recall that Greenacre had ever plotted a lunar feature not later confirmed by some other observer’.20 There are however a couple of inaccuracies widely mis-reported about Greenacre. Firstly he was sometimes referred to as ‘Dr Greenacre’, and secondly that he was an astronomer. He did not have a doctorate in astronomy nor was he a trained observational astronomer, but nevertheless was a highly trained and experienced observational lunar cartographer. Others acknowledged Greenacre’s abilities in this capacity and the value of his TLP reports.21 Ewen Whitaker (Private communication 2011) recalls meeting Greenacre at the University of Arizona, Tucson, to discuss the TLP sightings with Kuiper and commented ‘He struck all of us as being a calm and level headed person, with absolutely no thoughts of self-aggrandisement. He was as baffled as we were what the explanation might be. He had more hours of observing the Moon than any of us did, being his main job since 1961, and obviously knew all the phenomena caused by seeing and other atmospheric disturbances. So we concluded that the observations were genuine, but couldn’t explain them’ (Private communication, A. Cook, 2011).22 Based on a review of correspondence following the TLP reports (catalogued online in the Lowell Observatory Archives as of 2012 April), one finds no challenge or criticism to Greenacre’s experience, competence or credibility as an observer, with the exception of UFO cultists. The latter, and subsequent tabloid newspaper stories have given very unfavourable spin to the unique 1963 observations.23 Edward M. Barr Edward M. Barr was one of two additional observer-cartographers taken on. He graduated in 1963 with a BA in geography and worked initially in the Department of Geography at the University of Washington. Barr applied for a position as a lunar cartographer in 1963 May.24 In response to Hall’s inquiry about his eyesight and whether he had stereoscopic vision or was colour blind, Barr wrote the following response, ‘My vision is 20/200, corrected to 20/20 (with eyeglasses), and I have never been troubled with any type of visual defect. While taking classes in geomorphology, I developed the ability to visualize stereo pairs of aerial photographs, but I have had little occasion to do so for the past two years.’25 Hall hired Barr as a Lowell employee under a contract with the ACIC and he arrived in Flagstaff in early August to begin his fasttrack lunar training program under Greenacre’s mentorship.26 Upon completing training, Barr was assigned LAC chart 38, ‘Seleucus’, adjacent to and immediately west of Greenacre’s LAC-39 ‘Aristarchus’. The two observers shared the telescope routinely and coordinated observations. Barr, like Greenacre, did not believe in TLP until the night of 1963 Oct 30, and because he had completed his three month training, was experienced enough to recognise the spuriFigure 3. (Left) First ACIC dedicated full-time lunar cartographer-observer James C. Greenacre (1914−1994) at the 24-inch Clark refractor. William D. Cannell, ACIC, courtesy Greenacre family. (Right) ACIC lunar ous effects produced by the atmosphere cartographer-observer Edward M. Barr (b. 1939). William D. Cannell, ACIC. and optics. Attempts to contact Mr Barr J. Br. Astron. Assoc. 123, 4, 2013 199
- 4. O’Connell & Cook: Revisiting the 1963 ‘Aristarchus events’ southeast of Flagstaff, using a 69" [175cm] Perkins reflector, and were brought in to help confirmation of the TLP on night 2. 1963 October 30 − night one Figure 4. (Left) John S. Hall (1908−1991) the director of Lowell Observatory from 1958 to 1977. Lowell Observatory Archives. (Right) ACIC scientific illustrator Fred Dungan working on the area covered by LAC-95, ‘Purbach.’ ACIC. have been unsuccessful and according to Greenacre’s son, J. E. Greenacre Jr., it is believed he may have passed away some time ago (Private communication 2010). Fred Dungan Fred Dungan was a cartographer and scientific illustrator, transferred from the ACIC’s St Louis operations to Lowell in 1962 to join Patricia Bridges in the mapping programme (See Figure 4). Efforts to locate Dungan have been unsuccessful but J. E. Greenacre, Jr. recalled: ‘I knew Fred and his brother Tom well, they were twins. They worked at the ACIC office at Lowell. My memory of Fred was that he was very precise, I mean he laughed and things but he was very serious, detailed and very precise in his work’ (Private communications 2010−2011). The US Air Force report on the 1963 Aristarchus TLPs noted that Dungan ‘has had a good many hours of telescopic observing and is highly qualified in interpreting color and forms. He is also very familiar with the Aristarchus plateau and its many features’.27 Given his visual observing experience and familiarity with the Aristarchus Plateau, Dungan served as a reliable second witness to the 1963 November 28 TLP episode. John S. Hall John Hall was named Director of Lowell Observatory in 1958 and remained in that position for 19 years. Aside from his duties as observatory director, he had been researching the polarisation of extragalactic objects for several years and had carried out little lunar observing (See Figure 4). But, he was plainly able to see and verify the colours and so served as the fourth reliable witness to the November TLP episode. Peter Boyce and Kent Ford Peter Boyce was still a graduate student at Lowell within a month of completing his PhD thesis from the University of Michigan. Boyce was not a member of the ACIC mapping team and by his own admission was not an experienced lunar observer (Private communication 2010). Kent Ford (b. 1931) was a Carnegie Institute astronomer. Both astronomers were sited at the Anderson Mesa observatory, 24km 200 01:30 UT: in the early evening Greenacre started working at the Clark 24" refractor eyepiece on the finishing touches to a proof copy of the LAC-39 covering the Aristarchus, Prinz, Herodotus, Vallis Schröteri region (30°−50°W, 16°−32°N, IAU). The sky was clear apart from a few high cirrus clouds. The meteorological measurements from nearby Flagstaff Pulliam airport suggested that the observing conditions were ideal, although the Moon was initially only 25° above the horizon. A zoom eyepiece, providing about ~430×−1050× magnification, was used in conjunction with a yellow-orange Wratten 15 filter during his observation – the latter was standard procedure to minimise any chromatic aberration effects in the two-element achromatic refractor. Although the magnification range seems high, this is normal for a refractor of this size. The ACIC seeing scale, specifically for lunar charting purposes through the Clark, was 0−10 with 0 being a ‘useless image that cannot be focused’ to 10 ‘the perfect image’. Cannell noted ‘The visual work is often severely handicapped by seeing conditions’ and that a 5−6 range rated ‘very good’ but which observers only enjoyed about ‘one-fourth’ of the time. The majority of the time, according to Cannell, seeing was in the 0−4 range and lunar charting was routinely conducted under poor seeing no better than 3−4. Under these conditions the observers ‘normally use a magnifying power of 500×’ while adjusting the Clark’s aperture from 24 to 6 inches using a diaphragm over the objective with a knob proximal to the eyepiece.28 Initially, Greenacre reported the seeing ‘about 2’ and he set the magnification to its lowest possible setting, ~430×. After a few minutes, the seeing had improved to moments of 3−4 so he was then able to push the magnification up to ~500×.29 Greenacre initially concentrated on the Cobra Head area at the mouth of Vallis Schröteri ‘hoping to refine this area of the chart with further details’. The Sun’s selenographic colongitude was 60.2° and the solar altitude ranged from 10.2° at the centre of Herodotus to 12.3° at the centre of Aristarchus at 01:30 UT. The Moon’s appearance for Greenacre would have resembled Figure 5, although the libration aspect would have been more favourable for observation of the area. 01:30−01:50 UT: Greenacre carried on charting whilst the Moon − rose from 25° to 29° above the horizon and noticed everything looked normal, despite the less than average seeing conditions during this 20 minute period. Figure 5. Image of area closely matching the solar illumination present during the 1963 October 30 TLP episode. The images for this composite were taken on 2011 April 15 between 21:13−21:17 UT by Bev Ewen –Smith (COAA, Portimão, Portugal). North is at the top (IAU). Image has been separated into R.G.B components, corrected for atmospheric spectral dispersion, reconstituted into a colour image, sharpened, colours normalised and then underwent a saturation boost to enhance natural surface colour. J. Br. Astron. Assoc. 123, 4, 2013
- 5. O’Connell & Cook: Revisiting the 1963 ‘Aristarchus events’ 01:50−01:55 UT: Greenacre’s attention was drawn to a − reddish-orange colour that was forming over the domelike structure near the southwest side of the Cobra Head. Almost simultaneously he saw a second smaller spot of the same colour appear (01:50−01:52UT) on a small hill across the valley to the east of Vallis Schröteri. These TLP are referred to as R1 & R2 in Figure 6. R1 appeared to be oval, ~2.5km × 8km and R2 was smaller at ~2.5km in diameter. Regular lunar charting came to a standstill. Within two minutes these colours became quite obvious and had some ‘sparkle’ to them that, based on subsequent clarifications by Greenacre, may not have been seeing related. Although published accounts, from different sources, are conflicting about the sparkling nature and direction of motion, a careful reading suggests that there were two patterns of barely resolvable rapidly flowing white spots. Those seen at R1 were flowing off to the west towards the terminator while those at R2 were apparently flowing to the north and east in a ‘radial pattern’. The flowing spots at both locations were reported as having a ‘downward flow motion’ over the lunar topography. There was clear evidence that these two regions also appeared to obscure underlying surface detail. Edward Barr was able to confirm the appearance and reported the colours to be a dark orange. To test for spurious colour the Wratten filter was removed and the colour remained but was brighter, a definite red-orange in colour, and sparkled more. Greenacre did most of the observing during this episode because of his greater experience and familiarity with the area, but Barr served as a valuable witness who confirmed the TLPs with only slight differences in interpretation of the colour hue and density. 01:55 UT: A third coloured area, an elongated pink region with streaks, appeared, R3 (18km × ~2.5km), on the SW inner rim of the crater Aristarchus over sunlit terrain (See Figure 6). No other anomalous colour could be seen inside or outside Aristarchus apart from Figure 7. Approximate R1 area as outlined in white tear-drop shape by Hartmann & Harris in their 1968 paper on these TLP reports, showing what they suggest is Greenacre’s ‘dome-like structure’ with an apparent summit pit, identified here in a red box on Lunar Orbiter V image, North top right (IAU). Image: NASA, courtesy Daniel H. Harris. We have focused here exclusively on R1 but this and the other TLP sites warrant close examination as new ultra-high resolution Lunar Reconnaissance Orbiter imagery is released. It will be necessary to examine images taken under widely varying solar illuminations to determine if there is any evidence of very recent geologic activity at these sites. R1, R2 and R3. All three TLP were seen both with and without the Wratten 15 filter, but in all cases were brighter with no filter. However R3 had no associated sparkling effect. Barr confirmed the colours and the streaked appearance to R3. Greenacre continued to check for evidence of atmospheric spectral dispersion elsewhere on the Moon, but found nothing that would explain the three TLP inside or outside the slopes of the crater, or on the entire plateau or the vast area that surrounds it. It should be mentioned at this point that Hartmann & Harris (1968) suggested the ‘dome-like structure’ over which Greenacre watched R1 form was imaged by NASA’s Lunar Orbiter V (See Figure 7).30 However the structure at this location, although present in the LRO LOLA topographic data, is not a particularly convincing dome and could just be general topography on the flank of a much larger elevated area between the Cobra Head and Herodotus. 02:00-02:05 UT: (lunar altitude now 31°). Greenacre found that R1 and R2 were changing in appearance, namely that R1 and R2 were now a light ruby red, but their density and sparkle were still sufficient to obscure underlying surface detail. Barr confirmed this. By 02:05 Greenacre noted that all TLP, visible in the same field of view, were fading in colour, so he and Barr chose to outline their areas on a LAC-39 drawing, not later based upon a sketch from memory as has been suggested. Figure 6. Airbrushed chart identifying the locations, sizes, shapes, orientations and colours of the R1, R2, R3 TLP on 1963 October 30, IAU directions, North top right (IAU). This rendition was produced by ACIC scientific illustrator Patricia M. Bridges. Bridges noted she rendered the TLP with ‘a great deal of input from Jim Greenacre and Ed Barr.’ (personal communication 2010). Identification labels and arrows added by the authors. Note the solar illumination in this depiction is somewhat lower than that experienced by the observers on this night. See Figure 5 for a better representation of the illumination conditions. Image published in ‘Lunar Color Phenomena: Technical Report No. 12’, USAF Aeronautical Chart and Information Center, St Louis, MO, 1964 May. J. Br. Astron. Assoc. 123, 4, 2013 02:05−02:15 UT: Greenacre located the positions of the TLP on − the LAC chart and continued to study the area. The positions of the TLP were determined more precisely the next day from the Orthographic Lunar Atlas of the moon. Supplement no. 1- Edition B (limb area) plate E3-a ‘Euler’ and are listed in Table 1. He found that R1 and R2 both faded gradually in colour and had disappeared by 02:10 UT, with the lunar surface resuming its normal appearance at these two locations. R3 remained but the pink colour had faded by 02:15 UT (lunar altitude 33°) with the lunar surface returning back to its normal appearance. Greenacre then made a tape recorded description of the observation after which routine mapping resumed. 05:00−08:00 UT (approximate start UT – lunar altitude 51° to 36°). − A 4th TLP (referred to as B1) was noticed, when a violet or purple201
- 6. O’Connell & Cook: Revisiting the 1963 ‘Aristarchus events’ Figure 8. Lone bluish TLP seen on 1963 Oct 30 as depicted by the authors based upon published, very limited, description. B1 was first noted approximately three hours after the reddish TLP had faded from sight. North top right (IAU). blue colour formed and evolved in size and shape on the west side of Aristarchus, spreading gradually in a circular pattern around the north side of this crater (see Figure 8). The effect evolved over several hours and was at its brightest between 07:00 and 08:00 UT (lunar altitude 44° to 36°). area, however he was unable to detect any other anomalous colours with or without the Wratten 15 filter, and so having established the possible reality of the TLP, he called for additional observers for verification. Fred Dungan, an ACIC illustrator was the first independent observer to examine the area, and he had no difficulty in confirming R4 and its colour. 00:45−01:09 UT (Lunar altitude 28° to 32°). At 00:45UT Barr and − Dungan observed a second coloured spot, R4a, which was becoming more intense than R4 with a distinctly different reddish orange cast (See Figure 10). R4a was 3−5km in diameter and located on a high point on the southern rim of Aristarchus, on the southern extremity of R4. R4 retained its pinkish-red appearance and extent. During this time, Greenacre arrived at the telescope to confirm the observations. 1963 November 28 – night two On 1963 Nov 28, almost one lunar month later, for 75 minutes, four observers at the same telescope under similar viewing geometry and mostly ‘excellent’ seeing conditions (excellent seeing conditions confirmed later by microdensitometer scans of film taken during the reddish TLP episode) observed three further reddish TLP events: 00:00−00:30 UT (lunar altitude 19° to 25°). Barr began a lone − mapping session on the 24" Clark refractor working on the LAC-38 chart of the Seleucus area adjacent to Greenacre’s Aristarchus area LAC-39 chart. Aristarchus was in Barr’s field of view and the local altitude of the Sun at the crater was just 5.0° or about 7° lower than on night 1 (See Figure 9). During this half-hour period, nothing unusual was noted by Barr. 00:30−00:45 UT (lunar altitude 25° to 28°). At 00:30UT Barr de− tects a pinkish colour streak (~2.5km × 19.3km), R4, that starts to form on the southwest exterior rim of Aristarchus (See Figure 10) over shadowed terrain. R4 was adjacent to R3’s location on night 1, which had appeared over the interior of the sunlit rim. R4 grew in intensity over 1−2 minutes and the colour became a brighter pink or light red. To check for optical or atmospheric dispersion effects, Barr started to scan areas to the north and south of the suspect Figure 10. This Bridges rendition depicts R4, R4a and R5 TLP on Nov 28 in the same manner as was carried out for Figure 6 for the Oct 30 observation. Note the illumination here is higher than that seen by the observers during the reddish TLP episode on this night. See Figure 9 (Left) for a better representation of the illumination conditions and note in particular the relatively dim, low contrast lighting at the location of the brightest TLP seen on this night, R4a. North top right (IAU). Greenacre now called Dr John Hall, Lowell Observatory director to the eyepiece who arrived after 5 minutes. Although Hall had done little lunar observing in the past, he had no trouble in seeing and verifying the colours and pinpointed the location of the spots on a copy of the LAC to which the three other observers agreed. During the observing session, Greenacre used the smaller 12" guide scope refractor to check the area, but was unable to detect the colours – this had happened in night 1 also with the 6-inch finder scope. Greenacre also tried to obtain some photographs on black and white Panatomic X (SO-136) film at slow cine speeds of 5 frames per second, intermixed with individual short time exposures of 0.5 and 1 second. These were taken through the 24" Clark refractor. Figure 9. Similar illumination views of the Aristarchus area as they would have appeared to the Lowell observers on 1963 Nov 28. Repeat illumination images uncorrected for libration. (Left) Image by Brendan Shaw taken on 2012 Jan 05, 20:20−20:23 UT, corresponding to 1963 Nov 28, 01:14 UT, when red phenomena were seen. (Right) Image by Robert O’Connell taken on 2011 Feb 15, 06:11 UT, corresponding to 1963 Nov 28, 04:44 UT, when three bluish phenomena were seen later in the night, at which point the floor was half illuminated. 202 01:09−01:15 UT Visual monitoring showed the spots retain− ing their same intensity during the first photographic bursts that ended at 01:09 UT. With the Moon now at an altitude of approximately 32°, all four observers continued their visual observations. Shortly after 01:09 UT, both Hall and Dungan detected a small reddish-orange spot on a hill on the east side of Vallis Schröteri, designated R5 (see Figure 10). However, Greenacre and Barr were unable to make a positive identification.31 Dungan located the spot, not far away from the position of R2 seen on night 1. The appearance of Aristarchus would have been similar to Figure 9 (left), illumination wise, though libration would have been different. J. Br. Astron. Assoc. 123, 4, 2013
- 7. O’Connell & Cook: Revisiting the 1963 ‘Aristarchus events’ same location over shadow. Boyce notes that they were not observing directly through their telescope but off the slit jaws through optics which were usually meant for the positioning of stars on the slit. What they were using was a scanner cobbled together by someone else from an old spectrograph, and was not very well designed. It should also be pointed out that ×900 magnification on a 69" telescope (approximately ×13 per inch aperture) was a relatively low magnification and so colours would be easy to detect. 01:50−05:00. The Lowell observers contin− ued monitoring the area for any sign of colour, and bursts of cine were taken up until 04:10 UT. By 05:00 UT the Moon’s altitude was 59°. Towards the end of this time, the shadow and interior of Aristarchus should have had the appearance that can be seen in Figure 9 (right) – although the libration and resolution would have been different. Table 1. Positional information on the reddish TLP seen on 1963 Oct 30 and 1963 Nov 28. The original orthographic coordinates were reported to three decimal places, or about 1.7km precision on the lunar surface. The longitudes and latitudes that we give were found by comparing the illustrated maps by Patricia Bridges (Figures 6 and 10) with the LROC Target Acquisition Tool and have a precision of 0.1° or approximately 3km, because it is difficult to compare the LAC chart visually with the base maps used on the LROC website due to differences in illumination angle. 01:15−01:45 UT (Lunar altitude 34° to 39°). Greenacre noted that − by 01:15 UT the colour was subsiding in intensity. Another burst of cine was taken at 01:23UT. By this time the colour had dropped in visual intensity by 30−50%, R4a was now pink and R4 was much fainter. The Moon’s altitude was now approximately 38° above the horizon. At 01:35UT Hall telephoned the Lowell Anderson Mesa observatory, some 24km to the southeast, where Peter Boyce and Kent Ford were preparing to observe with a 69" reflector, however he did not tell them precisely where they should look in Aristarchus. Although the 69" had a spectrograph, it was not possible to get this working in time as other equipment was mounted on the telescope. Therefore Hall suggested that the two observers study the area visually as Boyce reported seeing conditions were good there. Visual observations continued at the Clark until 01:39 UT when it was obvious that the colours were fading rapidly, so a third burst of cine photography was taken before more visual observing, however by 01:45 UT all four observers agreed that the colour had gone completely. The next day, Greenacre would determine the coordinates of the spots that had been seen using the Orthographic Lunar Atlas (See Table 1). 01:50 UT (estimated from Lowell documents). Telephone call received from Boyce by Hall, and, according to Lowell Observatory documents, ‘confirmed’ the reddish glow in the shadow just outside the southwest exterior rim of Aristarchus. This reported confirmation was made through the guiding eyepiece at ×900. This was at approximately 01:45 UT, near the end of the activity, but exactly in the same place seen by the other four observers on the 24-inch refractor. Observers at both sites reported the colour at the Figure 11. Three bluish TLP seen on 1963 Nov 28 as depicted by the authors based upon published, very limited, descriptions. These TLP were first noted approximately three hours after the reddish phenomena had faded from sight. North top right (IAU). J. Br. Astron. Assoc. 123, 4, 2013 05:00−06:00 UT (Lunar altitude 59° to 55°). Greenacre, Barr and − Dungan observed a bluish TLP (B2) form and evolve on the western side of Aristarchus, at 05:00 UT, covering the same general area as B1 seen on Oct 30 but under noticeably lower solar illumination conditions (see Figure 11). B2 gradually spread along an arc around to the north. Unlike October’s B1’s violet or purple-blue colour, B2 was a very deep violet and noticeably more vivid than B1 had been. During this time, a less deep violet colour, B3, was forming in a depressed area just to the east of the crater. Whilst B2 and B3 were becoming strong and persistent, a strong blue colour, B4, was forming on the sunlit portion of the floor of Aristarchus. B4 was like a haze through which they could see the floor, although curiously and inexplicably, dimmed it considerably. All three TLP were quite clearly seen until 06:00 UT when the seeing began to deteriorate. Observational records are uncertain if the Wratten 15 filter was initially present at 05:00 UT, but it was certainly removed when observers were trying to see if the effects were due to spectral dispersion, or chromatic aberration. There was no evidence to suggest that it was due to either of these two causes. Questions and criticisms 1. Why were no photographs taken on night 1? Greenacre was eager to capture R1, R2 and R3 on film, but before attempting this (a process that would have taken several minutes to put in place and refocus even under 5−6 seeing) Greenacre had wanted to visually verify the TLP were real by checking for spurious colour – chromatic aberration in the optics or atmospheric spectral dispersion. The phenomena had disappeared before photography could be attempted. 2. The photographs taken on night 2 did not reveal anything unusual despite undergoing microdensitometer scans. Hall, in correspondence to American chemist Harold C. Urey, reports that the black and white film used (Kodak SO-136) was not very sensitive in the hydrogen-alpha part of the spectrum, but more sensitive at longer wavelengths, which when combined with focal length 203
- 8. O’Connell & Cook: Revisiting the 1963 ‘Aristarchus events’ changes (focus made in visible light, but film more sensitive to longer wavelengths) at different wavelengths, was unlikely to have recorded the TLP in detail. The totality of all these issues is why the USAF determined ‘Experiments with color film made by the Observation Section indicate that any future color phenomena can be photographed although there is no evidence that black and white film will respond sufficiently to the color to produce a discernible contrast.’31 3. Was the night 2 TLP really confirmed by the Perkins telescope observers? Despite Hall’s and Greenacre’s belief that it was confirmed (reiterated by Cannell in correspondence to Patrick Moore), now retired Dr Peter Boyce disputes these accounts and challenges the notion that he and Ford confirmed the TLP (Private communications, 2010−2011). Attempts to contact Dr Ford have been unsuccessful but Boyce’s recounting of their observation and low weighting of this observation establishes sufficient doubt to limit an evaluation of the 1963 Aristarchus events to just what the four observers on Mars Hill reported seeing. Furthermore Boyce and Ford started observing when the colours were already fading as seen by the Mars Hill observers, and so they were really less definitive over whether they could see the reported colour that Hall reports. Boyce does clarify though that they could not rule out the colours not being present either, but gives it a certainty of 4 on a scale of 1 to 10, with 1 being not present and 10 being absolute certainty. He also states that the Moon was seen in the slit jaws of a scanner, a rather non-optimal viewing method. 4. Some sceptics imply Greenacre was an inexperienced lunar observer at the time he witnessed his first TLP episode, based on his choice of ~500× magnification under the moments of 3−4 poor seeing. But as addressed earlier, this magnification was ACIC protocol for 3−4 seeing on the Clark. Additionally, Greenacre had extensive training and hundreds of hours of observational experience on the Clark. By the time of the night 1 TLP, he had already been mapping the lunar surface for two years. On the ‘Aristarchus’ LAC-39 alone he had spent 108 hours charting this area, mostly during lunar mornings or evenings, since 1962 December, and was very familiar with its appearance, and also how the Earth’s atmosphere and telescope optics affect detail. 5. Critics also suggest atmospheric spectral dispersion was responsible for the colours, however on night 1 the Moon was 25° high and rising at the time that the first TLP was observed to form, so the difference in position in the sky between red and blue images of the Moon would have been approximately 0.5 seconds of arc, or ~1km on the Moon’s surface. The Moon was also gaining altitude and was as high as 59° (just culminated) during the B1 event. Greenacre was well aware of the effects of colour fringes that could be produced from spectral dispersion or chromatic aberration and both Greenacre’s paper and the 1964 USAF report stipulated that other bright areas were repeatedly checked for similar colour and none were found. It should be noted on this issue the statement made by Hall following his own November TLP observation in a letter to Phil Bury of the Societe d’Astronomie Populaire, Toulouse, France: ‘Contention made here is that this coloration is not produced in the optics of the telescope or by the earth’s atmosphere’.32 6. The telescope suffers from chromatic aberration, as noted by contributing editor to S&T and TLP sceptic Thomas A. Dobbins (Private communications 2010−2012) and by renowned American planetary imager Donald C. Parker – indeed Parker had found this 204 when using both the 12" and the 24". Parker further comments that the 12" had superior optics to the 24" Clark (Private communication 2010). However the 24" is one of the world’s finest resolving telescopes as demonstrated by Hartmann tests, which found that it had the least aberration of those scopes tested.33 The ACIC was aware of this because the telescope was notorious for producing blue fringes close to bright objects, and the Wratten 15 filter was employed by USAF cartographer-observers to compensate. This blocked off wavelengths below 520nm and removed the largely blue radial chromatic aberration.34 To test for such colour effects, on night 1, Greenacre tried firstly removing the Wratten 15 filter. If chromatic aberration were to blame then a corresponding blue colour should have been seen nearby. However upon removing the filter, no blue was seen nearby, at R1, R2 and R3, only the saturated orange-red that had been seen through the filter in the first place. Also if spurious colour were the cause, then it should have been present elsewhere, especially without the filter. Greenacre scanned the area without the filter but no other similar coloured spots were seen, and this ruled out both telescopic optical effects and atmospheric spectral dispersion. Greenacre’s frequent access to the Clark during the previous two years qualified him uniquely to be able to judge spurious colour effects. 7. Although Greenacre’s 1963 December Sky and Telescope article refers to the night 1 spots R1 and R2 as being ‘quite brilliant’ (R3 was never described in this way), subsequent clarification was made in a letter from Greenacre to Daniel H. Harris at the University of Arizona in 1968. ‘The intensities of the red glows varied during the observing time but in general would be less bright than the background solar (brightest) illuminated surface. The paper which I am enclosing gives an account of the observations. I have also marked an approximate percentage figure showing the deficit of brightness compared to the background. I would like to stress that my figures relate to the brightest areas of the background’.35 Based on this clarification it seems Greenacre’s ‘quite brilliant’ description in S&T 1963 Dec was attempting to describe R1 and R2’s brightness relative to their immediately adjacent, shadowed and dimly lit surrounding terrain near the terminator. This might explain why R3 was not characterised as brilliant since, unlike R1 and R2, its was surrounded by much brighter background terrain on the rim of Aristarchus further from the terminator. Figure 12. A brightness gradient, going from black on the left to white on the right. The rectangle in the middle is of a fixed brightness value, but looks brighter on the left and darker on the right. This is an illusion due to the relative differences with the background. To prove this, cover the gradient to the top and bottom of this rectangle with some card and the rectangle will look its normal grey self. Note in this gradient image, the contrast difference on the far left is intended as an analogy to the dimly lit background at the locations of R1 and R2 on night 1, whose apparent brightness is represented here by the embedded centre light grey bar. The far right end of this gradient would correspond to the distinctly different contrast condition at R3 which, unlike R1 and R2, was surrounded by brightly lit background on the rim of Aristarchus, making the centre bar here appear darker relative to the brighter background. J. Br. Astron. Assoc. 123, 4, 2013
- 9. O’Connell & Cook: Revisiting the 1963 ‘Aristarchus events’ See Figure 12 for an example of this illusionary effect. It is of interest to note that following his initial S&T ‘brilliant’ characterisation, Greenacre never again referred to R1 and R2 as brilliant, but only noted that as they formed, they ‘increased in intensity.’ 8. Non-visibility in the 12" guide scope. In the New York Academy of Sciences paper, Greenacre reports: ‘It is possible that events of this nature will be difficult to observe with small aperture telescopes, since we were unable to see them with our 12-inch refractor.’ Hall also noted this issue in his correspondence on the phenomena. It seems this was because the TLP were evidently fainter than previously assumed and in fact Greenacre thought a 20" refractor or 16" reflector would be the minimum apertures required to see the phenomena he witnessed. Given the excited atmosphere present in the Clark dome on both nights, quickly switching views between the bright image provided by the 24" to the image provided by the smaller 12" guide scope may have posed eye adjustment issues preventing the detection of the small TLPs R1, R2 and R5 in particular. On night 2 Hall noted the ‘delicate’ nature of R4 which may also have been a contributing factor in the failure to detect this larger area TLP (and the similar appearing TLP R3 in October) through the 12" scope. It should also be noted that while we know for certain the 12-inch scope was pressed into service on November 28, it appears from Hall’s supplement to Greenacre’s 1963 December Sky and Telescope report that on October 30, Greenacre only attempted to confirm the TLP, R1, R2 and R3, through the 6-inch finder scope. In later correspondence, the use of the 12-inch guide scope is noted in general but without reference to a specific night, so this issue remains an open question. If Greenacre did only attempt confirmation of the October TLP through the 6-inch finder scope, this might account for their non-visibility in this much smaller telescope. 9. Why were the B1−B4 events from night 1 and night 2 not initially reported? The USAF withheld some of the observations of the additional TLP until 1964 May. In a section titled ‘Unpublished Observations’, the USAF report ‘Lunar Color Phenomena’ noted: ‘This portion of the observations has not been published for various reasons, the most important being that there is doubt as to whether they are part of the (earlier reddish) phenomena. They do belong in this report as a matter of record and may yet prove to be of scientific value’. The report also notes historical reports of similar bluish phenomena. With regard to the reddish phenomena seen on both nights, the report concluded: ‘An evaluation of the reliability of the observers and the thoroughness with which verification was pursued leads to the conclusion that a real phenomenon was observed on two separate occasions.’ Possible physical explanations It is not within the scope of the paper to decide upon a specific mechanism that could account for all of the 1963 October and November observations; however mention will be made of some of the theories. Hartman & Harris in 1968, considered many of the phenomena could be explained by the eruption of molten volcanic material. Their calculations showed that black body radiation from molten volcanic material, not necessarily contiguous but distributed over patches covering the red spot areas, could account for both the reported dull red visual intensity seen and the duration. These J. Br. Astron. Assoc. 123, 4, 2013 Figure 13. (Left) Howard Eskildsen’s 2009 March 9 low-altitude Moon image from Ocala, Florida during repeat illumination conditions for 1963 October 30. This image was taken through a six-inch refractor clearly showing ubiquitous spurious colours at high contrast borders, most notably at Herodotus. Image saturation was boosted to more clearly show colours inherent in this unprocessed image. (Right) One of Anthony Cook’s simulated artificial atmospheric spectral dispersion images, produced using Figure 5 by moving the red component in one direction and the blue component in the opposite direction, confirming spurious colours appear to manifest most strongly at Herodotus under this solar illumination. Note particularly the relative absence of reddish colours in both images at the locations of R1 and R2. would be partially obscured by gas and dust, giving rise to the sparkling effect witnessed. The later blue colours, they speculated were akin to strongly scattered blue light sometimes seen in analogous ash clouds above terrestrial volcanoes. They deduced, from examining Lunar Orbiter V photographs, that at least three of the TLP locations were near former lava flows, however not necessarily recent. Their paper considered that the volcanic eruption might have been in the form of a fire fountain, hence would not show up in the topography seen in the images. Unfortunately we now know from examining the NASA Lunar Reconnaissance Orbiter LROC WAC and NAC images of the Aristarchus Plateau that there are no signs of even small recent lava outpourings, nor non-space-weathered colour changes to the surface from fire fountains. However images do show dark deposits on top of the 175-million year old Aristarchus ejecta blanket and also just inside the rim. This may infer at least some volcanic activity that is geologically younger than the ejecta blanket, but there are no hints that these are associated with the 1963 Aristarchus events. Sublimation of radon frost in sunlight – Aristarchus is the most prolific source of radon on the Moon, as detected from orbit from Apollo and Lunar Prospector alpha particle radiation detectors. Radon melts at −71°C, which means that if it has been outgassed, it can exist as a frost coating on the surface if emitted at night. Although radon is a colourless gas, when it freezes it is yellow and at lower temperatures an orange-red.36 This might explain some other coloured TLP seen on the Moon near the terminator, providing that radon is distributed in sufficient quantities and the temperature lies in this zone. However due to the relatively large solar altitudes at Aristarchus on both nights in question, the temperature would have probably already risen outside this range, hence it is unlikely that radon frost could be an explanation on this occasion. It appears spectral dispersion effects in our atmosphere or chromatic aberration from telescope optics can be ruled out for the distinct red events, R1 and R2 seen on both nights. Although Phillips & Lena, in their 2011 Selenology Today article offer these explanations for R4 on night 2, its position is slightly off from what the four Flagstaff observers saw, and it does not explain R4a or 205
- 10. O’Connell & Cook: Revisiting the 1963 ‘Aristarchus events’ R5.37 Furthermore, earlier imaging and experiments reveal similar colours elsewhere on contrasty edges, as can be seen in Figure 13.38 Such ubiquitous terrestrially produced colours were checked for but not seen in 1963.39 Given Greenacre and Barr’s extensive training, it seems highly unlikely that they would have misinterpreted atmospheric spectral dispersion or chromatic aberration effects. Furthermore, weather data from Flagstaff Pulliam airport suggests no evidence of an inversion layer over this city on either night, which has been posited by sceptics as possibly causing odd atmospheric effects which could account for the colours reported.40 Natural surface colour is another possible explanation; however as can be seen from Figure 5 there are no colours strong enough in the regions concerned. Clementine colour image mosaics also fail to show significant colour here. As for other aspects of the TLP, Garlick et al. (1972) referenced studies of the appearance and behaviour of fluidised Apollo dust samples artificially illuminated in the laboratory and suggested sharp rises (50 to 100%) in observed surface albedo might account for Greenacre’s reported ‘sparkling’ or ‘flowing appearance’.41 Geake & Mills (1977) invoke that radon emissions over Aristarchus are a trace gas and much larger quantities of other gases could loft dust. They discuss the possibility of lightning-type discharges between dust particles in a rarefied gas, and how this might explain some of the ‘sparkling’ seen by Greenacre and Barr.42 Crotts et al. (2009) take the theory further and have modelled gas eruptions, induced by seismic activity, which could explain many TLP sightings.43 They also suggest reddish and bluish colours could be produced by sub-micron-particle light scattering in dust clouds depending on Sun−Earth−Moon orientations.44 Dollfus obtained definitive polarimetry evidence for dust clouds above the surface of the Moon, albeit in Langrenus crater and not Aristarchus.45 However, Lipskii & Pospergelis (1967) reported detecting peculiarities of polarised light at Aristarchus which they believed was caused by a cloud of scattering medium over the crater.46 As for the reported obscuration of surface detail at R1 and R2, it is of interest to note Fitton (1975) suggests the emission of light by gases above the lunar surface could produce opaque TLPs.47 Such an effect accompanied by lofted dust could explain the temporary obscuration reported at these two locations. Crotts (2009) has concluded based on his research that the Aristarchus Plateau is ‘responsible for undeniably objective transient anomalies associated with lunar outgassing’.48 Discussion Up until night one, Greenacre had long been sceptical of reported changes on the lunar surface, believing that the Moon was a geologically dead world where nothing ever happens. Barr shared this view as did Hall. So it is reported that Greenacre was somewhat ‘dumbfounded’ when R1 and R2 appeared. Although no photographic evidence was obtained that showed the TLP on night 2, probably because of film colour sensitivity, focus, and resolution issues, the reports from the two nights are among the best documented visual cases of TLPs and caused great scientific interest in the study, especially at NASA. NASA’s interest in the reliability of night 1 and 2 TLP observations was one of the reasons why in 1969 April, Dr George Mueller, Associate Administrator of NASA’s Office of Manned Space Programs, stated in 206 his Senate testimony on Project Apollo’s status: ‘The eighth landing (Apollo 18) is planned for Schröter’s Valley with the purpose of looking for and examining possible transient events and to learn more about the red flares which have been seen in the area’, e.g. by Greenacre, Herschel and many others.49 Unfortunately the Apollo 18−20 missions were cancelled by the Nixon administration. Although the Moon was relatively low during both reddish TLP episodes as sceptics have noted, we have shown that the night 1 and 2 observations cannot easily be explained away by the spurious effects of atmospheric spectral dispersion or telescopic chromatic aberration. Greenacre was a very experienced observer and would have recognised these effects at the sites concerned and even more prominently elsewhere on the Moon. He performed checks for such false colours elsewhere but could not find any. If spurious colours were somehow responsible for some of the phenomena, this explanation appears inadequate to explain October’s R1 and R2 TLP in particular as both direct colour imaging of the Aristarchus Plateau under similar solar illumination conditions and spurious colour simulations consistently fail to produce colours at these two locations. Spurious colours also cannot account for the obscuration of surface detail reported only at these two small, highly localised, areas. Since TLP were only seen twice during the many thousands of observing hours required for the ACIC lunar mapping programme, one must conclude that if these types of phenomena are real lunar events, they are inherently rare, far more so than previously assumed. But the central issue underlying any examination of TLP reports is whether the Moon is geologically dead. It would be almost three decades before a similar well-documented case of TLP was recorded by Dollfus in the crater Langrenus, which he suggested were dust clouds above the lunar surface produced by outgassing.50 We now know that the Moon still undergoes current minor exogenically produced geological changes from meteoritic impacts as monitored by NASA’s Marshall Space Flight Center. The Moon also experiences electrostatic charging of dust particles, and NASA’s scheduled 2013 LADEE mission will search for evidence of whether these form as clouds above the surface or at high altitude in the lunar exosphere. The Ina and Hyginus depressions on the Moon are now thought to be only a few million years old and 27 of these so called ‘lunar meniscus hollow’ formations have now been imaged by the LROC.51 Nakamura’s (2003) reanalysis of old Apollo seismic data has revised sharply upward the actual number of deep moonquakes positively identified by a factor of five.52 In 2010, the NASA LRO team announced newly discovered tectonic lobate scarps, suggesting these were evidence of geologically recent activity that might still be active today, and in early 2012 small scale tectonic graben have been found which may be in a state of present day formation.53 It is perhaps timely to re-evaluate some of the past TLP reports, rather than applying the general dogma of automatically dismissing them. Within the BAA and ALPO Lunar Sections we encourage observers to re-observe under similar illumination conditions of past TLPs.54 This way we can gather information and images on the normal appearance of the features concerned. Any images obtained can then be tested to see if natural surface colour, or simulated spectral dispersion could explain some of the effects claimed in the original TLP reports. Until CCD imaging can demonstrate that the Earth’s atmosJ. Br. Astron. Assoc. 123, 4, 2013
- 11. O’Connell & Cook: Revisiting the 1963 ‘Aristarchus events’ phere and/or optics can produce the varied discrete appearances and behaviours of the TLP seen by the Lowell observers under similar illumination and observing conditions (preferably with the 24-inch Clark refractor), there can be no resolution to the question posited by Walter H. Haas more than 70 years ago: ‘Does Anything Ever Happen on the Moon?’ 55 Acknowledgments We thank the following observers who contributed repeat illumination images for our research on this paper: Palle Bohnholdt, Frank Melillo, Piotr Malinski, Marcin Siudzinski, Leonard Mercer, Martin Federspiel, Rolf Hempel, Colin Henshaw, Bev Ewen–Smith, Brendan Shaw and Howard Eskildsen. We also thank James E. Greenacre, Jr. for sharing information about his father and these events, Lauren Amundson, Lowell Observatory Archivist, for her assistance in accessing relevant documents, and all others who have shared information and opinions for this paper. Additional supplementary material on these TLP reports can be found on our website www.the1963 aristarchusevents.com. Address: PO Box 1963, Keystone Heights, Florida 32656, USA. [admin@the1963aristarchusevents.com] References 1 Greenacre J. C., ‘The 1963 Aristarchus Events’, The New York Academy of Sciences Annals, 123(2), (1965 July), pp. 811−816. Greenacre presented this paper at the conference entitled Geological Problems in Lunar Research held by The New York Academy of Sciences on 1964 May 16−19. Accessible at: http://onlinelibrary.wiley.com/advanced/ search (Accessed 2012-03-20) 2 Sheehan W. P. & Dobbins T. A., ‘The TLP Myth: A Brief for the Prosecution’, Sky and Telescope Magazine, 98(3), (September 1999), pp. 118−123 3 Mobberley M., Lunar and Planetary Webcam User’s Guide, (London: Springer−Verlag, 2006), p. 124 4 Wood C. A., ‘TLP RIP: Are TLP Real − Is the Moon Changing?’, Lunar Photo of the Day (LPOD), 2011 February 5. http://lpod. wikispaces.com/February+5,+2011 (Accessed 2012-03-20) 5 Lena R. & Cook A., ‘Emergence of low relief terrain from shadow: an explanation for some TLP’, J. Brit. Astron. Assoc., 114(3), (2004 June), pp. 136−139 6 Sheehan W. P. & Dobbins T. A., Epic Moon: a history of lunar exploration in the age of the telescope, (Richmond: William−Bell, Inc., 2001), pp. 316−321. Also private communications with T. A. Dobbins, 2010−2012 7 Schimerman L. A., Lunar Cartographic Dossier, Volume 1, (St Louis: Defense Mapping Agency Aerospace Center for NASA, Feb 1975), p. 12 8 St Clair J. H., Carder R. W. & Schimerman L. A., ‘United States Lunar Mapping − A Basis for and Result of Project Apollo, Section 2: Lunar Maps’, Moon and the Planets, 20, (1979 April), p. 127 9 Cramer R. E., ‘Cartography at the Aeronautical Chart and Information Center, St Louis’, The Professional Geographer, 8(6), (1956 November), p. 8 1 0 Kopal Z. & Carder R. W., Mapping of the Moon: Past & Present, (Dordrecht− Holland/Boston: D. Reidel Publishing Co., 1974), pp. 146−150 1 1 Hoyt W., ‘Moon Mapping: Intricate Job’, The Arizona Daily Sun, Flagstaff, Arizona, 1963 January 31, p. 4 1 2 Digital versions of the LACs can be found at: http://www.lpi.usra.edu/ resources/mapcatalog/LAC/ (Accessed 2012-03-20). Also see Greely R & Batson M., Planetary Mapping, (Cambridge University Press, 1990) for more information on the ACIC lunar programme and mapping process. 1 3 For additional biographical information on Greenacre’s personal life and professional careers see supplement ‘A Short Biography of James C. Greenacre’ posted on our paper’s website. 1 4 Baker T., ‘Oral History with Focus on Sandia Cave: 1983 interview with James and Doris Greenacre’, Transcribed by Baker T. 2005, line entry J. Br. Astron. Assoc. 123, 4, 2013 1652 at http://www.ele.net/sandia_cave/greenacre1501_2000.htm (Accessed 2012-03-20) 1 5 Hartwig T., ‘Oral Interview with Doris and James Greenacre’, Fort Collins Local History Collection, Fort Collins, Colorado, p. 14 1 6 Kopal & Carder, op. cit., (ref.10), p. 156 1 7 The actual date in 1967 Greenacre assumed this position is unknown but it is established by various documents in Lowell Observatory Archives. Other sources also establish him in this position and it was confirmed by his son, J. E. Greenacre, Jr. (Private communication 2010). He became Acting Chief once W. D. Cannell left the programme sometime during 1967 to pursue a master’s degree at the University of Virginia. 1 8 (Unknown staff writer), ‘Mission Accomplished: ACIC Director Last to Leave Flagstaff’, Arizona Daily Sun, Flagstaff, Arizona, 1969 Aug 19 1 9 For example, see Haas W. H., ‘Lunar changes − an old example in the crater Herodotus and some thoughts on their recurrence’, Journal of the Association of Lunar and Planetary Observers, 44(3), (2002 Summer) pp. 14−17. Haas recently noted regarding this TLP observation reported in JALPO, ‘I do not believe the odd appearance I observed in Herodotus on August 11, 1954 through my 12.5-inch reflector was due to changing solar illumination. I believe this TLP was some kind of temporary actual physical change on the Moon – possibly due to dust above the lunar surface. I think I have witnessed approximately 15 anomalous changes in the appearance of the Moon over the years that cannot be attributed to telescope optics or the Earth’s atmosphere and suggest some type of lunar activity.’ (Private communication, Bob O’Connell, 2012). On 1967 November 15, Clyde Tombaugh observed with Gene Cross a red TLP near the eastern limb (IAU) of the Cobra Head formation on the Aristarchus Plateau as reported in Classen J., ‘Flares on the Moon’, in AAS/IAP Symposium: Geological Problems in Lunar Research, ed. J. Green, American Aeronautical Society, Huntington Beach, California, (1971), pp. 251. In 2006 Cross recalled regarding this joint TLP observation, ‘…Clyde Tombaugh and I observed a red coloration phenomenon near Aristarchus and the Cobra Head. We were using the 12-inch f/66 Cassegrain telescope at New Mexico State University’s planetary observatory, A-Mt. Magnification was around 600 ×, I think. Seeing and transparency excellent. We observed the coloration for about 90 minutes, as I recall. I took photos on 35mm film (with yellow and blue filters, with non-overlapping spectral bands), which I had microdensitometer scanned; results back then were indeterminate. I still have the negatives. Probably should rescan… Tombaugh NEVER (sic) doubted the lunar-based reality of the phenomena we witnessed.’ At the time Cross wrote this he was a Senior Optics Engineer, Lockheed Martin Corp., California. (Private communication, Bob O’Connell, 2006). It is also noteworthy that life-long British lunar observer and well known TLP skeptic Harold Hill made an ‘anomalous observation’ on 1947 January 30 at ‘the main peak of the massive central mountain group’ of the crater Eratosthenes as recounted in his 1991 ‘A Portfolio of Lunar Drawings’. In a 2003 January 7 letter to Dr Anthony Cook, Hill wrote, ‘I regard it as a temporary obscuration caused by raised regolithic material as a result of a meteoritic impact – a purely chance event and nothing of an endogenous nature.’ 2 0 Hall J. S., ‘Supplementary Note’, in Sky & Telescope, 26(12), (December 1963), p. 317 2 1 For example, geologist Henry J. Moore II of the US Geological Survey, Geologic Division Branch, Astrogeology, Menlo Park, CA personally discussed the LAC-39 with Greenacre at Lowell Observatory and later sent him a letter complementing him on his ‘excellent map of the Aristarchus region’ and noted the ‘value’ of his TLP report. See: Moore H. J. II, letter to Greenacre, 1963 Nov 25, Lowell Observatory Archives. During this period, Moore was using Greenacre’s LAC-39 to produce his own geologic map version of the same area designated I-465, ‘Aristarchus’ published in 1965. See http://www.lpi.usra.edu/resources/ mapcatalog/usgs/I465/ (Accessed 2012-03-20) 2 2 Greenacre’s lunar observing time exclusively on the 24-inch Clark refractor for the first two years prior to the TLP episodes may well have exceeded 1,000 hours, based on Hall’s estimate that there were ‘probably 2000 hours per year clear enough for visual observations.’ J. S. Hall to ACIC Headquarters, 1960 Nov 8, in J. S. Hall papers, Lowell Observatory Archives. 2 3 For example, see Cyr G. J., Rev. S. M., ‘Ships on the Moon’, Lawrence Tribune, Lawrence, MA., 1964 November 17. See supplement, ‘Ships on the Moon’ posted on our paper’s website. 2 4 Hall J. S., letter to Barr E. M., 1963 May 8, Lowell Observatory Archives 2 5 Barr E. M. letter to Hall J. S., 1963 May 11, Lowell Observatory Archives 2 6 Hall J. S., letter to Barr E. M., 1963 June 4, Lowell Observatory Archives 2 7 USAF, Lunar Color Phenomena: Technical Report No. 12, (Virginia: USAF Aeronautical Chart and Information Center, Ft Belvoir Defense Technical Information Center, (1964 May), p. 5 2 8 Cannell W. D., ‘Photogrammetric and Visual Compilation of Lunar Charts’, Photogrammetric Engineering, 28(4), (1962 September), p. 580. Cannell presented this paper at the 28th Annual Meeting of the Society of 207
- 12. O’Connell & Cook: Revisiting the 1963 ‘Aristarchus events’ Photogrammetric Engineering held 1962 March 14−17, Washington, DC. 2 9 See Sheehan & Dobbins, op. cit., (ref.6), p. 316 for their characterization of initial seeing as ‘boiling’ and criticism of Greenacre’s choice of magnification during the October TLP observation. For Cannell’s discussion on ACIC magnification protocol, see Cannell, op. cit., (ref.28), p. 580 3 0 Hartmann W. K. & Harris D. H., ‘Lunar Volcanic Eruptions Near Aristarchus’, Communications of the Lunar and Planetary Laboratory, University of Arizona, Tucson, Arizona, 7(3), (1968), p. 163 3 1 USAF, op. cit., (ref.27), p. 10. In November when capturing photographic evidence was attempted, TLP R4 was reported as ‘delicate’ and only two of the four observers were able to make positive identification of the small and elusive TLP, R5. Interestingly, the brightest TLP this night, R4a, had a ‘reddish-orange cast’ and there is a notable sensitivity trough in the orange-red spectral region for SO-136 film between ~620−670nm. See Daniel H. Harris’ film spectral sensitivity graph in supplement ‘Failure to photograph November 28th TLP’ posted on our paper’s website. 3 2 Hall J. S., letter to Bury P., 1963 Dec 5, Lowell Observatory Archives. Other Hall correspondence following the November TLP episode indicates he was perplexed and conflicted about the nature of the TLP, and besieged by correspondence requesting more information on the observations. Hall appealed to Harold Urey for help in an attempt to gain some distance from the controversial reports, as Hall did not have the time to devote to the issue and felt unqualified to publicly speculate on the possible cause of the phenomena: Hall J. S., letters to Urey H. C., 1963 Dec 6 and 1964 Jan 7, Lowell Observatory Archives. However, Hall did privately speculate in his letter to Phil Bury suggesting the phenomena may have been produced ‘...by gases being emitted through cracks in the surface, or by fluorescence of materials produced by unusual solar bombardment.’ See supplement ‘Telegrams, Media Coverage and Correspondence’ posted on our paper’s website. 3 3 Bell L., The Telescope, (New York: McGraw−Hill Book Co., 1922) Fig.187, p. 268. Hall wrote with regard to the Clark optical system and the TLP observations, ‘As for the equipment used, and the possibility that some unusual change may have influenced the observations, I think that it would be difficult to imagine a more stable telescopic setup. No changes in observational technique had been introduced during the entire period that this area has been under study.’ This is Hall’s complete original unedited passage in his ‘Supplementary Report’ sent to Sky and Telescope (1963 Nov 4) in Hall J. S. papers, Lowell Observatory Archives. 3 4 See supplement ‘ACIC photo-visual system’ posted on our paper’s website. 3 5 Greenacre J. C., letter to Harris D. H., 1968 July 9, Lowell Observatory Archives. Harris does not possess Greenacre’s original figure ‘showing the deficit of brightness compared to the background’. However, in the Hartmann & Harris (1968) paper on these TLP observations it was noted, ‘estimated intensity of the spots, varying between 5 and 25 percent fainter than the normal background’. See web link in reference 30 for additional information on brightness deficits for specific TLP. 3 6 See Wikipedia ‘Radon’ at http://en.wikipedia.org/wiki/Radon. (Accessed 2012-03-20) 3 7 Phillips J. & Lena R., ‘GLR investigation: A plausible explanation for Transient Lunar Phenomena. Red Glow in Aristarchus’, Selenology Today, 24, (2011 May), pp. 1−11 3 8 For another analysis of a repeat illumination image for 1963 October 30, see Cook A. C., ‘BAA/ALPO Transient Lunar Phenomena’ report, BAA Lunar Section Circular, 42(9) (2005 September), pp. 4−5 3 9 Fitton L. E. noted with regard to spurious colors seen during lunar observing: ‘It is worth noting that, if one bright point source at the lunar surface is producing a spectrum, all point sources over the entire lunar surface must be producing spectra’. Fitton L. E., ‘Transient Lunar Phenomena − A New Approach’, Journal of the British Astronomical Association, 85(6), (1975), p. 523 4 0 This atmospheric effect has been suggested by Sheehan & Dobbins (2001), op. cit., p. 318. See supplement ‘Weather Analysis’ posted on this paper’s website. 4 1 Garlick G. F. J. et al.,‘An Explanation of Transient Lunar Phenomena from Studies of Static and Fluidized Lunar Dust Layers’, Proceedings of the Lunar Science Conference, 2, (1972), pp. 2681−2697 4 2 Geake J. E. & Mills A. A., ‘Possible physical processes causing transient lunar events’, Physics of the Earth and Planetary Interiors, 14(3), (June 1977), pp. 299−320 4 3 Crotts A. P. S. & Hummels C., ‘Lunar Outgassing, Transient Phenomena, and the return to the Moon. II. Predictions and Tests for Outgassing/ Regolith Interactions’, ApJ., 707(2), (December 2009), p. 1507 4 4 ibid., p. 1510 4 5 Dollfus A., ‘Langrenus: Transient Illuminations on the Moon’, Icarus, 146(2), (2000 August), pp. 430−443 4 6 Lipskii Y. N. & Pospergelis M. M., ‘Some Results of Measurements of the Total Stokes Vector for Details of the Lunar Surface’, Soviet Astronomy, 11(2), (1967 October), p. 324 4 7 Fitton, op. cit., (ref.39), p. 514 4 8 Crotts A. P. S., ‘Transient Lunar Phenomena: Regularity and Reality’, ApJ., 697(1) (2009 May), p. 5 4 9 ‘NASA Authorization for Fiscal Year 1970’, Hearings before the Committee on Aeronautical and Space Sciences United States Senate: NinetyFirst Congress; First Session on S. 1941 (Washington, DC: USPO, 1969 May 28−30). Dr Muller testimony p. 183. See supplement ‘Apollo 18’ posted on our paper’s website. 5 0 Dollfus, op. cit., (ref.45), pp. 430−443 5 1 Braden S.E. et al., ‘Age and Extent of Small, Young Volcanic Activity on the Moon’, 44th Lunar & Planet. Sci. Conf., (2013), 1–2, 2843.pdf, The Woodlands, Texas. PDF available at: http://www.lpi.usra.edu/ meeings/lpsc2013/pdf/2843.pdf (Accessed 2013-06-04) 5 2 Nakamura Y., ‘New identification of deep moonquakes in the Apollo lunar seismic data’, Phys.Earth & Plan. Int., 139(3−4), (2003 October), pp. 197−205 5 3 See: ‘NASA’s LRO Reveals ‘Incredible Shrinking Moon’ at: http:// www.nasa.gov/mission_pages/LRO/news/shrinking-moon.html and also ‘NASA Spacecraft Reveals Recent Geological Activity on the Moon’ at: http://www.nasa.gov/mission_pages/LRO/news/lunargraben.html (Accessed 2012-06-22) 5 4 See ALPO/BAA/University of Aberystwyth, ‘Project for the verification/elimination of past transient lunar phenomena reports’ at: http:// users.aber.ac.uk/atc/tlp/tlp.htm 5 5 Haas W. H., ‘Does Anything Ever Happen on the Moon’, JRASC, 36, 237 (1942) Received 2012 April 4; accepted 2012 June 27 BAA Membership The subscription rates for the 2013–2014 session are as follows: Young Persons’ membership (22 years of age or under on 1st August) ..... £19.00 Ordinary Members (23–64) .......... £46.00 Senior Members (65 or over) ....... £33.00 Affiliated Society ........................ £46.00 Members with 50 or more years’ continuous membership (Honorary Members), no charge Family Membership: Where both members are under 65 on 1st August .........................................£50.00 Where one or both members are 65 or over ..................................................... £35.00 Family Membership is available for two people living at the same address. Only one Journal and Handbook will be sent although both may attend meetings and have a vote. 208 Paper Circulars (if required): UK & Europe ...... ...... ...... .............£5.00 Rest of World .................................£10.00 Postage Overseas postage by surface mail for the Journals and Handbook is included in the above rates. To avoid postal delays and losses use of airmail is strongly recommended. Please add the following for airmail: Europe (incl. Canary Is. & Turkey) £14.00 Rest of World ................................. £21.00 Overseas members may send a sterling cheque, arrange payment in sterling on a UK bank, or pay by credit card using the BAA’s secure website www.britastro.org. Please note that we do not currently hold a continuous credit payment facility, so your payment must be renewed every year. UK members are particularly asked to save administrative costs and time by paying their subscriptions by Direct Debit: please contact the Office for the necessary form. Gift Aid UK Income Tax payers are urged to complete a Gift Aid certificate for their subscriptions and other donations. To claim Gift Aid you must pay an amount of UK income tax and/or Capital Gains tax at least equal to the tax which we reclaim on your donations in the tax year (currently 25p for each £1 you donate). Please request a Gift Aid form from the Office if you have not previously completed one. The BAA can claim a tax refund at any time during the year. J. Br. Astron. Assoc. 123, 4, 2013