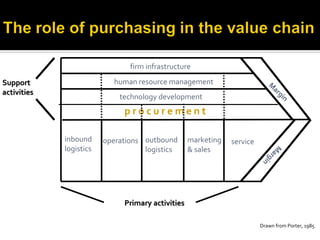
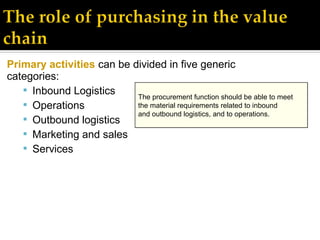
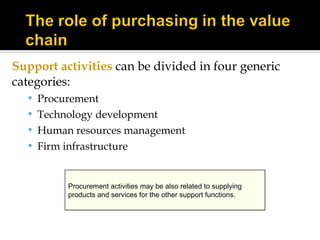
firm infrastructure

Support                     human resource management                       M
                                                                             ar
activities                                                                        gi
                             technology development                                 n

                              procurement

             inbound     operations outbound       marketing   service
             logistics              logistics      & sales


                                                                          M
                                                                           a rg
                                                                               in
                              Primary activities

                                                                         Drawn from Porter, 1985
Primary activities can be divided in five generic
categories:
   ď‚§ Inbound Logistics
                           The procurement function should be able to meet
   ď‚§ Operations            the material requirements related to inbound
                           and outbound logistics, and to operations.
   ď‚§ Outbound logistics
   ď‚§ Marketing and sales
   ď‚§ Services
Support activities can be divided in four generic
categories:
  ď‚§ Procurement
  ď‚§ Technology development
  ď‚§ Human resources management
  ď‚§ Firm infrastructure


          Procurement activities may be also related to supplying
          products and services for the other support functions.
Aspects                 Buying for primary             Buying for support
                                    activities                     activities
  Product assortment              Limited to large                   Very large
  Number of suppliers           Limited, transparent                 Very large
  Purchasing turnover         Very large, considerable                Limited
Number of Purchase orders           Considerable                    Very Large
   Average order size                   High                           Small
         Control            Depends on type of production   Limited, forecast-related or
  Decision-making unit                planning                project-related planning
                             Engineering, manufacturing       Fragmented, varies with
                                specialists dominant             product or service
Different definitions...
 Ordering…
 Buying…                                        Operational, short
                                                  Operational, short
                                                   term, deal and
                                                    term, deal and
 Purchasing…                                          margin
                                                        margin
                                                      oriented
                                                       oriented
 Procurement…
 Sourcing…
                                                    Strategic, long
 Supply Chain Management…                           Strategic, long
                                                term, performance and
                                                 term, performance and
                                                         value
                                                          value
 Value chain management….                              oriented
                                                         oriented


   Purchasing: relates to every activity the company receives an invoice for…
purchasing function

             tactical / initial               ordering/ operational

                                                       Expediting Follow
Internal    Speci-
                      Selecting Contracting   Ordering      and        up/     Supplier
customer   fication
                                                       evaluation evaluation

                      Sourcing                   Supply
                                    Buying
                                  Procurement
Purchasing:
All activities for which the company receives an invoice from outside parties.
Differentiation between:
      ď‚§ Purchasing function
      ď‚§ Purchasing department
Definition:
      “Managing the company’s external resources in such a way that the supply
         of all goods, services, capabilities and knowledge which are necessary
         for running, maintaining and managing the company’s primary and
         support activities is secured at the most favorable conditions”.
Procurement:
All activities that are required in order to get the product from the supplier to its
final destination.
Sourcing:
Finding sources of supply, guaranteeing continuity in supply, ensuring alternative
sources of supply and gathering knowledge of procurable resources.
Purchasing Management:
All activities that are required to manage supplier relationships.
Supply Chain Management:
The management of all activities, information, knowledge and financial resources
associated with the flow and transformation of goods and services up from the raw
materials suppliers, component suppliers and other suppliers in such a way that the
expectations of the end users of the company are being met or surpassed
Value Chain Management:
Challenging suppliers to improve the value proposition to the end-customers of the value
chain. Usually the supplier works closely together with the customer’s technical and
marketing staff to reduce the product’s overall costs and add new designs or features to
the product which increase the value for the end-customer.
5       Admin.
                                                                             12       Services

                                                                             18       Capex

                                                                              3       Spares
60-85       60-80         50-70       60-80                                  12       Trade-
                                                                                      items


                                                                                      Produc
                                                   25-50    10-40            50       tion
                                                                                      parts


Retailers   Computers    Consumer     Automotive   Pharma   Service       Typical
                        electronics                          industry     structure
                                                                        adapted from Kluge, 1996
Importance of purchasing to business
     Challenge for managers: how to manage our EXTENDED ENTERPRISE ?


Sales:               Profit 1,5 %
100%
                      Value added: 20 %


                                                         Question: what should
                                                         managers do?

                     Purchased materials
                     And services: 78,5 %


                                                       Purchased materials and
                                                       services have a large impact
                                                       on company profitability…
Definition of concepts
         Challenge: how to manage our EXTENDED ENTERPRISE ?


Sales:                Profit 1,5 %
100%
                       Value added: 20 %


                                                         Question: what should
                                                         managers do?

                      Purchased materials
                      And services: 78,5 %


                                                       Suppliers determine 78,5%
                                                       of total cost, innovation,
                                                       carbon footprint and
                                                       customer value…
What to Buy?           How much to    When to             From whom
                           buy?            buy?                to buy?


   Store Image

   Satisfy Cust.                                              Suppliers
                       Financial Obj.    Open-to-buy
      Wants
                                                              The Market

Type of Merchandise                                           Negotiations
                          Mdse.
                          Budget           Estimated
 Control Systems                                                Unit
                      Sales                   Sales             Price
                       Reductions                               Terms
   Merchandise                             Beginning Inv.
                        Inventories
    Policies
                         Purchases          Ending Inv.
                          Shortages
 Lead time:  length of time between order
  placement and receipt of goods
 Importance of safety or cushion stock:
  protection against strikes, delays
 Base or cycle stock: amount sufficient to
  accomodate regular sales
 Lead time + Safety stock + Basic stock =
  Inventory Level
 Al’s Grocery Supermarket wants to maintain
 a 3-week supply of domestic biscuits in
 inventory and average sales of MLite biscuits
 are 500 6-packs per week. The order point is
 1500 (500 X 3 weeks). When inventory drops
 below 1500, more biscuits should be ordered.
 Suppose the order interval is 2 weeks. We
 must consider to include stock to maintain
 during the order interval and add to our order
 point -- in order to determine our order
 ceiling. Order ceiling=Order point+Order
 interval sales.
  ď‚§ 1500 + (500 X 2) = 2500
 We can then determine our order quantity by
 subtracting stock on hand from order ceiling.
 ď‚§ Order Quantity = Order ceiling - stock on hand
 Turnover @ retail
  ď‚§ Retail sales/Avg. inv. in retail $
 Turnover @ cost
  ď‚§ Cost of goods sold/avg. inv. at cost
    â–Ş Total $ Available for Sale= BI + Purchases
    â–Ş COGS=Total $ available for sale - Ending inventory
 Turnover based in units
  ď‚§ # of units sold/Avg. inv. in units
 Divide the turnover figure into 12 (months in
 year) to determine the number of times of
 merchandise needed to support the desired
 sales based on turnover
  ď‚§ Examples:
    â–Ş Turnover = 4; Stock-to-sales = 3.0
    â–Ş Turnover = 2.8; Stock-to-sales = 4.28
    â–Ş Turnover = 10; Stock-to-sales = 1.2
  ď‚§ Lower the turnover, the higher the stock-to-sales ratio
   Step 1: Calculate sales-to-stock ratio
    ď‚§ GMROI=gross margin% * sales-to-stock ratio
   Step 2: Convert sales-to-stock ratio to inventory
    turnover
    ď‚§ Inventory turnover = sales-to-stock ratio * (100% - Gross
      margin %, expressed as decimal)
   Calculate average stock-to-sales ratio
    ď‚§ Average stock-to-sales ratio = # months/inventory
      turnover
   Calculate monthly stock-to-sales ratios
 Don’t confuse stock-to-sales ratio with the sales-to-
  stock ratio
 Sales are the same in both ratios
 Stock in the sales-to-stock ratio is the average
  inventory at cost over all days in the period
 Stock in the average stock-to-sales ratio is the
  average BOM inventory at retail
 BOM stock-to-sales ratio is an average for all
  months
 BOM stock = monthly sales * BOM stock-to-
  sales ratio
 EOM stock (BOM stock for current period is
  the same as the end-of-month for the
  previous period)
 Monthly Additions to stock = Sales +
  Reductions + EOM inventory - BOM inventory
 GMROI = gross margin return on inventory
  investment measures how many gross
  margin dollars are earned on every dollar of
  inventory investment
 Sales-to-stock ratio = net sales/avg. inv.
 GMROI = gross margin/avg. inv.
 GMROI combines the effects of profits and
  turnover
 Calculate Projected EOM stock
 ď‚§ Actual BOM stock + monthly additions + order
   amount - Planned monthly sales - planned
   monthly reductions
 Open-to-buy = Planned EOM stock -
 Projected EOM stock
 Calculate projected EOM stock
 ď‚§ Projected BOM stock + actual order - monthly
   sales - planned reductions
 Open-to-buy = Planned EOM stock -
 Projected EOM stock
 ABC Analysis
 ď‚§ Rank order merchandise categories (SKUs) by
   some performance measure
   â–Ş   Contribution margin
   â–Ş   Sales Dollars/Units
   â–Ş   Gross margin
   â–Ş   Gross margin return on investment
   â–Ş   Sales or gross margin per square foot
 ď‚§ Determine optimal stocking formulas based on
   performance measures
 Sell-Through Analysis
 ď‚§ Comparison between actual and planned sales to
   determine whether early markdowns are required
   or whether more merchandise is needed to satisfy
   demand
 Multiple-Attribute Method
 ď‚§ Used to evaluate vendors using a weighted
   average score for each vendor (current or
   proposed).
DuPont analysis:                                     Sales
                                                             105 Cr.
           Capital turn-                                                    Total assets
           over ratio                            /                                 145 Cr
                    2.1 x                            Net assets         -
                                                            50 Cr.
                                                                            Interest free
                                                                            liabilities
                                                                                      95 Cr

RONA
       9.9 %        Ă—                                Sales
                                                              105 Cr.
                                Income
                                before tax       -                          Other costs
                                          5 cr                                      40 cr
           Margin           /                        Total costs
                    4.7 %                                               +
                                                             100 cr
                                                                            Purchased
                                Sales                                       mat. & serv.
                                        105 cr                                      60 cr
Amounts in Rs. Crores
DuPont analysis:                                      Sales
                                                                105 Cr
            Capital turn-                                                     Total assets
            over ratio                            /                                  145 Cr
                     2.1 x                              Net assets       -
                                                                50 Cr
                                                                              Interest free
                                                                              liabilities
                                                                                        95 Cr

RONA
12.4 ---- %
       9.9           Ă—                                  Sales
                                                                105 Cr
+ 25 % !!                        Income
                                 before tax       -                           Other costs
                                  6.2 -- 5 Cr                                         40 Cr
            Margin           /                          Total costs
              5.9 --- %
                    4.7                                                  +
                                                      98.8 ----100 Cr
                                                                              Purchased
                                 Sales                                        mat.& serv.
                                         105 Cr                              58.8 --- 60 Cr
Amounts in Rs Cr                                                               -2%
Amit is a Retail Business Consultant with 11 years of experience with multi retailer format Super Market,
Hypermarkets, Lifestyle and Specialty stores. Experienced in Buying, Merchandising, Category
Management, Vendor Management and Supply Chain Management for multiple product categories.

He is experienced across the retail value chain in conducting business analysis and defining business
requirements, Retail Business Process Reviews, Software Product Development and Analytics for retail
business transformation and IT enhancement programs on retail supply chain, vendor management &
multi-channel commerce.

He holds an MBA in International Business, certification from NIFT, Fashion Retail Management and
trained Certified Business Analyst as per IIBA norms.

Currently, he is Senior Retail Functional Consultant with Leading Retail IT company of analytic solutions
for global retail and CPG organizations in roles such as Functional Consultant and Business Analyst
responsible for creating new solutions to drive innovation and thought leadership across the retail
business unit.

Retail procurement process and analysis

  • 2.
    firm infrastructure Support human resource management M ar activities gi technology development n procurement inbound operations outbound marketing service logistics logistics & sales M a rg in Primary activities Drawn from Porter, 1985
  • 3.
    Primary activities canbe divided in five generic categories: ď‚§ Inbound Logistics The procurement function should be able to meet ď‚§ Operations the material requirements related to inbound and outbound logistics, and to operations. ď‚§ Outbound logistics ď‚§ Marketing and sales ď‚§ Services
  • 4.
    Support activities canbe divided in four generic categories: ď‚§ Procurement ď‚§ Technology development ď‚§ Human resources management ď‚§ Firm infrastructure Procurement activities may be also related to supplying products and services for the other support functions.
  • 5.
    Aspects Buying for primary Buying for support activities activities Product assortment Limited to large Very large Number of suppliers Limited, transparent Very large Purchasing turnover Very large, considerable Limited Number of Purchase orders Considerable Very Large Average order size High Small Control Depends on type of production Limited, forecast-related or Decision-making unit planning project-related planning Engineering, manufacturing Fragmented, varies with specialists dominant product or service
  • 6.
    Different definitions...  Ordering… Buying… Operational, short Operational, short term, deal and term, deal and  Purchasing… margin margin oriented oriented  Procurement…  Sourcing… Strategic, long  Supply Chain Management… Strategic, long term, performance and term, performance and value value  Value chain management…. oriented oriented Purchasing: relates to every activity the company receives an invoice for…
  • 7.
    purchasing function tactical / initial ordering/ operational Expediting Follow Internal Speci- Selecting Contracting Ordering and up/ Supplier customer fication evaluation evaluation Sourcing Supply Buying Procurement
  • 8.
    Purchasing: All activities forwhich the company receives an invoice from outside parties. Differentiation between:  Purchasing function  Purchasing department Definition: “Managing the company’s external resources in such a way that the supply of all goods, services, capabilities and knowledge which are necessary for running, maintaining and managing the company’s primary and support activities is secured at the most favorable conditions”. Procurement: All activities that are required in order to get the product from the supplier to its final destination.
  • 9.
    Sourcing: Finding sources ofsupply, guaranteeing continuity in supply, ensuring alternative sources of supply and gathering knowledge of procurable resources. Purchasing Management: All activities that are required to manage supplier relationships. Supply Chain Management: The management of all activities, information, knowledge and financial resources associated with the flow and transformation of goods and services up from the raw materials suppliers, component suppliers and other suppliers in such a way that the expectations of the end users of the company are being met or surpassed Value Chain Management: Challenging suppliers to improve the value proposition to the end-customers of the value chain. Usually the supplier works closely together with the customer’s technical and marketing staff to reduce the product’s overall costs and add new designs or features to the product which increase the value for the end-customer.
  • 10.
    5 Admin. 12 Services 18 Capex 3 Spares 60-85 60-80 50-70 60-80 12 Trade- items Produc 25-50 10-40 50 tion parts Retailers Computers Consumer Automotive Pharma Service Typical electronics industry structure adapted from Kluge, 1996
  • 11.
    Importance of purchasingto business Challenge for managers: how to manage our EXTENDED ENTERPRISE ? Sales: Profit 1,5 % 100% Value added: 20 % Question: what should managers do? Purchased materials And services: 78,5 % Purchased materials and services have a large impact on company profitability…
  • 12.
    Definition of concepts Challenge: how to manage our EXTENDED ENTERPRISE ? Sales: Profit 1,5 % 100% Value added: 20 % Question: what should managers do? Purchased materials And services: 78,5 % Suppliers determine 78,5% of total cost, innovation, carbon footprint and customer value…
  • 14.
    What to Buy? How much to When to From whom buy? buy? to buy? Store Image Satisfy Cust. Suppliers Financial Obj. Open-to-buy Wants The Market Type of Merchandise Negotiations Mdse. Budget Estimated Control Systems Unit Sales Sales Price Reductions Terms Merchandise Beginning Inv. Inventories Policies Purchases Ending Inv. Shortages
  • 15.
     Lead time: length of time between order placement and receipt of goods  Importance of safety or cushion stock: protection against strikes, delays  Base or cycle stock: amount sufficient to accomodate regular sales  Lead time + Safety stock + Basic stock = Inventory Level
  • 16.
     Al’s GrocerySupermarket wants to maintain a 3-week supply of domestic biscuits in inventory and average sales of MLite biscuits are 500 6-packs per week. The order point is 1500 (500 X 3 weeks). When inventory drops below 1500, more biscuits should be ordered.
  • 17.
     Suppose theorder interval is 2 weeks. We must consider to include stock to maintain during the order interval and add to our order point -- in order to determine our order ceiling. Order ceiling=Order point+Order interval sales.  1500 + (500 X 2) = 2500
  • 18.
     We canthen determine our order quantity by subtracting stock on hand from order ceiling.  Order Quantity = Order ceiling - stock on hand
  • 19.
     Turnover @retail  Retail sales/Avg. inv. in retail $  Turnover @ cost  Cost of goods sold/avg. inv. at cost ▪ Total $ Available for Sale= BI + Purchases ▪ COGS=Total $ available for sale - Ending inventory  Turnover based in units  # of units sold/Avg. inv. in units
  • 20.
     Divide theturnover figure into 12 (months in year) to determine the number of times of merchandise needed to support the desired sales based on turnover  Examples: ▪ Turnover = 4; Stock-to-sales = 3.0 ▪ Turnover = 2.8; Stock-to-sales = 4.28 ▪ Turnover = 10; Stock-to-sales = 1.2  Lower the turnover, the higher the stock-to-sales ratio
  • 21.
     Step 1: Calculate sales-to-stock ratio  GMROI=gross margin% * sales-to-stock ratio  Step 2: Convert sales-to-stock ratio to inventory turnover  Inventory turnover = sales-to-stock ratio * (100% - Gross margin %, expressed as decimal)  Calculate average stock-to-sales ratio  Average stock-to-sales ratio = # months/inventory turnover  Calculate monthly stock-to-sales ratios
  • 22.
     Don’t confusestock-to-sales ratio with the sales-to- stock ratio  Sales are the same in both ratios  Stock in the sales-to-stock ratio is the average inventory at cost over all days in the period  Stock in the average stock-to-sales ratio is the average BOM inventory at retail  BOM stock-to-sales ratio is an average for all months
  • 23.
     BOM stock= monthly sales * BOM stock-to- sales ratio  EOM stock (BOM stock for current period is the same as the end-of-month for the previous period)  Monthly Additions to stock = Sales + Reductions + EOM inventory - BOM inventory
  • 24.
     GMROI =gross margin return on inventory investment measures how many gross margin dollars are earned on every dollar of inventory investment  Sales-to-stock ratio = net sales/avg. inv.  GMROI = gross margin/avg. inv.  GMROI combines the effects of profits and turnover
  • 25.
     Calculate ProjectedEOM stock  Actual BOM stock + monthly additions + order amount - Planned monthly sales - planned monthly reductions  Open-to-buy = Planned EOM stock - Projected EOM stock
  • 26.
     Calculate projectedEOM stock  Projected BOM stock + actual order - monthly sales - planned reductions  Open-to-buy = Planned EOM stock - Projected EOM stock
  • 27.
     ABC Analysis  Rank order merchandise categories (SKUs) by some performance measure ▪ Contribution margin ▪ Sales Dollars/Units ▪ Gross margin ▪ Gross margin return on investment ▪ Sales or gross margin per square foot  Determine optimal stocking formulas based on performance measures
  • 28.
     Sell-Through Analysis  Comparison between actual and planned sales to determine whether early markdowns are required or whether more merchandise is needed to satisfy demand  Multiple-Attribute Method  Used to evaluate vendors using a weighted average score for each vendor (current or proposed).
  • 29.
    DuPont analysis: Sales 105 Cr. Capital turn- Total assets over ratio / 145 Cr 2.1 x Net assets - 50 Cr. Interest free liabilities 95 Cr RONA 9.9 % Ă— Sales 105 Cr. Income before tax - Other costs 5 cr 40 cr Margin / Total costs 4.7 % + 100 cr Purchased Sales mat. & serv. 105 cr 60 cr Amounts in Rs. Crores
  • 30.
    DuPont analysis: Sales 105 Cr Capital turn- Total assets over ratio / 145 Cr 2.1 x Net assets - 50 Cr Interest free liabilities 95 Cr RONA 12.4 ---- % 9.9 Ă— Sales 105 Cr + 25 % !! Income before tax - Other costs 6.2 -- 5 Cr 40 Cr Margin / Total costs 5.9 --- % 4.7 + 98.8 ----100 Cr Purchased Sales mat.& serv. 105 Cr 58.8 --- 60 Cr Amounts in Rs Cr -2%
  • 32.
    Amit is aRetail Business Consultant with 11 years of experience with multi retailer format Super Market, Hypermarkets, Lifestyle and Specialty stores. Experienced in Buying, Merchandising, Category Management, Vendor Management and Supply Chain Management for multiple product categories. He is experienced across the retail value chain in conducting business analysis and defining business requirements, Retail Business Process Reviews, Software Product Development and Analytics for retail business transformation and IT enhancement programs on retail supply chain, vendor management & multi-channel commerce. He holds an MBA in International Business, certification from NIFT, Fashion Retail Management and trained Certified Business Analyst as per IIBA norms. Currently, he is Senior Retail Functional Consultant with Leading Retail IT company of analytic solutions for global retail and CPG organizations in roles such as Functional Consultant and Business Analyst responsible for creating new solutions to drive innovation and thought leadership across the retail business unit.

Editor's Notes

  • #12 GITP International BV 22/09/12 [vul documentcode in]
  • #13 GITP International BV 22/09/12 [vul documentcode in]