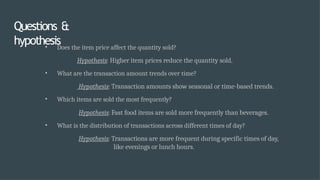
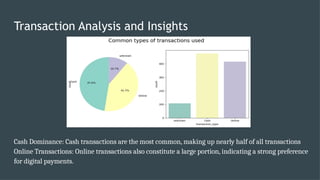
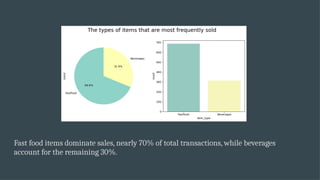
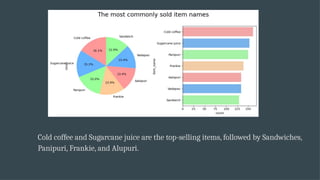
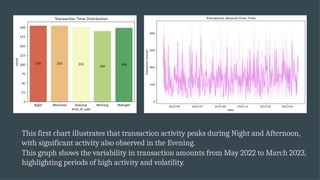
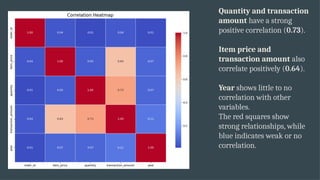
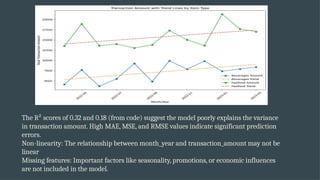
RestaurantSales
Analysis Report
Content
s
1. Questions & hypothesis
2. Approach and analysis
3. Technical challenges
4. Transaction Analysis and
Insights
5. Results
Questions &
hypothesis
• Does the item price affect the quantity sold?
Hypothesis: Higher item prices reduce the quantity sold.
• What are the transaction amount trends over time?
Hypothesis: Transaction amounts show seasonal or time-based trends.
• Which items are sold the most frequently?
Hypothesis: Fast food items are sold more frequently than beverages.
• What is the distribution of transactions across different times of day?
Hypothesis: Transactions are more frequent during specific times of day,
like evenings or lunch hours.
Approach and
Analysis
1. Data tables downloaded from kaggle.com
2. Formatted, compiled, and cleaned in one single dataset
3. The columns transaction amounts, times, item names, and types of transactions will
be considered to answer our questions
4. Statistical inference and graphical visualization will be employed
Technical
challenges
1. Data Cleaning: Addressing missing values, inconsistent formats, and correcting data
entry errors to ensure reliable analysis.
2. Data Transformation: Converting dates to a consistent format and aggregating data
for meaningful time-based analysis.
3. Visualization Integration: Ensuring that visualizations accurately reflect the data
and effectively communicate insights.
4. Handling Time Series Data: Managing and analyzing trends over time, dealing with
seasonality and irregularities in the data.
Transaction Analysis and Insights
Cash Dominance: Cash transactions are the most common, making up nearly half of all transactions
Online Transactions: Online transactions also constitute a large portion, indicating a strong preference
for digital payments.
Fast food items dominate sales, nearly 70% of total transactions, while beverages
account for the remaining 30%.
Cold coffee and Sugarcane juice are the top-selling items, followed by Sandwiches,
Panipuri, Frankie, and Alupuri.
This first chart illustrates that transaction activity peaks during Night and Afternoon,
with significant activity also observed in the Evening.
This graph shows the variability in transaction amounts from May 2022 to March 2023,
highlighting periods of high activity and volatility.
Quantity and transaction
amount have a strong
positive correlation (0.73).
Item price and
transaction amount also
correlate positively (0.64).
Year shows little to no
correlation with other
variables.
The red squares show
strong relationships, while
blue indicates weak or no
correlation.
The R² scores of 0.32 and 0.18 (from code) suggest the model poorly explains the variance
in transaction amount. High MAE, MSE, and RMSE values indicate significant prediction
errors.
Non-linearity: The relationship between month_year and transaction_amount may not be
linear
Missing features: Important factors like seasonality, promotions, or economic influences
are not included in the model.
Final
results
1. Does the type of item influence the quantity sold?
Result: Fast food items, such as Vadapav and Panipuri, tend to be sold in larger quantities than
beverages. However, item type alone doesn't completely explain the variations in quantity sold;
other factors such as time of day and transaction type might play a role.
2. Which item is sold the most frequently over time?
Result: Vadapav and Panipuri were consistently among the most sold items, with Panipuri peaking in
multiple instances. Fast food remains the most popular item category in terms of sales volume.
3. Is there a peak time for sales during the day?
Result: Evening and night are the busiest times for transactions, especially for fast food items. This
indicates a strong demand for quick meals during these hours, potentially driven by after-work
or social gatherings.
4. Which transaction type is most commonly used, and does it impact the overall sales?
Result: Cash transactions slightly edge out online transactions, but both types contribute significantly to
total sales. There doesn’t appear to be a drastic difference in sales volume based on transaction
type, though cash tends to dominate for fast-moving, low-cost items.

Restaurant Sales Data Analysis Project using python and excel

  • 1.
  • 2.
    Content s 1. Questions &hypothesis 2. Approach and analysis 3. Technical challenges 4. Transaction Analysis and Insights 5. Results
  • 3.
    Questions & hypothesis • Doesthe item price affect the quantity sold? Hypothesis: Higher item prices reduce the quantity sold. • What are the transaction amount trends over time? Hypothesis: Transaction amounts show seasonal or time-based trends. • Which items are sold the most frequently? Hypothesis: Fast food items are sold more frequently than beverages. • What is the distribution of transactions across different times of day? Hypothesis: Transactions are more frequent during specific times of day, like evenings or lunch hours.
  • 4.
    Approach and Analysis 1. Datatables downloaded from kaggle.com 2. Formatted, compiled, and cleaned in one single dataset 3. The columns transaction amounts, times, item names, and types of transactions will be considered to answer our questions 4. Statistical inference and graphical visualization will be employed
  • 5.
    Technical challenges 1. Data Cleaning:Addressing missing values, inconsistent formats, and correcting data entry errors to ensure reliable analysis. 2. Data Transformation: Converting dates to a consistent format and aggregating data for meaningful time-based analysis. 3. Visualization Integration: Ensuring that visualizations accurately reflect the data and effectively communicate insights. 4. Handling Time Series Data: Managing and analyzing trends over time, dealing with seasonality and irregularities in the data.
  • 6.
    Transaction Analysis andInsights Cash Dominance: Cash transactions are the most common, making up nearly half of all transactions Online Transactions: Online transactions also constitute a large portion, indicating a strong preference for digital payments.
  • 7.
    Fast food itemsdominate sales, nearly 70% of total transactions, while beverages account for the remaining 30%.
  • 8.
    Cold coffee andSugarcane juice are the top-selling items, followed by Sandwiches, Panipuri, Frankie, and Alupuri.
  • 9.
    This first chartillustrates that transaction activity peaks during Night and Afternoon, with significant activity also observed in the Evening. This graph shows the variability in transaction amounts from May 2022 to March 2023, highlighting periods of high activity and volatility.
  • 10.
    Quantity and transaction amounthave a strong positive correlation (0.73). Item price and transaction amount also correlate positively (0.64). Year shows little to no correlation with other variables. The red squares show strong relationships, while blue indicates weak or no correlation.
  • 11.
    The R² scoresof 0.32 and 0.18 (from code) suggest the model poorly explains the variance in transaction amount. High MAE, MSE, and RMSE values indicate significant prediction errors. Non-linearity: The relationship between month_year and transaction_amount may not be linear Missing features: Important factors like seasonality, promotions, or economic influences are not included in the model.
  • 12.
    Final results 1. Does thetype of item influence the quantity sold? Result: Fast food items, such as Vadapav and Panipuri, tend to be sold in larger quantities than beverages. However, item type alone doesn't completely explain the variations in quantity sold; other factors such as time of day and transaction type might play a role. 2. Which item is sold the most frequently over time? Result: Vadapav and Panipuri were consistently among the most sold items, with Panipuri peaking in multiple instances. Fast food remains the most popular item category in terms of sales volume. 3. Is there a peak time for sales during the day? Result: Evening and night are the busiest times for transactions, especially for fast food items. This indicates a strong demand for quick meals during these hours, potentially driven by after-work or social gatherings. 4. Which transaction type is most commonly used, and does it impact the overall sales? Result: Cash transactions slightly edge out online transactions, but both types contribute significantly to total sales. There doesn’t appear to be a drastic difference in sales volume based on transaction type, though cash tends to dominate for fast-moving, low-cost items.