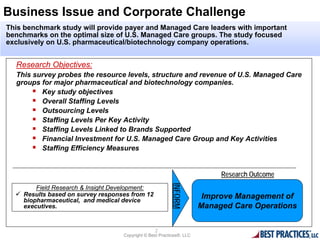
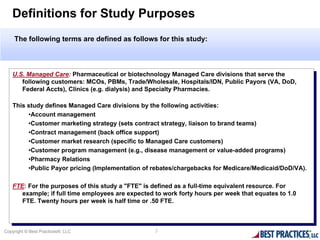
Resource Benchmarks for U.S.
Pharmaceutical Managed Care Operations


          Best Practices, LLC Benchmarking Report
Table of Contents

                                    Project Overview
                                    Key Findings
                                    Structure, Revenue and Brand Oversight
                                    Staffing Profiles for U.S. Managed Care
                                    Budget Allocation By Activity for U.S.
                                     Managed Care
                                    Efficiency Ratios
                                    Best Practices


Copyright © Best Practices®, LLC                  1
Business Issue and Corporate Challenge
This benchmark study will provide payer and Managed Care leaders with important
benchmarks on the optimal size of U.S. Managed Care groups. The study focused
exclusively on U.S. pharmaceutical/biotechnology company operations.


  Research Objectives:
  This survey probes the resource levels, structure and revenue of U.S. Managed Care
  groups for major pharmaceutical and biotechnology companies.
        Key study objectives
        Overall Staffing Levels
        Outsourcing Levels
        Staffing Levels Per Key Activity
        Staffing Levels Linked to Brands Supported
        Financial Investment for U.S. Managed Care Group and Key Activities
        Staffing Efficiency Measures

                                                          INFORM           Research Outcome
        Field Research & Insight Development:
   Results based on survey responses from 12                          Improve Management of
    biopharmaceutical, and medical device
    executives.                                                       Managed Care Operations


                                                 2
                                   Copyright © Best Practices®, LLC
Definitions for Study Purposes
    The following terms are defined as follows for this study:


   U.S. Managed Care: Pharmaceutical or biotechnology Managed Care divisions that serve the
    U.S. Managed Care: Pharmaceutical or biotechnology Managed Care divisions that serve the
      following customers: MCOs, PBMs, Trade/Wholesale, Hospitals/IDN, Public Payors (VA, DoD,
       following customers: MCOs, PBMs, Trade/Wholesale, Hospitals/IDN, Public Payors (VA, DoD,
      Federal Accts), Clinics (e.g. dialysis) and Specialty Pharmacies.
       Federal Accts), Clinics (e.g. dialysis) and Specialty Pharmacies.

    This study defines Managed Care divisions by the following activities:
     This study defines Managed Care divisions by the following activities:
         •Account management
          •Account management
         •Customer marketing strategy (sets contract strategy, liaison to brand teams)
          •Customer marketing strategy (sets contract strategy, liaison to brand teams)
         •Contract management (back office support)
          •Contract management (back office support)
         •Customer market research (specific to Managed Care customers)
          •Customer market research (specific to Managed Care customers)
         •Customer program management (e.g., disease management or value-added programs)
          •Customer program management (e.g., disease management or value-added programs)
         •Pharmacy Relations
          •Pharmacy Relations
         •Public Payor pricing (Implementation of rebates/chargebacks for Medicare/Medicaid/DoD/VA).
          •Public Payor pricing (Implementation of rebates/chargebacks for Medicare/Medicaid/DoD/VA).

    FTE: For the purposes of this study aa"FTE" is defined as aafull-time equivalent resource. For
     FTE: For the purposes of this study "FTE" is defined as full-time equivalent resource. For
       example; ififfull time employees are expected to work forty hours per week that equates to 1.0
        example; full time employees are expected to work forty hours per week that equates to 1.0
       FTE. Twenty hours per week is half time or .50 FTE.
        FTE. Twenty hours per week is half time or .50 FTE.


Copyright © Best Practices®, LLC                    3
List of Participating Companies/ Range of
      Career Levels
The benchmark class includes 12 participants from the companies across pharmaceutical,
biotech and medical device industries. Their roles ranged from senior leaders to
managers of managed markets.

   Bayer Healthcare                            Director Marketing Managed Markets
   Shire                                       Sr. Exec. Dir, Sales Rep
   GlaxoSmithKline -                           Executive Director, Sales
      Respiratory                                  Representative
     GlaxoSmithKline                             Sr. Director, MM
     Millennium                                  Senior Director, US Market Access
     Smith & Nephew                              Health Policy & Reimbursement
     Forest Laboratories                          Director
     Alcon                                       National Director, Managed Market
     Acorda Therapeutics                          Sales
     Amylin                                      Vice President
     Purdue                                      Assistant Director, Managed Care
                                                   Training


Copyright © Best Practices®, LLC         4
Key Findings
 The following key findings and insights emerged from the field surveys, direct interviews
 and study verbatim.


       All U.S. Managed Care Headcount is internal staff: Members of the benchmark
          class do not actively outsource their Managed Care activities. Almost all the
          activities are performed internally at the benchmark companies.


       Account Management & Contract Management have the highest average
          headcounts: The average FTE deployed for Account Management and Contract
          Management activities shows the important role in overall Managed Care business
          in the United States. Account management is the most critical activity in U.S.
          Managed Care.


Copyright © Best Practices®, LLC                5
Managed Care Structure Remains Centralized
   Sixty-seven percent of benchmark companies prefer a centralized structure to organize
   their Managed Care function. More than 90% of benchmarked organizations Managed
   Care function either have a hybrid or centralized structure compared to 100% centralized
   structure in 2003.

                          How are Managed Care resources organized in your U.S. operations?

                                                       Decentralized
                                                           , 8%


                                                               Hybrid, 25%


                                                Centralized,
                                                   67%


      N=12
Copyright © Best Practices®, LLC                        6
Managed Care Supports Myriad of Services
Almost all the activities performed at the benchmarked companies are supported by U.S.
Managed Care. Amongst all the activities, one thirds of the benchmark class do not support
activities like customer market research, customer program and pharmacy relations.

                                   Does Your U.S. Managed Care Support following activities?

                                                          Yes       No


                                                17%             33%         33%           33%           8%


           100%                100%
                                                                                                       92%
                                                83%
                                                                67%        67%           67%


       Account              Customer          Contract      Customer     Customer      Pharmacy     Public payor
      management            marketing        management      market      program        relations     pricing
                                                            research
      N=12
Copyright © Best Practices®, LLC                                7
Customer Marketing Strategy FTE Allocation
The average FTEs in 2010 are only one-third of what they were in 2003 for the Customer
Marketing Strategy function.


                                   Number of Total FTEs for Customer Marketing Strategy

                 14


                                      8.5

                                                     6

                                                                   4
                                                                                 2.5       2


                Max                  75th          Mean         Median          25th       Min
                                   Percentile                                 Percentile

             N=11

Copyright © Best Practices®, LLC                           8
About Best Practices, LLC


       Best Practices, LLC is a research and consulting firm that conducts work
       based on the simple yet profound principle that organizations can chart a
       course to superior economic performance by studying the best business
          practices, operating tactics and winning strategies of world-class
                                      companies.


                                   Best Practices, LLC
                      6350 Quadrangle Drive, Suite 200, Chapel Hill, NC 27517
                                          919-403-0251
                                    best@best-in-class.com
                                    www.best-in-class.com

Copyright © Best Practices®, LLC                9

Resource Benchmarks for U.S. Pharmaceutical Managed Care Operations

  • 1.
    Resource Benchmarks forU.S. Pharmaceutical Managed Care Operations Best Practices, LLC Benchmarking Report
  • 2.
    Table of Contents  Project Overview  Key Findings  Structure, Revenue and Brand Oversight  Staffing Profiles for U.S. Managed Care  Budget Allocation By Activity for U.S. Managed Care  Efficiency Ratios  Best Practices Copyright © Best Practices®, LLC 1
  • 3.
    Business Issue andCorporate Challenge This benchmark study will provide payer and Managed Care leaders with important benchmarks on the optimal size of U.S. Managed Care groups. The study focused exclusively on U.S. pharmaceutical/biotechnology company operations. Research Objectives: This survey probes the resource levels, structure and revenue of U.S. Managed Care groups for major pharmaceutical and biotechnology companies.  Key study objectives  Overall Staffing Levels  Outsourcing Levels  Staffing Levels Per Key Activity  Staffing Levels Linked to Brands Supported  Financial Investment for U.S. Managed Care Group and Key Activities  Staffing Efficiency Measures INFORM Research Outcome Field Research & Insight Development:  Results based on survey responses from 12 Improve Management of biopharmaceutical, and medical device executives. Managed Care Operations 2 Copyright © Best Practices®, LLC
  • 4.
    Definitions for StudyPurposes The following terms are defined as follows for this study: U.S. Managed Care: Pharmaceutical or biotechnology Managed Care divisions that serve the U.S. Managed Care: Pharmaceutical or biotechnology Managed Care divisions that serve the following customers: MCOs, PBMs, Trade/Wholesale, Hospitals/IDN, Public Payors (VA, DoD, following customers: MCOs, PBMs, Trade/Wholesale, Hospitals/IDN, Public Payors (VA, DoD, Federal Accts), Clinics (e.g. dialysis) and Specialty Pharmacies. Federal Accts), Clinics (e.g. dialysis) and Specialty Pharmacies. This study defines Managed Care divisions by the following activities: This study defines Managed Care divisions by the following activities: •Account management •Account management •Customer marketing strategy (sets contract strategy, liaison to brand teams) •Customer marketing strategy (sets contract strategy, liaison to brand teams) •Contract management (back office support) •Contract management (back office support) •Customer market research (specific to Managed Care customers) •Customer market research (specific to Managed Care customers) •Customer program management (e.g., disease management or value-added programs) •Customer program management (e.g., disease management or value-added programs) •Pharmacy Relations •Pharmacy Relations •Public Payor pricing (Implementation of rebates/chargebacks for Medicare/Medicaid/DoD/VA). •Public Payor pricing (Implementation of rebates/chargebacks for Medicare/Medicaid/DoD/VA). FTE: For the purposes of this study aa"FTE" is defined as aafull-time equivalent resource. For FTE: For the purposes of this study "FTE" is defined as full-time equivalent resource. For example; ififfull time employees are expected to work forty hours per week that equates to 1.0 example; full time employees are expected to work forty hours per week that equates to 1.0 FTE. Twenty hours per week is half time or .50 FTE. FTE. Twenty hours per week is half time or .50 FTE. Copyright © Best Practices®, LLC 3
  • 5.
    List of ParticipatingCompanies/ Range of Career Levels The benchmark class includes 12 participants from the companies across pharmaceutical, biotech and medical device industries. Their roles ranged from senior leaders to managers of managed markets.  Bayer Healthcare  Director Marketing Managed Markets  Shire  Sr. Exec. Dir, Sales Rep  GlaxoSmithKline -  Executive Director, Sales Respiratory Representative  GlaxoSmithKline  Sr. Director, MM  Millennium  Senior Director, US Market Access  Smith & Nephew  Health Policy & Reimbursement  Forest Laboratories Director  Alcon  National Director, Managed Market  Acorda Therapeutics Sales  Amylin  Vice President  Purdue  Assistant Director, Managed Care Training Copyright © Best Practices®, LLC 4
  • 6.
    Key Findings Thefollowing key findings and insights emerged from the field surveys, direct interviews and study verbatim.  All U.S. Managed Care Headcount is internal staff: Members of the benchmark class do not actively outsource their Managed Care activities. Almost all the activities are performed internally at the benchmark companies.  Account Management & Contract Management have the highest average headcounts: The average FTE deployed for Account Management and Contract Management activities shows the important role in overall Managed Care business in the United States. Account management is the most critical activity in U.S. Managed Care. Copyright © Best Practices®, LLC 5
  • 7.
    Managed Care StructureRemains Centralized Sixty-seven percent of benchmark companies prefer a centralized structure to organize their Managed Care function. More than 90% of benchmarked organizations Managed Care function either have a hybrid or centralized structure compared to 100% centralized structure in 2003. How are Managed Care resources organized in your U.S. operations? Decentralized , 8% Hybrid, 25% Centralized, 67% N=12 Copyright © Best Practices®, LLC 6
  • 8.
    Managed Care SupportsMyriad of Services Almost all the activities performed at the benchmarked companies are supported by U.S. Managed Care. Amongst all the activities, one thirds of the benchmark class do not support activities like customer market research, customer program and pharmacy relations. Does Your U.S. Managed Care Support following activities? Yes No 17% 33% 33% 33% 8% 100% 100% 92% 83% 67% 67% 67% Account Customer Contract Customer Customer Pharmacy Public payor management marketing management market program relations pricing research N=12 Copyright © Best Practices®, LLC 7
  • 9.
    Customer Marketing StrategyFTE Allocation The average FTEs in 2010 are only one-third of what they were in 2003 for the Customer Marketing Strategy function. Number of Total FTEs for Customer Marketing Strategy 14 8.5 6 4 2.5 2 Max 75th Mean Median 25th Min Percentile Percentile N=11 Copyright © Best Practices®, LLC 8
  • 10.
    About Best Practices,LLC Best Practices, LLC is a research and consulting firm that conducts work based on the simple yet profound principle that organizations can chart a course to superior economic performance by studying the best business practices, operating tactics and winning strategies of world-class companies. Best Practices, LLC 6350 Quadrangle Drive, Suite 200, Chapel Hill, NC 27517 919-403-0251 best@best-in-class.com www.best-in-class.com Copyright © Best Practices®, LLC 9