Wollega University ShambuCampus Faculty of
Agriculture
Dep't Fisheries, Wetlands and Wildlife
Research Methods and Experimental Design
Fantahun Dereje
2.
Meaning and Conceptsof Scientific Research
The word research is composed of two syllables, re and search.
re is a prefix meaning again, anew or over again
search is a verb meaning to examine closely and carefully, to test and try, or to probe.
Together they form a noun describing a careful, systematic, patient study and investigation in some field
of knowledge, undertaken to establish facts or principles.
Research is a structured enquiry that utilizes acceptable scientific methodology to solve problems and
create new knowledge that is generally applicable.
Research is a process of collecting, analyzing and interpreting information to answer questions
Research refers to a search for knowledge or facts.
It can be also defined as a scientific and systematic search for pertinent information on a specific topic. In
fact, Research is an art of scientific investigation.
3.
Meaning ……
Differentscholars define research in different ways as:
Redman and Mory define research as a “systematized effort to gain new knowledge.
Some people consider research as a movement:- a movement from the known to the
unknown. It is actually a voyage of discovery.
We all possess the vital instinct of inquisitiveness or eagerness for, when the unknown
confronts us, we wonder and our inquisitiveness makes us probe and attain full and fuller
understanding of the unknown.
This inquisitiveness is the mother of all knowledge and the method which man employs
for obtaining the knowledge of whatever the unknown can be termed as Research.
4.
Slesinger andM. Stephenson, define research as “the manipulation of things, concepts or symbols for the
purpose of generalizing to extend, correct or verify knowledge, whether that knowledge aids in construction
of theory or in the practice of an art.
Research is, thus, an original contributor to the existing stock of knowledge making for its advancement. It
is the pursuit or hobbying of truth with the help of study, observation, comparison and experiment.
Research is an academic activity and as such the term should be used in a technical sense. According to
Clifford Woody, research comprises defining and redefining problems, formulating hypothesis or suggested
solutions; collecting, organizing and evaluating data; making deductions and reaching conclusions; and at
last carefully testing the conclusions to determine whether they fit the formulated hypothesis or not.
In short, the search for knowledge through objectives and systematic method of finding solution to a
problem is a Research.
Meaning ……
5.
Research can beclassified from three perspectives:
Application of the research study
Objectives in undertaking the research
Inquiry mode employed
1.Based on Application of the research study:
From the point of view of application, there are two broad categories of research:
pure (basic or fundamental) research and
applied (or action) research
TYPES OF RESEARCH
6.
Pure researchinvolves developing and testing theories and hypotheses that are intellectually
challenging to the researcher but may or may not have practical application at the present
time or in the future.
The knowledge produced through pure research is sought in order to add to the existing body
of research methods.
Applied research is done to solve specific, practical questions; for policy formulation,
administration and understanding of a phenomenon.
It is aimed at certain conclusions (solution) facing a concrete social or business problem
It can be exploratory, but is usually descriptive.
TYPES OF RESEARCH…
7.
2. Based onobjectives in undertaking the research
From the viewpoint of objectives, a research can be classified as:
-Descriptive
-Correlational
-Explanatory
-Exploratory
Descriptive research attempts to describe systematically a situation, problem, phenomenon, service or
programme, or provides information about, say, living condition of a community, or describes attitudes
towards an issue.
The main characteristic of this method is that the researcher has no control over the variables; he can
only report what has happened or what is happening.
TYPES OF RESEARCH…
8.
Correlational researchattempts to discover or establish the existence of a relationship/
interdependence between two or more aspects of a situation.
Explanatory research attempts to clarify why and how there is a relationship between two
or more aspects of a situation or phenomenon.
Exploratory research is undertaken to explore an area where little is known or to
investigate the possibilities of undertaking a particular research study (feasibility study/
pilot study).
In practice most studies are a combination of the first three categories.
TYPES OF RESEARCH…
9.
3. Based oninquiry mode employed
From the process adopted to find answer to research questions – the two approaches are:
- Structured approach
- Unstructured approach
Structured approach: The structured approach to inquiry is usually classified as
quantitative research.
Here everything that forms the research process- objectives, design, sample, and the
questions that you plan to ask of respondents- is predetermined.
It is more appropriate to determine the extent of a problem, issue or phenomenon by
quantifying the variation.
e.g. how many people consume fish? How many people have good attitude toward
fish rearing?
TYPES OF RESEARCH…
10.
Unstructured approach:The unstructured approach to inquiry is usually classified as
qualitative research.
This approach allows flexibility in all aspects of the research process.
It is more appropriate to explore the nature of a problem, issue or phenomenon without
quantifying it.
Main objective is to describe the variation in a phenomenon, situation or attitude.
e.g., description of an observed situation, the historical enumeration of events, an
account of different opinions different people have about an issue, description of
working condition in a particular industry.
Note: In many studies you have to combine both qualitative and quantitative approaches.
TYPES OF RESEARCH…
11.
Steps in ResearchProcess
1. Formulating the Research Problem
2. Extensive Literature Review
3. Developing the objectives
4. Preparing the Research Design including Sample Design
5. Collecting the Data
6. Analysis of Data
7. Generalisation and Interpretation
8. Preparation of the Report or Presentation of Results-Formal write
ups of conclusions reached.
12.
Levels and principlesof research planning
After identifying and defining the problem, researcher must arrange his ideas in order and write them in the form of an
experimental plan or what can be described as ‘Research Plan’.
This is essential specially for new researcher because:
a. It helps to organize ideas in a form whereby it will be possible to look for flaws and inadequacies, if any
b. It provides an inventory of what must be done and which materials have to be collected as a preliminary step
c. It is a document that can be given to others for comment.
Research plan must contain the following items.
1. Research objective should be clearly stated, what it is that the researcher expects to do
2. The problem to be studied by researcher should be put clearly
3. Each major concept which to be measured should be defined in operational terms in context of the research project
4. The method to be used in solving the problem
5. It must also state the details of the techniques to be adopted
13.
Research problem
Itis the first and most crucial step in the research process
- Main function is to decide what you want to find out about.
• The way you formulate a problem determines almost every step that follows.
Steps in formulation of a research problem
Step 1 Identify a broad field or subject area of interest to you.
Step 2 Dissect the broad area into sub areas.
Step 3 Select what is of most interest to you.
Step 4 Raise research questions.
Step 5 Formulate objectives.
Step 6 Assess your objectives.
Step 7 Double check.
14.
Research question/hypothesis
Detailthe problem statement
Further describe and refine the issue under study
Add focus to the problem statement
Guide data collection and analysis
Sets context
15.
Selection of appropriatemethodology
Research methodology is a systematic way to solve a problem. It is a science of studying how
research is to be carried out. Essentially, the procedures by which researchers go about their
work of describing, explaining and predicting phenomena are called research methodology. It is
also defined as the study of methods by which knowledge is gained. Its aim is to give the work
plan of research.
Research methodology tells you which has to be used out of the various existing methods. More
precisely, research methods help us get a solution to a problem. On the other hand, research
methodology is concerned with the explanation of the following:
(1) Why is a particular research study undertaken?
(2) How did one formulate a research problem?
(3) What types of data were collected?
(4) What particular method has been used?
(5) Why was a particular technique of analysis of data used?
16.
RESEARCH APPROACHES (QuantitativeAnd Qualitative) Method
1. Quantitative Approach
Involves the generation of data in quantitative form which can be subjected to rigorous quantitative
analysis in a formal fashion. This approach can be further sub-classified into Inferential,
Experimental and Simulation Approaches to research.
The purpose of inferential approach to research is to form a data base from which to infer
characteristics or relationships of population. This usually means survey research where a sample of
population is studied (questioned or observed) to determine its characteristics, and it is then inferred
that the population has the same characteristics.
Experimental approach is characterized by much greater control over the research environment
and in this case some variables are manipulated to observe their effect on other variables.
17.
Simulation approachinvolves the construction of an artificial environment within
which relevant information and data can be generated. This permits an observation of
the dynamic behaviour of a system (or its sub-system) under controlled conditions.
Qualitative approach to research is concerned with subjective assessment of attitudes,
opinions, behaviour, etc. Research in such a situation is a function of researcher’s
insights and impressions. Such an approach to research generates results either in non-
quantitative form or in the form which can not be subjected to rigorous quantitative
analysis. Generally, the techniques of focus group interviews, projective techniques and
depth interviews are used.
18.
Research strategy: experimentaland survey research Design
Experimental Research Design
Experiment :
An experiment is a test or a series of tests
is a planned inquiry to investigate new facts or to confirm or deny the results of the previous
experiments
Experimentation is used to obtain
New information or to improve the results of previous findings
It helps to answer questions
An experimental design:
is a planned interference in the natural order of events by the researcher.
19.
Importance of Experimentaldesign
To provide estimates of a treatment effects or differences among treatment effects.
To provide an efficient way of confirming or denying hypothesis about the response to
treatments.
To control experimental errors and increase precision by reducing external variation in
experimental error.
To facilitate the application of treatments, management operations and harvest of the plots.
20.
Types of ExperimentalDesigns
1)Complete block design
– When a block contains all the treatment
– Number of replication equal to blocks
e.g. Completely randomized design, Completely Randomized block design, Spilt
plot
2)Incomplete block design
When the block does not contain all treatment
Number of blocks is not the same as that of replication
e.g:Lattice square and latin rectangle, Augmented designs, replication may
contain two or more blocks.
21.
Survey research Design
Theterm survey is used for the techniques of investigation by a direct observation of a
phenomenon
or a systematic gathering of data from population by applying personal contact and interviews
when adequate information about certain problem is not available in records, files and other
sources.
The survey is an important tool to gather evidences relating to certain social problems.
The term social survey indicates the study of social phenomena through a survey of a small
sampled population and also to broad segments of population.
It is concerned with the present and attempts to determine the status of the phenomenon under
investigation.
22.
The methodof survey research is a non-experimental (that is, it does not involves any
observation under controlled conditions), descriptive research method which is one of the
quantitative method used for studying of large sample.
In a survey research, the researcher collects data with the help of standardised questionnaires
or interviews which is administered on a sample of respondents from a population
(population is sometimes referred to as the universe of a study which can be defined as a
collection of people or object which possesses at least one common characteristic).
The method of survey research is one of the techniques of applied social research which can
be helpful in collection of data both through direct (such as a direct face to face interview)
and indirect observation (such as opinions on library services of an institute).
23.
STEPS INVOLVED INCONDUCTING SURVEY RESEARCH
Any type of survey research follows the following systematic steps
Step 1: Determination of the aims and objectives of study
Step 2: Define the population to be studied
Step 3: Design and construct a survey
Step 3: Select a representative sample
Step 4: Administer the survey
Step 5: Analyse and interpret the findings of the survey
Step 6: Prepare the report of the survey
Step 7: Communicate the findings of the survey
24.
TYPES OF SURVEYRESEARCH
Basically there are two major types of survey: cross sectional surveys and longitudinal surveys
Cross sectional surveys: are used by the researcher when he or she wants to collect data from varied or
different types of groups ( that may be in terms of age, sex, group, nation, tribes and so on) at a single
time.
An example of a survey can be a study on the effect of socialization of children of different age
groups of a particular country. This type of survey is less time consuming and economical as well.
Longitudinal survey: is used only when the subject wants to study the same sample for a longer period
of time.
Such longitudinal studies may be used to study behavioural changes, attitude changes, religious effects
or any event or practice that may have a long time effect on the selected sample or population.
There are three main types of longitudinal studies which help the researcher to analyse the long term
effects on the selected sample. These include
(i) Trend studies
(ii) Cohort studies and
(iii) Panel studies.
2.1 Introduction
Inagricultural research, the key question to be answered is generally expressed as a statement
of hypothesis. This hypothesis has to be verified or disproved through experimentation.
Once a hypothesis is framed, the next step is to design a procedure for its verification.
This is the Experimental Procedure or Research Methodology, which usually consists of four
phases:
Selecting the appropriate materials to test the hypothesis
Specifying the characters to measure
Selecting the procedure/design to measure those characters
Specifying the procedure/method of analyzing the characters to determine whether the
measurements made support the hypothesis or not.
In general, the first two phases are fairly easy for a subject matter specialist to specify.
On the other hand, the procedures/design regarding how measurements are to be made and how
prove or disprove a hypothesis depend heavily on techniques developed by statisticians
27.
The proceduresand how measurements can prove/disprove the hypothesis
requires generally the idea of experimentation.
This is what we call design of the experiments.
The design of experiments has 3 essential components
Estimate of error
Control of error
Proper interpretation of results obtained either verified/disproved
28.
1. Estimate ofError
We need to compare the two cattle breeds in terms
of their milk yield.
Breed A and B have received the same management
and are housed side by side.
Milk yield is measured and higher yield is judged
better.
The difference in milk yield of the two breeds could
be caused due to breed differences.
But this certainly is not true.
Even if the same breed might have been housed on
both houses, the milk yield could differ.
Other factors such as, climatic factors (temperature),
damage by disease and insects affect milk yield.
Exotic breed (A)
Local breed /indigenous (B)
29.
Therefore, asatisfactory evaluation of the two cattle breeds must involve a procedure that
can separate breed difference from other sources of variation.
Therefore, the animal breeder must be able to design an experiment that allows them to
decide whether the milk yield difference observed is caused by breed difference or by
other factors.
In this case, we are able to estimate the exact experimental error in livestock research.
The difference among experimental plots/materials treated alike (similarly) is called
Experimental Error.
This error is the primary basis for deciding whether an observed difference is real or just
due to chance.
Clearly, every experiment must be designed to have a measure of the experimental error.
It is unavoidable but try to be reduced as minimum as possible in the experiment.
30.
Methods To ReduceExperimental Error
Increase the size of experiment either through provision of more replicates or by
inclusion of additional treatments.
Refine or improving the experimental techniques/procedures
Have uniformity in the application of treatments such as equally spreading of
fertilizers, recording data on the same day, similar housing, similar feeding, etc.
Control should be done over external influences so that all treatments produce their
effects under comparable conditions e.g. protecting disease, etc.
31.
1.1. Replication
Itis the repetition of treatments in an experiment. At least two plots/experimental
materials of the same breed/variety are needed to determine the difference among
plots/experimental materials treated alike.
Experimental error can be measured if there are at least two plots treated the same or
receiving the same treatment.
Thus, to obtain a measure of experimental error, replication is needed.
The advantage of replication in an experiment is to increase precision of error
estimation and error variance is reduced and easily estimated.
32.
Functions of Replication
Provides an ease of estimate of exp,tal error
Because it provides several observations on experimental units receiving the same
treatment. For an experiment on which each treatment appears only once, no
estimate of experimental error is possible.
Improves the precision or accuracy of an experiment
As the number of replicates increases, the estimates of population means as
observed treatment means becomes more precise.
Increases the scope of inference/conclusion of the experiments
33.
1.2. Randomization
Randomizationensures that no treatment is consistently favored or discriminated being
placed under best or unfavorable conditions, thereby avoiding biasness.
It means that each variety/breeds of animal will have equal chance of being assigned to
any experimental plots.
It also ensures independence among observations, which is a necessary condition for
validity of assumptions to provide significance tests and confidence intervals.
Randomization can be done by using random number, lottery system, or coin system.
Thus, experimental error of the difference will be reduced if assigned randomly and
independently.
34.
2. Control ofError
The ability of the experiment to detect the existing difference among
treatments/experimental materials is increased as the size of the experimental error
decreased.
A good experiment should incorporate all possible means of minimizing the
experimental error.
Three commonly used techniques for controlling experimental error in agricultural
research are as follows:
Blocking
Proper plot technique
Proper data analysis
35.
1. Blocking
Puttingexperimental units that are as similar as possible together in the same group is generally referred as a
block.
By assigning all treatments/experimental plots in to each block separately and independently, variation among
blocks can be measured and removed from experimental error.
Reduction in experimental error is usually achieved with the use of proper blocking techniques in different
experimental designs.
2. Proper plot technique
For all experiments it is absolutely essential that except treatments, all other factors must be maintained
uniformly for all experimental units.
For example, for a forage variety trial where the treatments consists solely of the test varieties, it is required
that all other factors such as soil nutrients, solar energy, temperature, plant population, pest incidence and other
infinite environmental factors should be maintained as uniformly for all plots in the experiments as possible.
This is primarily a concern of a good plot technique.
3. Proper data analysis
In cases, where blocking alone may not able to achieve adequate control of experimental error, proper data
analysis can help greatly. In this case, covariance analysis is most commonly used for this purpose.
36.
3. Proper Interpretationof Results of an Experiment
After estimating and controlling experimental error, the result
of experiment must be interpreted properly according to the
situation of the environment and conditions of the experiment
for practical application.
For example, the DMY of the forage variety must be reported based
on the environmental conditions where the study is conducted
including climatic data (temperatures, rainfall, others), soil fertility
and type, topography, and others as much as possible.
37.
Analysis of Variance(ANOVA)
Anova is a procedure that can be used to analyze the results from both simple and
complex experiments
Reveals whether the obtained difference between any treatments is real or occur by
chance.
It partition the total variation in to different components and test their significance
38.
Overview of someexperimental designs
The most common types of designs used in agricultural research:
Completely randomized design(CRD)
Completely randomized block design(RCBD)
Latin square design(LSD)
lattice design
Augmented designs
Split plot design.
39.
Completely Randomized Design(CRD)
The simplest and least restrictive design.
The only restrictions:
Experimental units are homogeneous.
Treatments are assigned completely at random
Advantages:
– Flexibility
– Statistical analysis simple
– provides maximum degrees of freedom for error
Disadvantages:
– Low precision
40.
When to UseCRD?
when the experimental area -units/plots are more or less
homogeneous and where environmental effects are relatively easy
to control, e.g., laboratory and greenhouse.
CRD is flexible and the statistical analysis is also simple even
when there are unequal replications or missing value: Df=t(r-1)
41.
Randomized Completely BlockDesign (RCBD)
It is the most frequently used experimental design in field
experiments.
It has three sources of variation such as treatment, blocks and
experimental error. This has one additional source of variation than
CRD.
It can be used when the experimental units that can be
meaningfully grouped
42.
Characteristics of RCBdesign
The number of blocks are equal to the number of replications
The number of plots in each replication (block) is equal to the number of treatment.
The treatments are randomized in each replication subjected to the restriction that each
treatment occur once and only once.
Blocking (grouping) is done based on the gradient: Soil heterogeneity, slope, initial body
weight, age, sex, and breed of animal, Slope
Blocking minimizes the variability with in each block while the variability among blocks
is maximized.
43.
Block shape,size and orientation determination
– When the gradient is unidirectional, use narrow blocks perpendicular to the direction of the
gradient.
– When the gradient occur in two directions ignore the weaker gradient.
– Arrange your blocks perpendicular to the stronger gradient but reduce the length of blocks.
– Blocking reduces experimental error by eliminating the contribution of known sources of
variation among experimental units.
44.
Advantages of RCBdesign
Precision: More precision is obtained than with CRD because grouping experimental
units into blocks reduces the magnitude of experimental error.
Flexibility: Theoretically there is no restriction on the number of treatments or blocks.
Ease of Analysis: The statistical analysis of the data is simple
Disadvantage
When the number of treatments is large (>15), variation among experimental units
within a block becomes large, resulting in a large error. In such situations better to use
other designs.
45.
Factorial experiment
The designsare applicable to any type of experiments, regardless of the
structure of treatments.
Two types፡ single & multi-factor experiment:
Single factor experiment: An experiment that is concerned with testing
several levels of one factor, keeping all other factors constant
Multi - factor experiments: two or more factors where effects and cross-
effects are tested simultaneously.
46.
Characteristics of factorialexperiments
Factorial experiments are those trials that can accommodate more than one factor, each of
which having two or more levels.
All possible combinations of factors and levels vary simultaneously.
They do not have their own designs.
Combination of treatments make possible to find differential effect of one factor at two or
more levels of the second factor.
Factorials will have an error term if the designs are CRBD, CRD or Latin square.
However, if the design is split plot, two error systems will be used.
An interaction effect between two factors can be measured only if the two factors are
tested together in the same experiment.
If the interaction effect is significant, more attention should be given on the results of
interaction than main effects
Estimation of missing plot values is more complex in factorial experiments.
47.
Disadvantages
As the numberof factors increase the size of experiment becomes
very large and complex. e. g: with 8 factors each at 2-levels, there
are 28, 256 treatment combinations.
Large factorial experiments are difficult to interpret especially
when there are interactions.
Structure/format for proposalwriting
Definition of proposal
The research proposal is the document that finally establishes that there is a niche for your chosen
area of study and that the research design is feasible.
The research proposal:
- helps you to think out the research project you are about to undertake and predict any difficulties that might
arise.
For those who aren't quite sure what their focus will be, the research proposal can be a space to
explore options -- perhaps with one proposal for each potential topic (which can then be more easily
compared and evaluated than when they are still just ideas in one's head).
Research proposals can be effective starting places to discuss projects with your professors or
advisors, too.
51.
A professorwho is initially skeptical about a project may be able to imagine it more
easily after reading a well written research proposal (this doesn't mean he or she will
approve the topic, especially if there are significant potential difficulties that you haven't
considered).
Once you have begun your research project, a research proposal can help you to remain
on track -- and can also remind you why you started this project in the first place!
Researchers very often begin to lose heart about two thirds of the way into a project when
their research hits a snag or when they are having problems developing a thesis,
organizing the ideas, or actually starting to write.
Re-reading the initial research proposal, especially "Significance" can re-energize the
project or help the researcher to refocus in an effective manner.
52.
General Elements orstructures of research proposal:
Cover page (include topic or title, institution name, your name, advisor name, time of
submission)
Acknowledgements (optional)
Abbreviations and Acronyms
Table of contents
List of tables (If any)
List of figures (If any)
Introduction
Literature review
Materials and Methods
Plan of activities
Logistics
References
Appendix
53.
General form ofthe main research report
Put together structure of the paper:
Cover page (include topic or title, institution name, your name, advisor name, time of submission)
Acknowledgements (optional)
Abbreviations and Acronyms
Table of contents
List of tables (If any)
List of figures (If any)
Abstract
Introduction
Methods & Materials
Results and
Discussion
Summary & Conclusions and Recommendation
References
Divide long sections into subsections
54.
Reference and citations
Citation
Textualcitation
Use name and date for published works
Minale Simachew (1999) stated that or (Minale Simachew 1999)
For co-authored published works
Getachew Belay and Hailu Tefera (2006)….
For more than 2 authors
Aster Bedaso et al., (2001) reported
Handel second hand citations in one of these ways
Seid Ahemed (2005) cited in Hailu Tefera (2007) dicussed…… or Hailu Tefera
(2007) quoting Seid Ahemed (2005) discussed……..
55.
References
Commonauthor/date system
Arrange in alphabetical order of the surnames
Example:
Abebe W. 1991.Traditional husbandry practices and major health problems of camels in the
Ogaden, Ethiopia. Nomadic Peoples, 29:21-30.
Alemayehu G. 2001. Breeding program and evaluation of semen characteristics of Camels in the
Central Rift Valley of Ethiopia, an MSc Thesis Presented to the School of Graduate Studies of
Alemaya University.
CARE-Ethiopia 2009. Value Chain Analysis of Milk and Milk Products in Borena Pastoralist
Area. Addis Ababa: CARE Ethiopia.
If two or more entries have the same author (s) in the same publication year alphabetize the entries by title
and use lower case letters (a,b,c etc) to separate their identity.
Example:
Sampath S. (2001)a Sampling Theory and Methods, Narosa Publishing House, New Delhi.
Sampath S. (2001)b Statistical Theory and Methods, Narosa Publishing House, New Delhi.
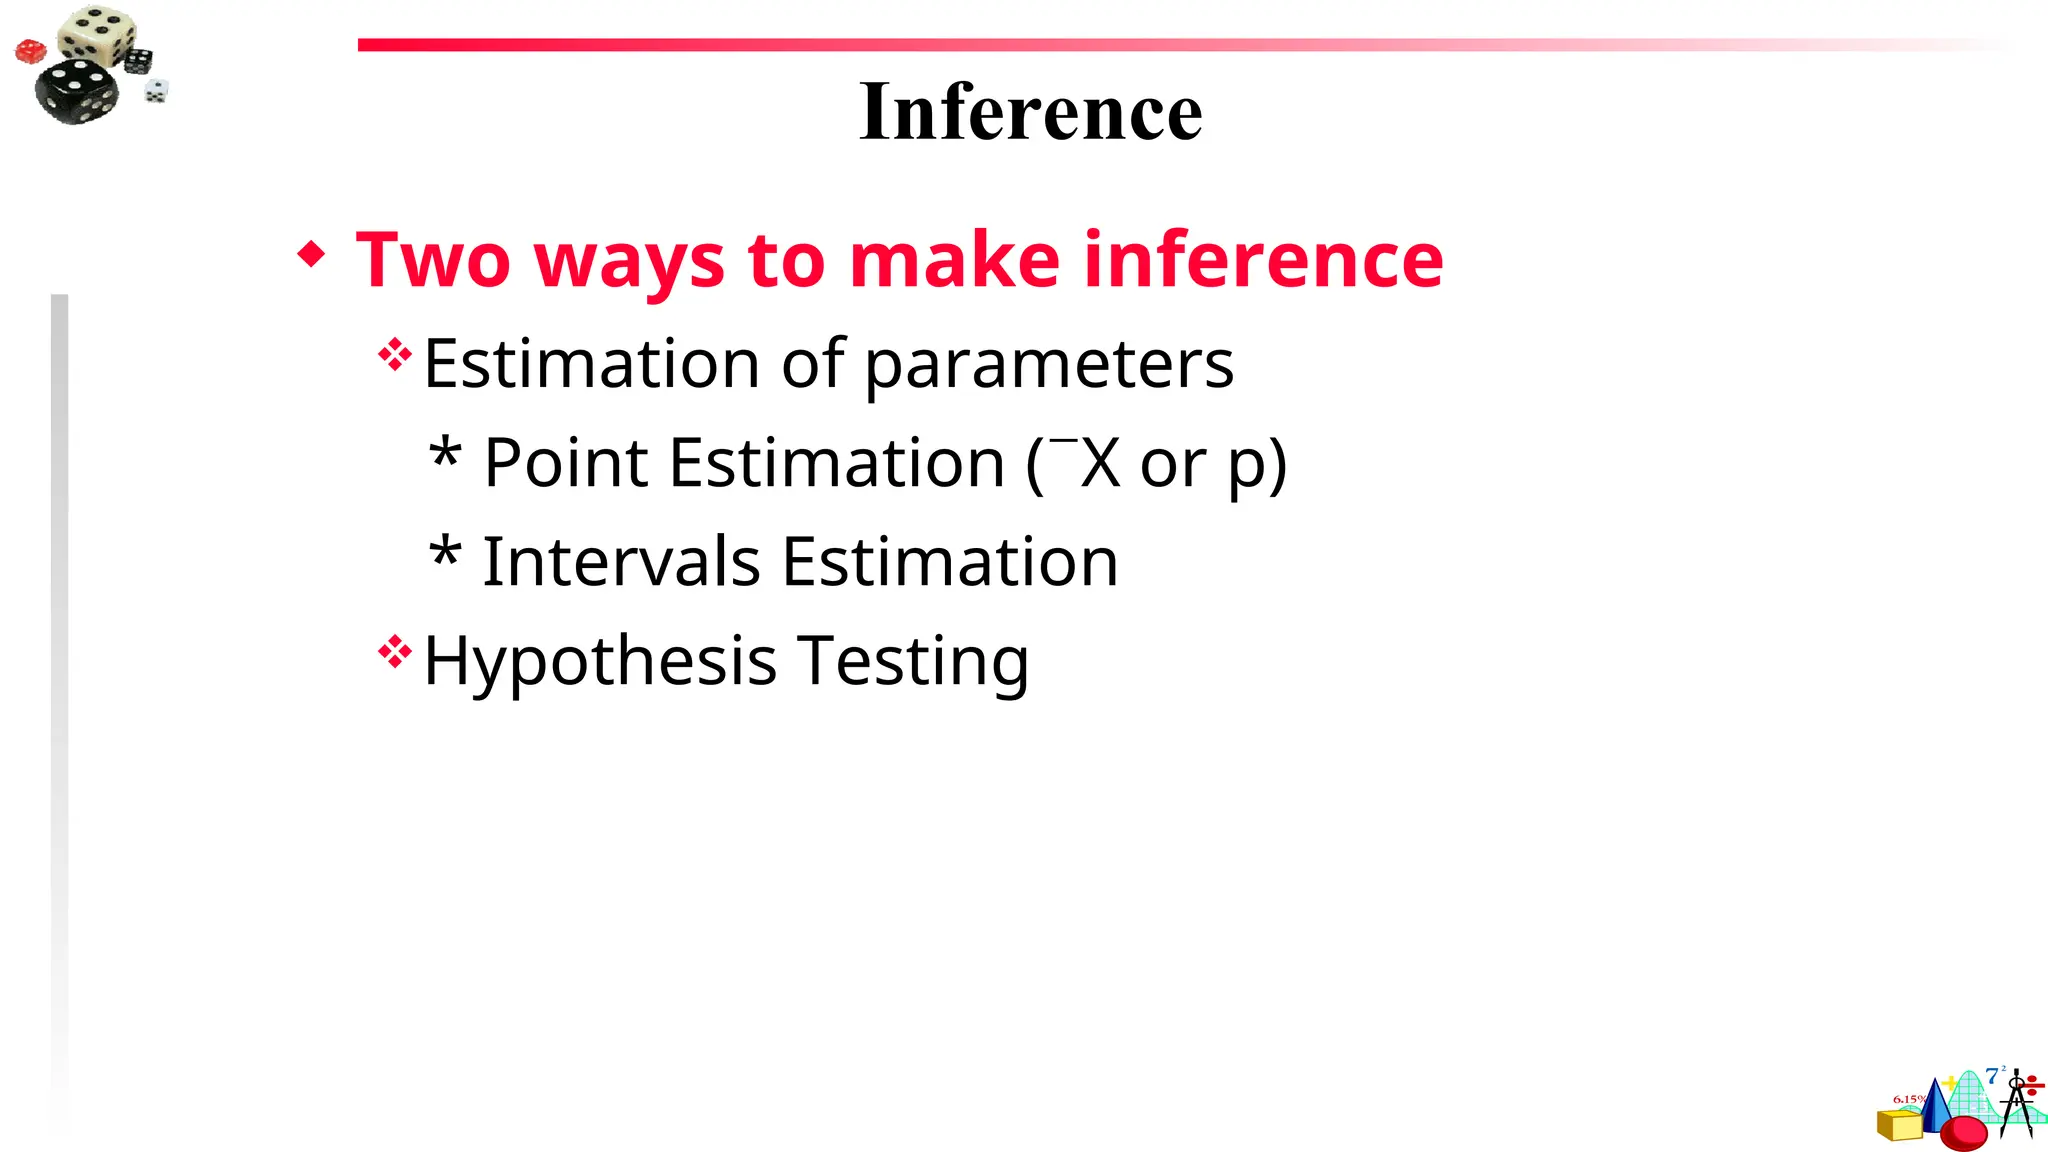
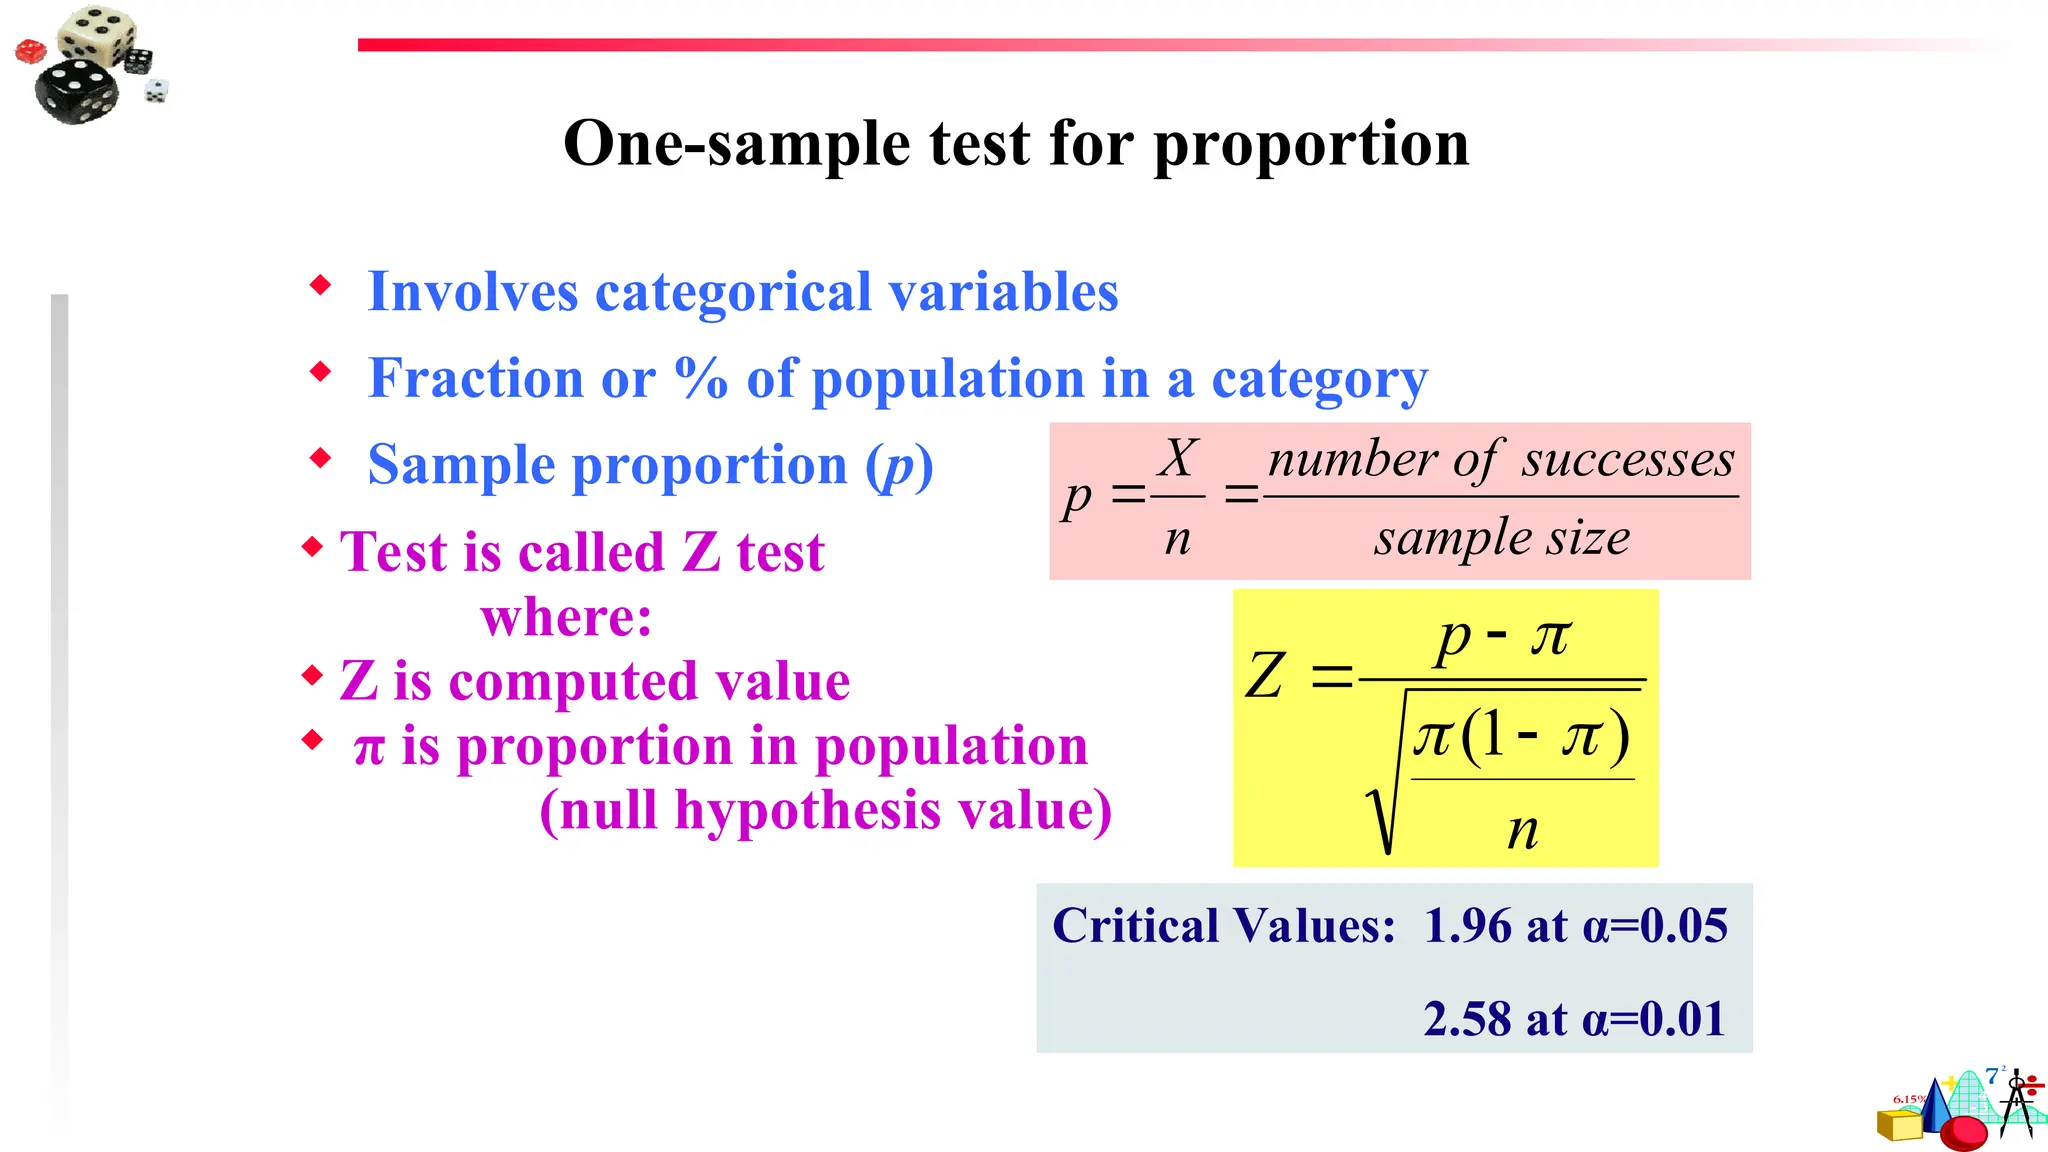
Statistics isa Science of Inference
• Statistical Inference:
– Predict and forecast values of population parameters
– Test hypotheses about values of population parameters
– Make decisions
On basis of sample statistics derived from limited and incomplete sample
information
– Make generalizations about the characteristics of a population
On the basis of observations of a sample, a part of a population
–Unbiased, representative sample drawn at random from the entire population.
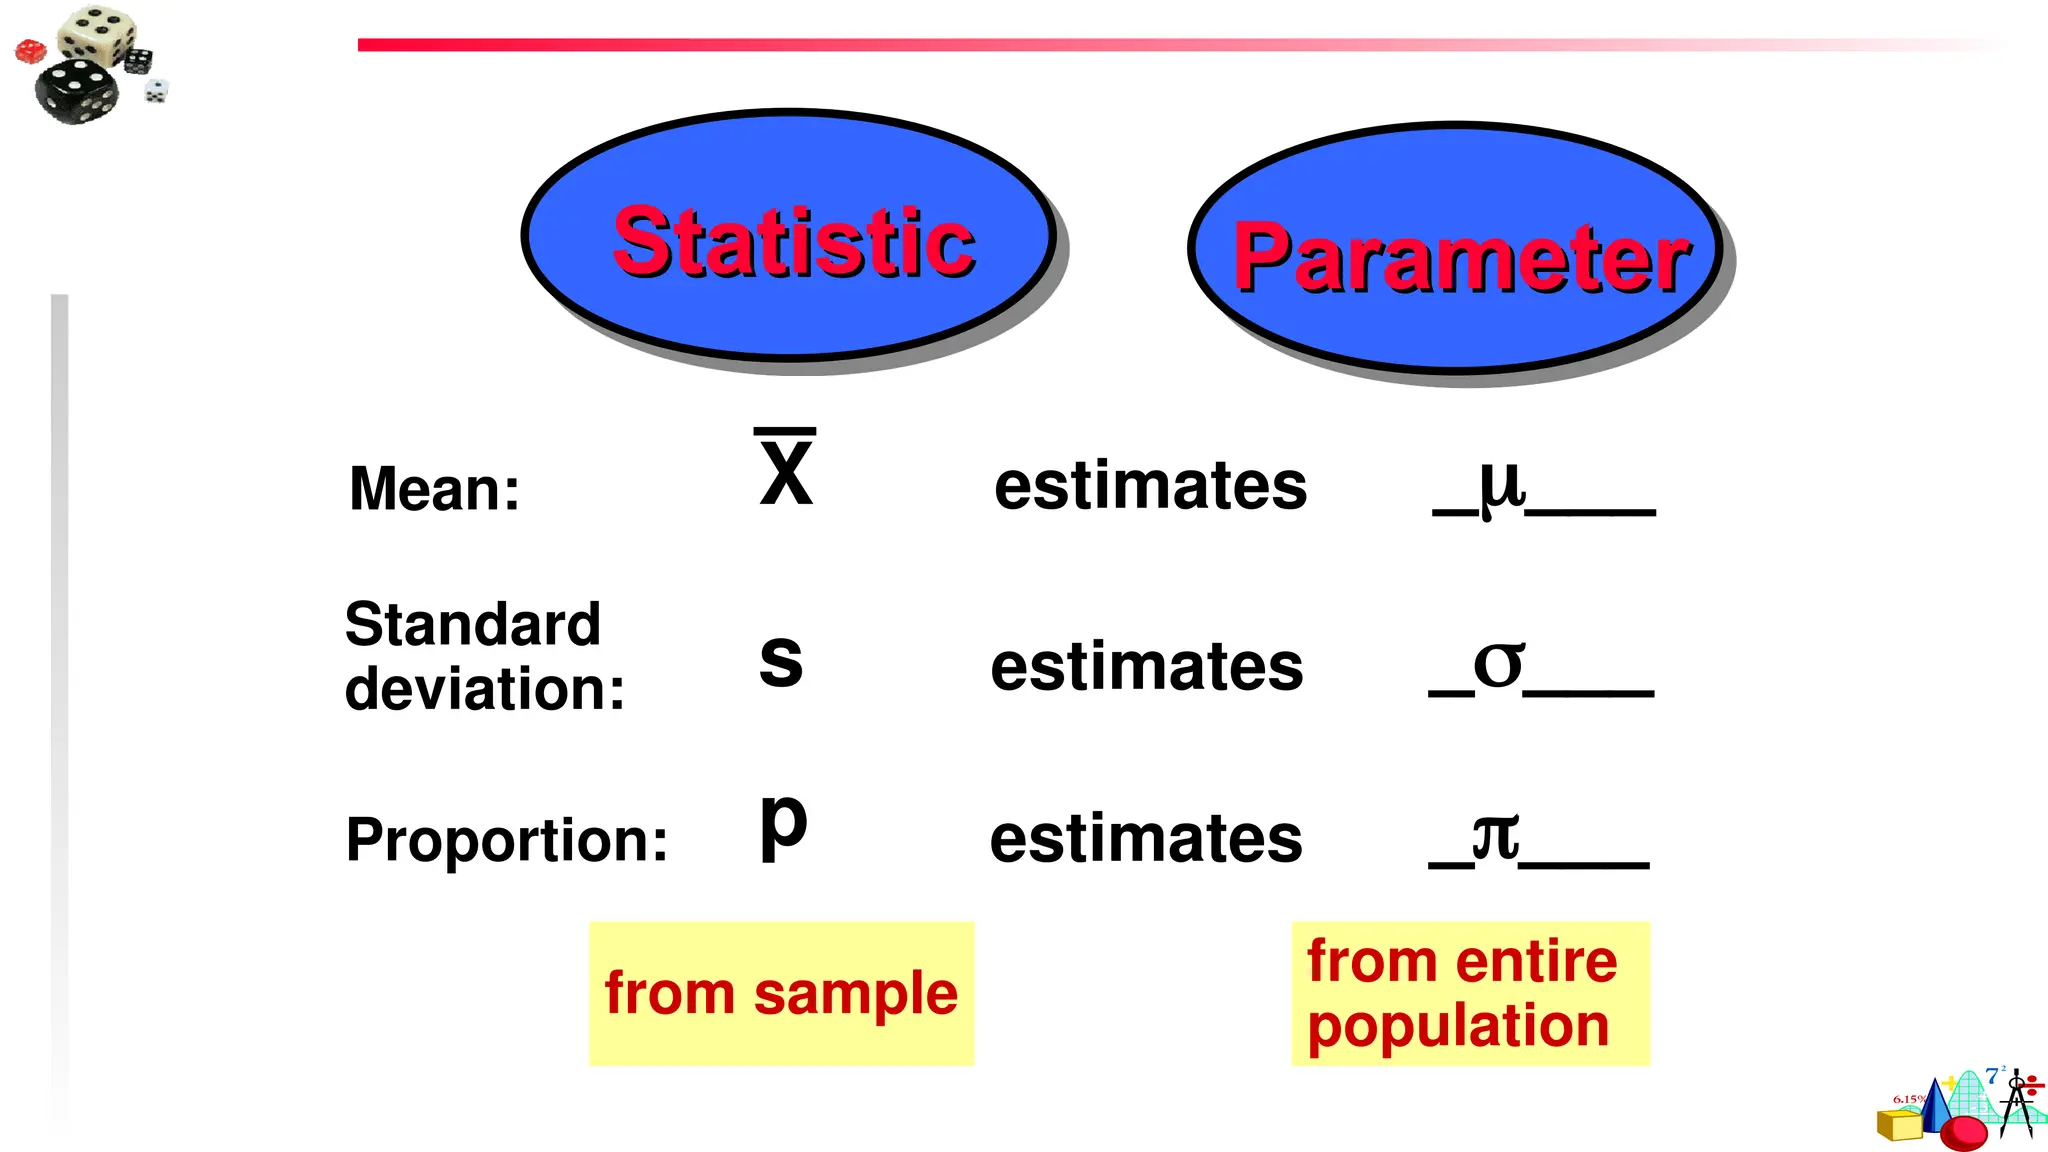
A sample statistic is a numerical measure of a summary characteristic of a sample.
A population parameter is a numerical measure of a summary characteristic of a
population.
58.
Estimator
•The sample mean,X , is the most common estimator of the population mean,
•The sample variance, s2
, is the most common estimator of the population variance, 2
.
•The sample standard deviation, s, is the most common estimator of the population standard
deviation, .
•The sample proportion, , is the most common estimator of the population proportion, p.
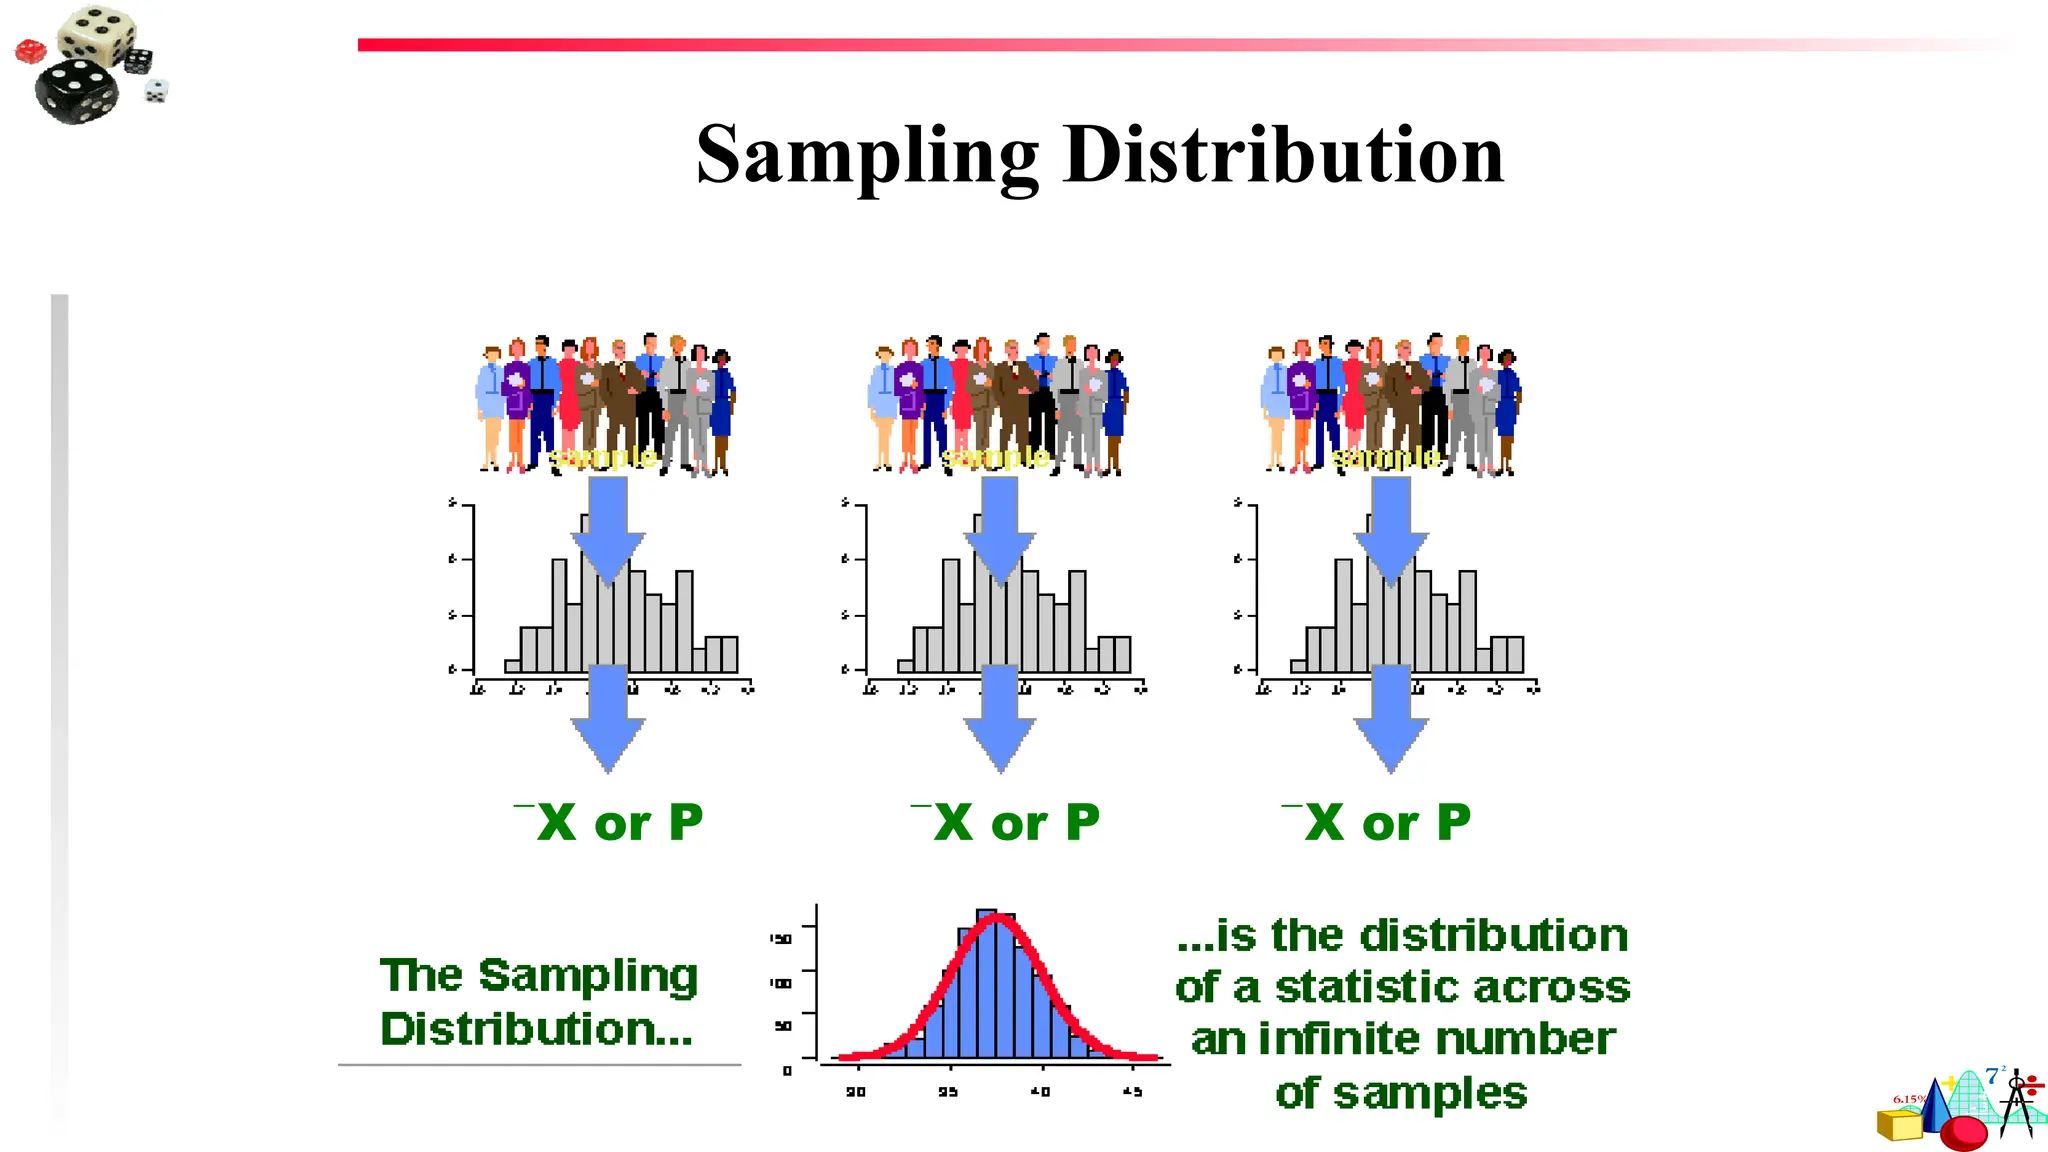
Inferential Statistics involves three distributions:
A population distribution – variation in the larger group that we want to know about.
A distribution of sample observations – variation in the sample that we can observe.
A sampling distribution – a normal distribution whose mean and standard deviation are
unbiased estimates of the parameters and allows one to infer the parameters from the
statistics.
p̂
59.
Sampling Distributions
The samplingdistribution of a statistic is the probability distribution of all possible
values the statistic may assume, when computed from random samples of the same
size, drawn from a specified population.
The sampling distribution of X is the probability distribution of all possible values the
random variable may assume when a sample of size n is taken from a specified
population.
When sampling from a normal population with mean and standard deviation , the
sample mean, X, has a normal sampling distribution:
X N
n
~ ( , )
2
60.
An estimator ofa population parameter is a sample statistic used to estimate the
parameter. The most commonly-used estimator of the:
Population Parameter Sample Statistic
Mean () is the Mean (X)
Variance (2
) is the Variance (s2
)
Standard Deviation () is the Standard Deviation (s)
Proportion (p) is the Proportion ( )
p
Desirable properties of estimators include:
Unbiasedness
Efficiency
Consistency
Sufficiency
Estimators and Their Properties
61.
Probability Distribution
Normal distribution
Naturallymost variables are assumed to be distributed normally, where the distribution
curve takes a bell-shape. E.g. height or body weight of people in Shambu
A normal distribution can be completely described by its mean and standard deviation.
N (µ, δ)
Binomial distribution
It is one of the most widely used discrete distributions.
A binomial distribution can be thought of as simply the probability of a SUCCESS or
FAILURE outcome in an experiment or survey that is repeated multiple times.
The binomial is a type of distribution that has two possible outcomes. For two possible
outcomes: pass or fail.
62.
For the binomialmodel to be applied the following four criteria must be satisfied
1. the trial is carried out a fixed number of times n.
2. the outcomes of each trial can be classified into two ‘types’ success or failure.
3. the probability p of success remains constant for each trial. (tails, heads, fail or pass) is exactly the same from
one trial to another.
4. the individual trials are independent of each other. In other words, none of your trials have an effect on the
probability of the next trial.
For example, if we consider throwing a coin 7 times what is the probability that exactly 4 heads occur?
This problem can be modelled by the binomial distribution since the four basic criteria are assumed satisfied as
we see.
here the trial is ‘throwing a coin’. This is carried out 7 times
the occurrence of a head on any given trial (i.e. throw) may be called a success
the probability of success is p = 1/2 and remains constant for each trial
each throw of the coin is independent from the others.
63.
Central Limit Theorem
Is a statistical concept regarding the relationship between sample size and the
distribution of sample statistic (sample mean);
It is a concept closely related to the law of large numbers (LoLN);
The CLT states that for a su ciently large sample size n, a normal distribution will
ffi
occur regardless of what the initial distribution looks like.
Law of Large Numbers As n grows, the probability that the mean of n
samples is close to µ goes to 1
Central Limit Theorem As n grows, the distribution of the mean of n
samples converges to the normal distribution
64.
This Theoremtell us:
Even if a population distribution is skewed, we know that the sampling distribution of
the mean is normally distributed
As the sample size gets larger, the mean of the sampling distribution becomes equal to
the population mean
As the sample size gets larger, the standard error of the mean decreases in size (which
means that the variability in the sample estimates from sample to sample decreases as N
increases).
It is important to remember that researchers do not typically conduct
repeated samples of the same population.
Instead, they use the knowledge of theoretical sampling distributions to
construct confidence intervals around estimates.
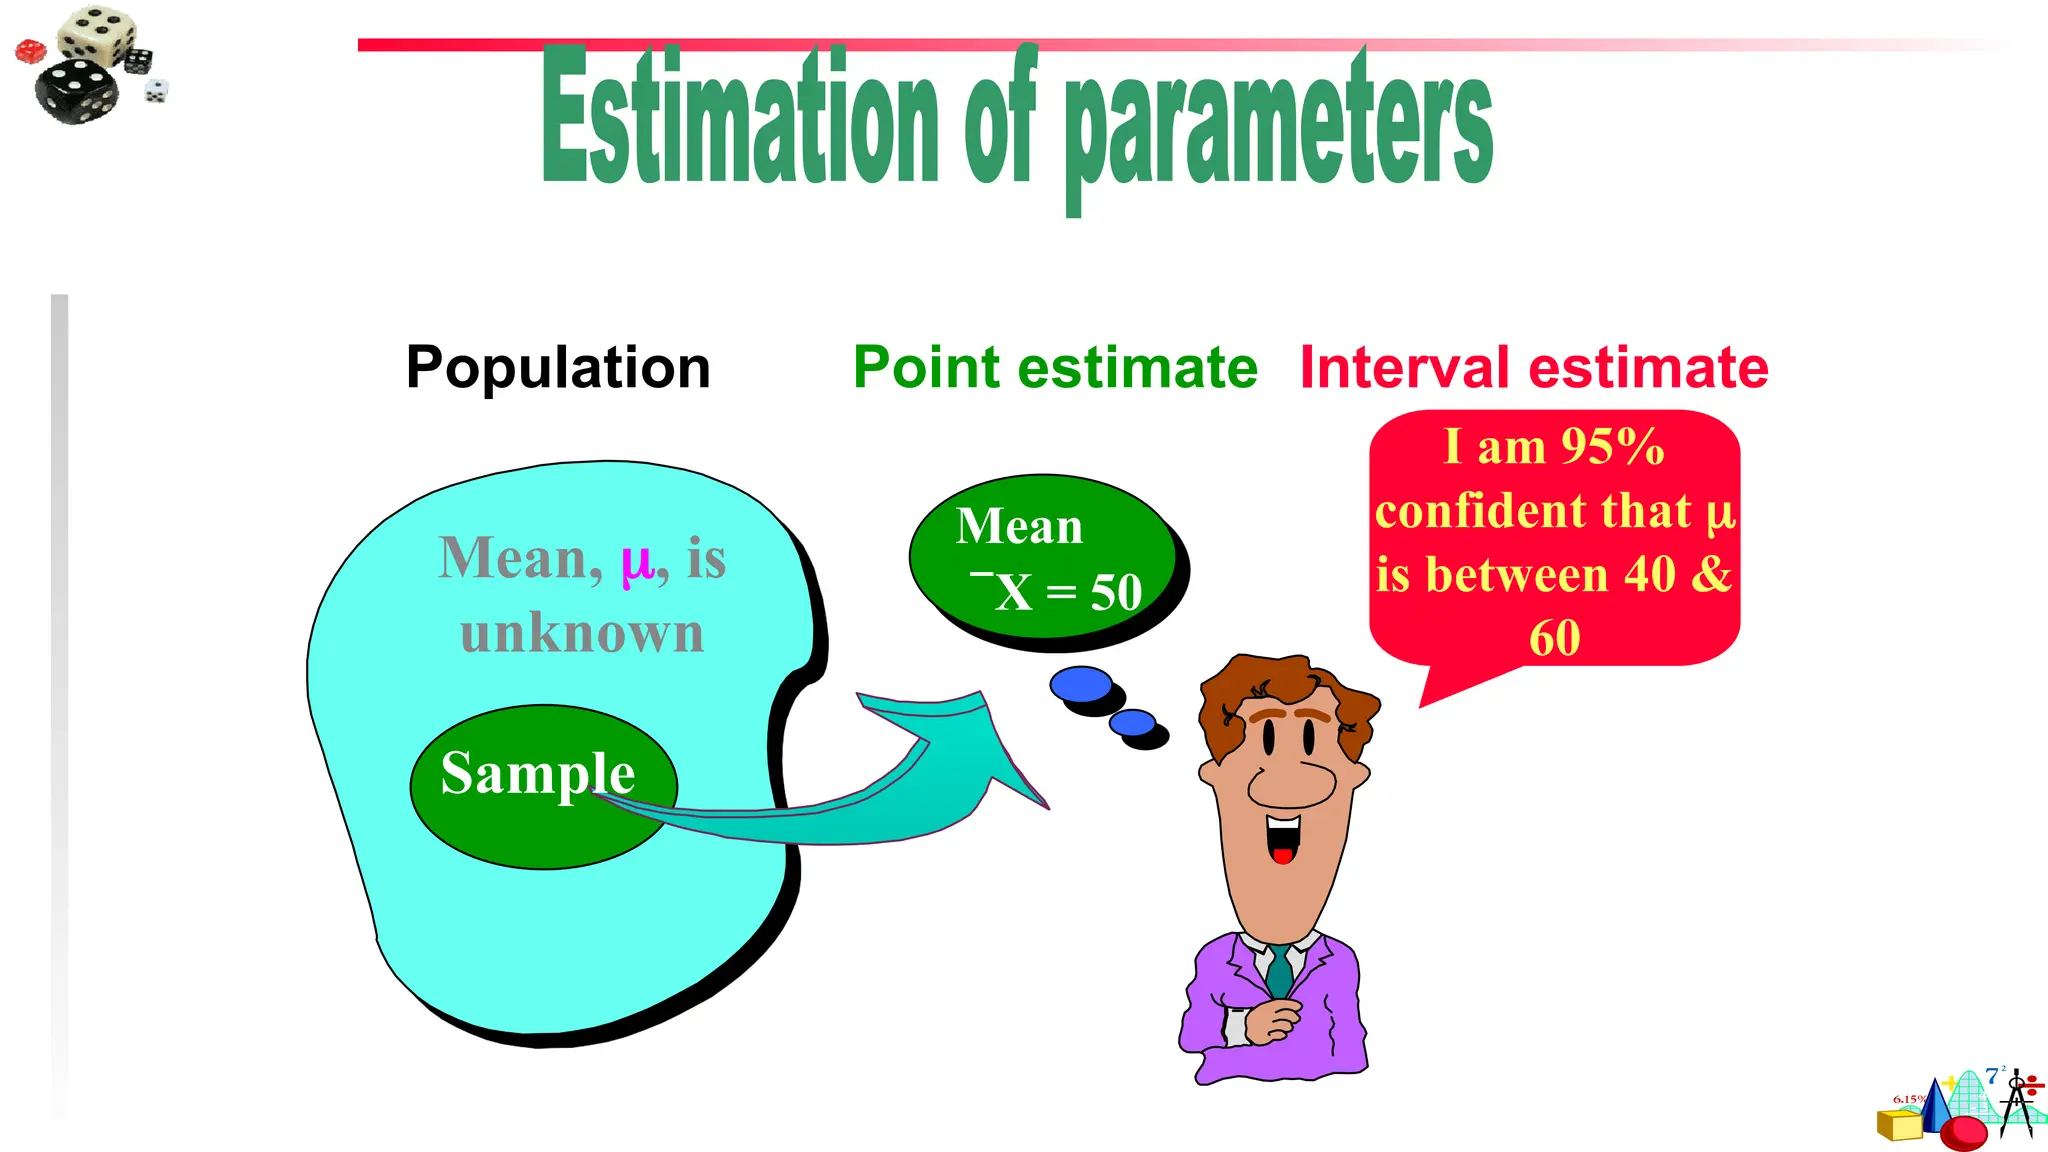
Estimation –A process whereby we select a random sample from a population and use a
sample statistic to estimate a population parameter.
Statistical inferences of estimation has two general areas:
Point Estimate
Interval Estimate
Point Estimate – A sample statistic used to estimate the exact value of a population parameter
– Most common Point Estimators
Sample mean estimates population mean
Sample std. dev. estimates population std. dev.
Sample proportion estimates population proportion
ˆ i
y
y
n
2
( )
ˆ
1
i
y y
s
n
ˆ
67.
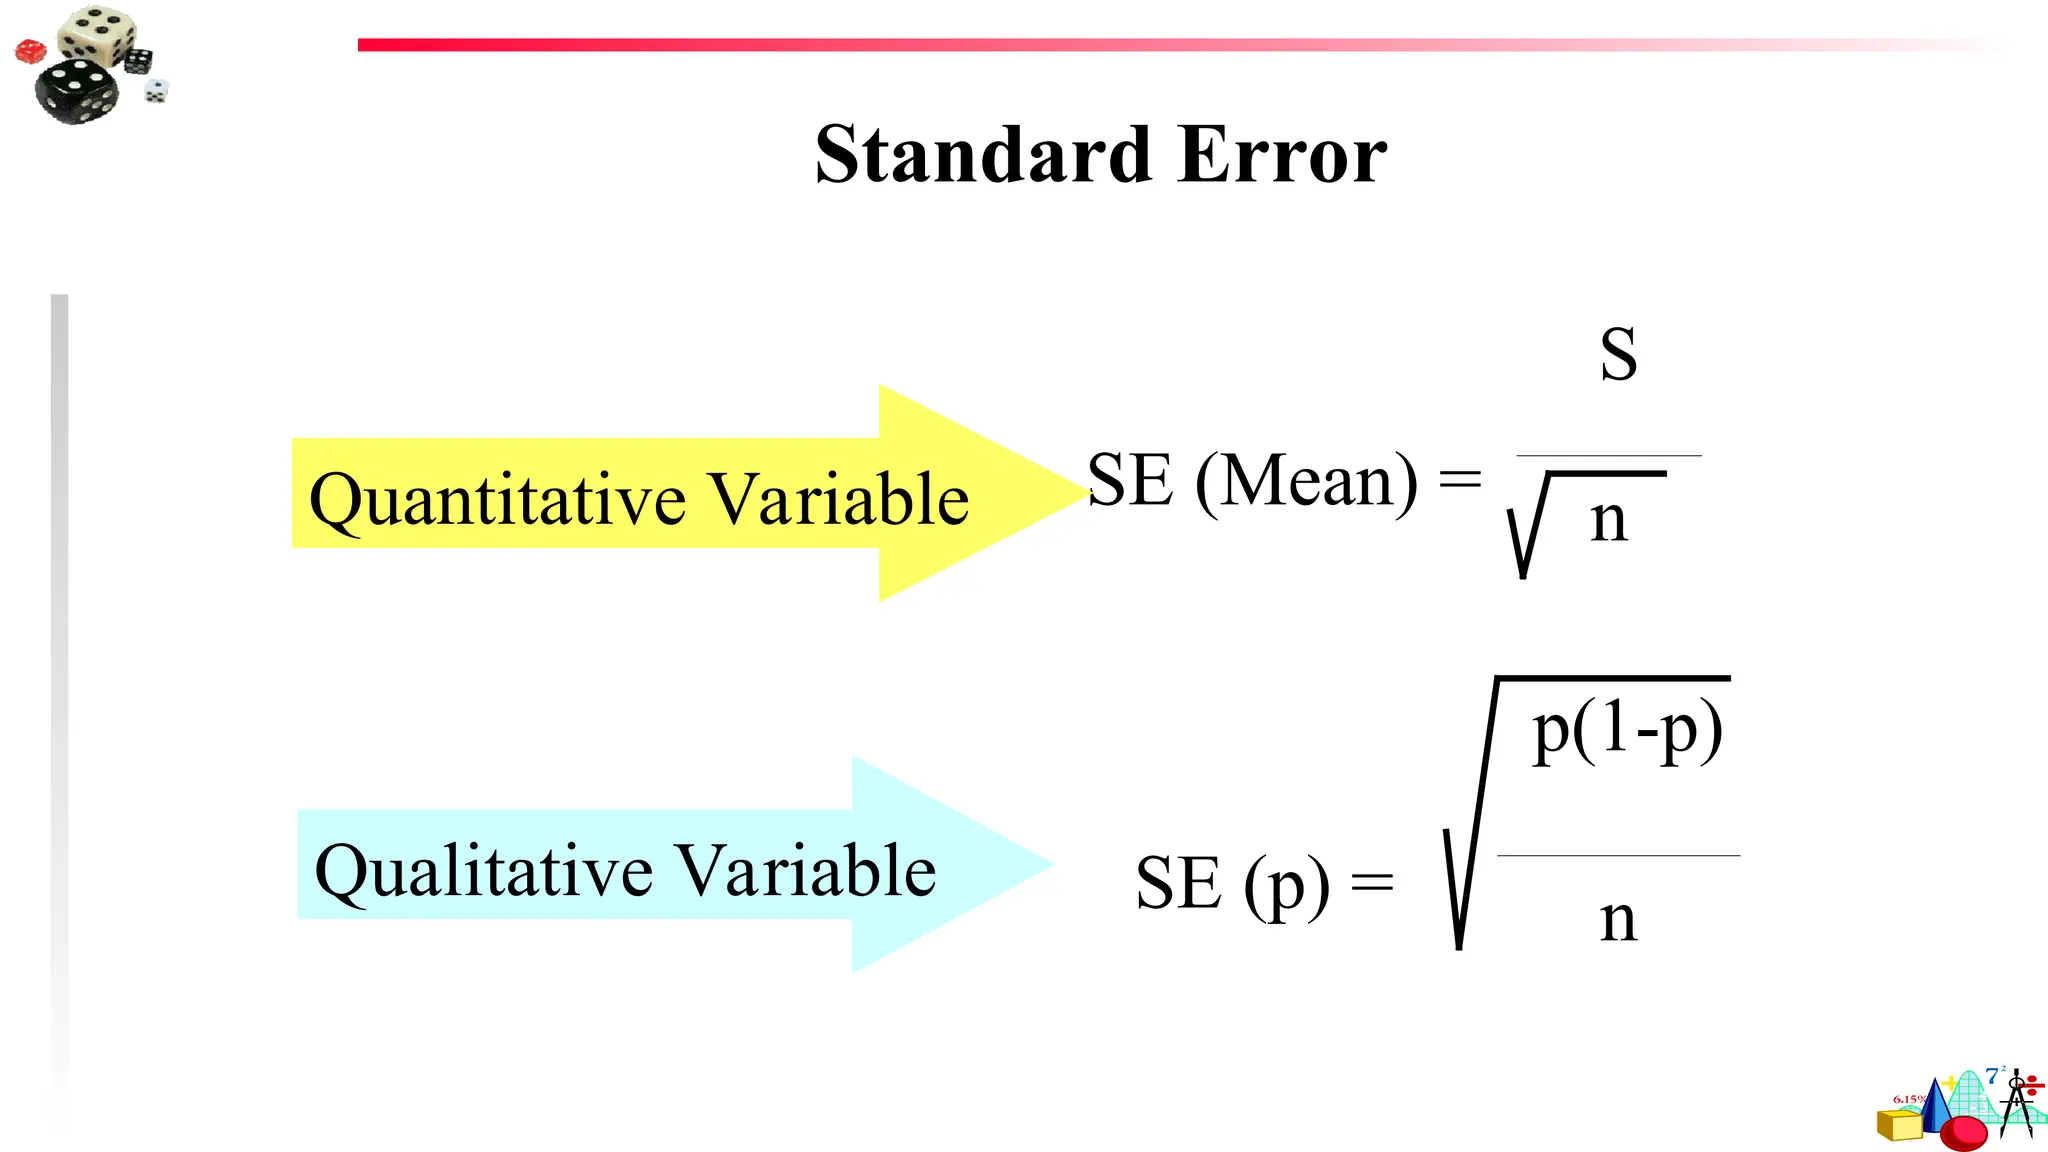
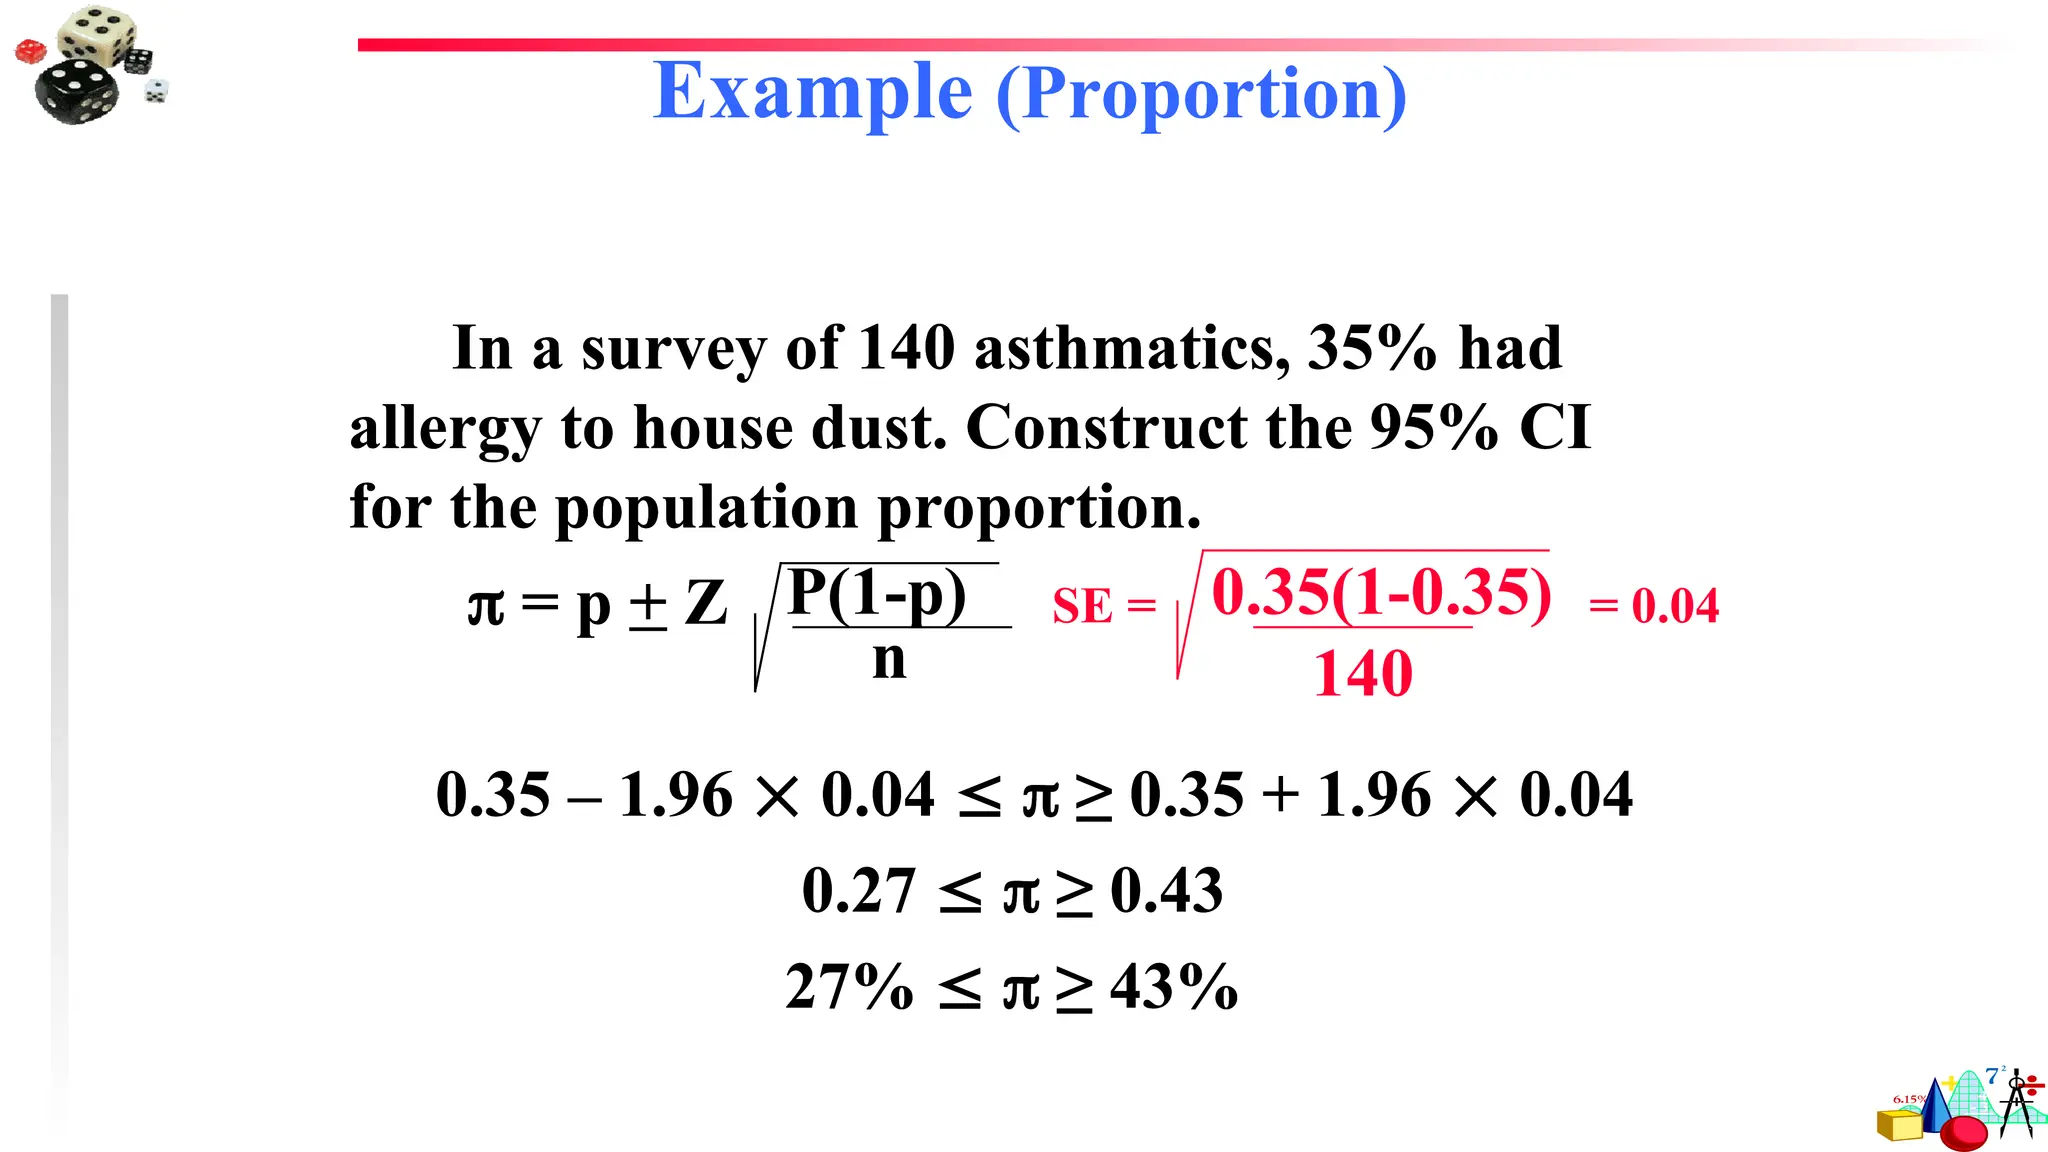
Interval estimate–an inferential statistical procedure used to estimate population
parameters from sample data through the building of confidence intervals
Confidence Intervals: a range of values computed from sample data that has a known
probability of capturing some population parameter of interest
A defined interval of values that includes the statistic of interest, by adding and subtracting
a specific amount from the computed statistic
Confidence Level – The likelihood, expressed as a percentage or a probability, that a
specified interval will contain the population parameter.
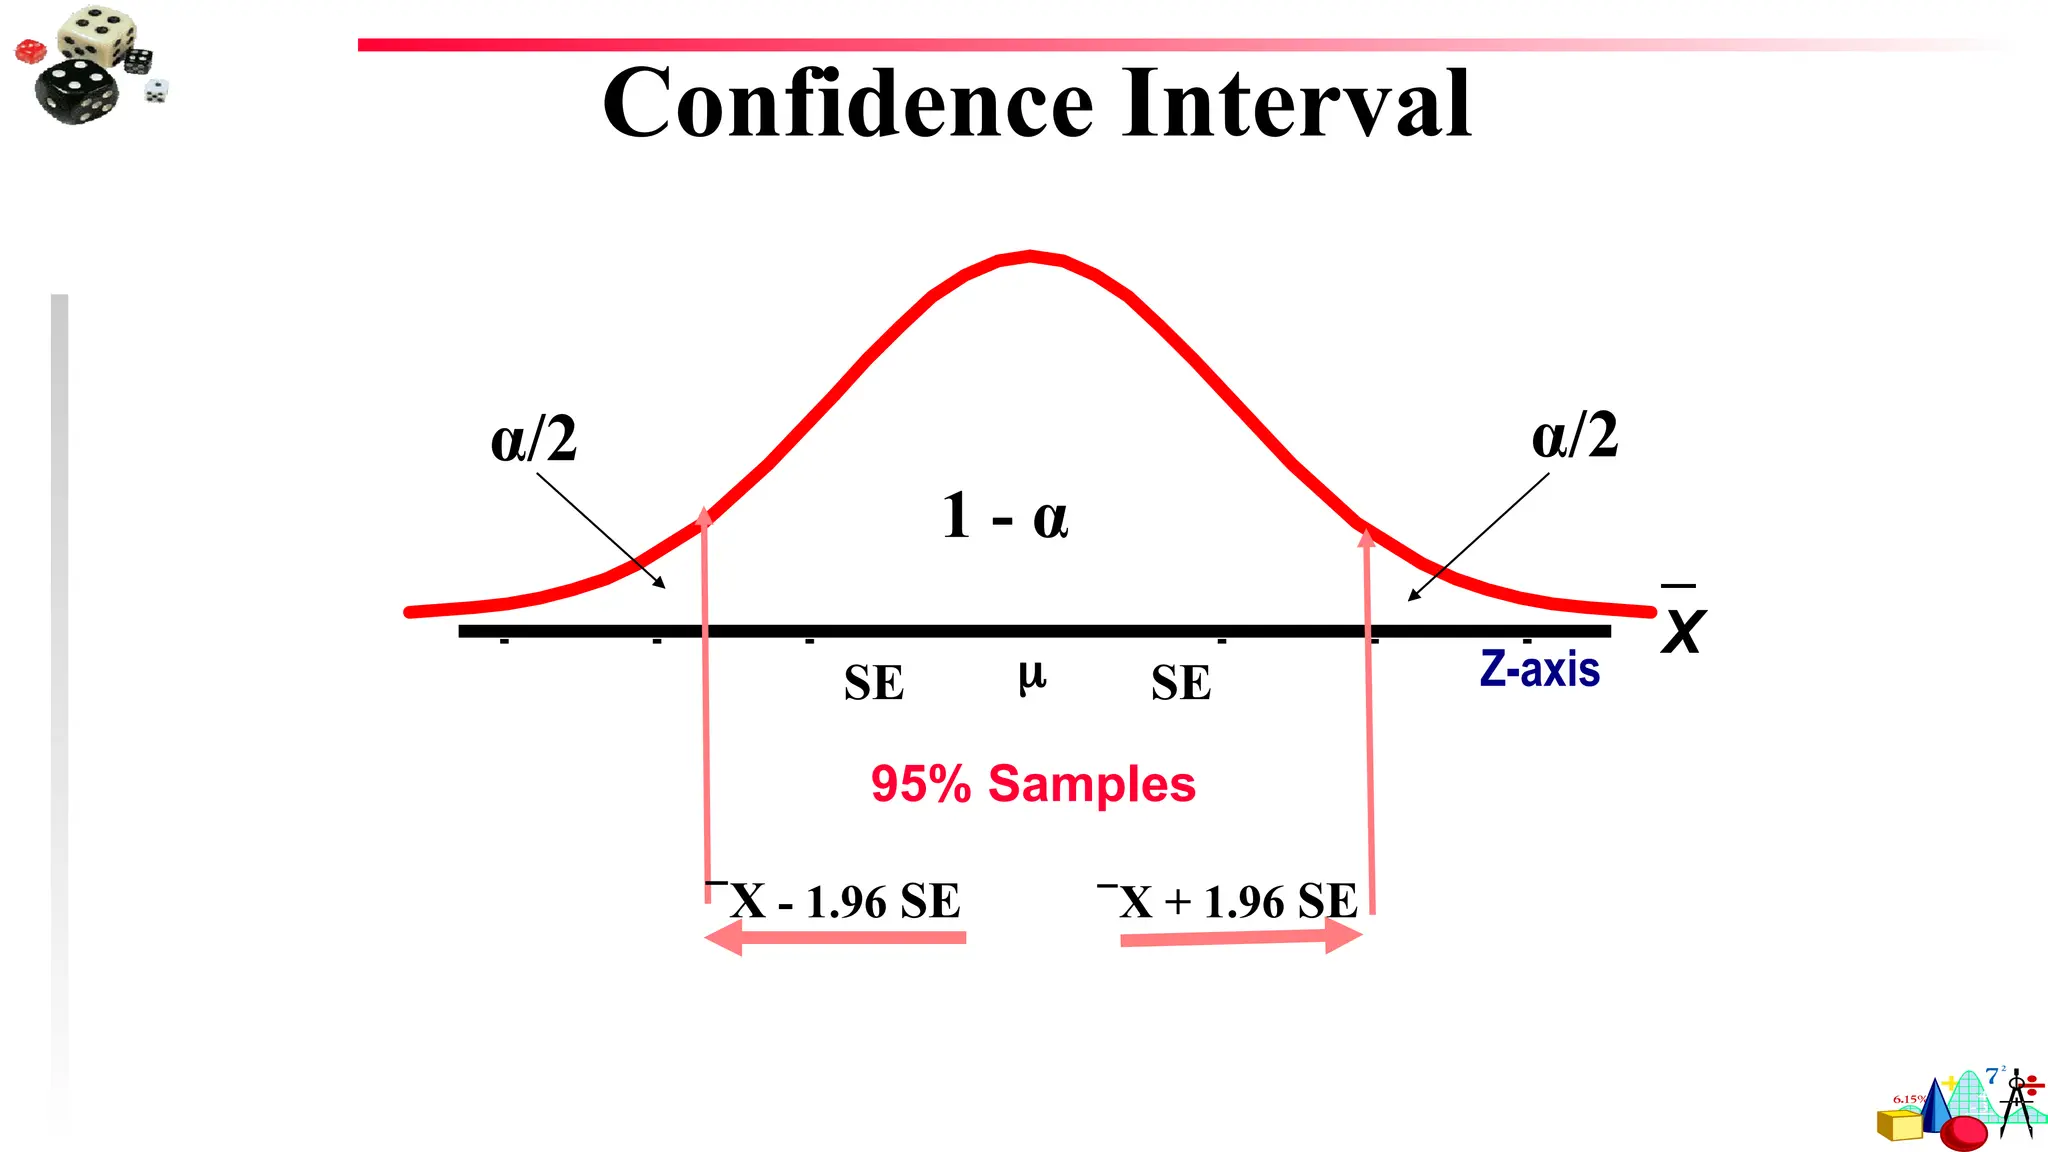
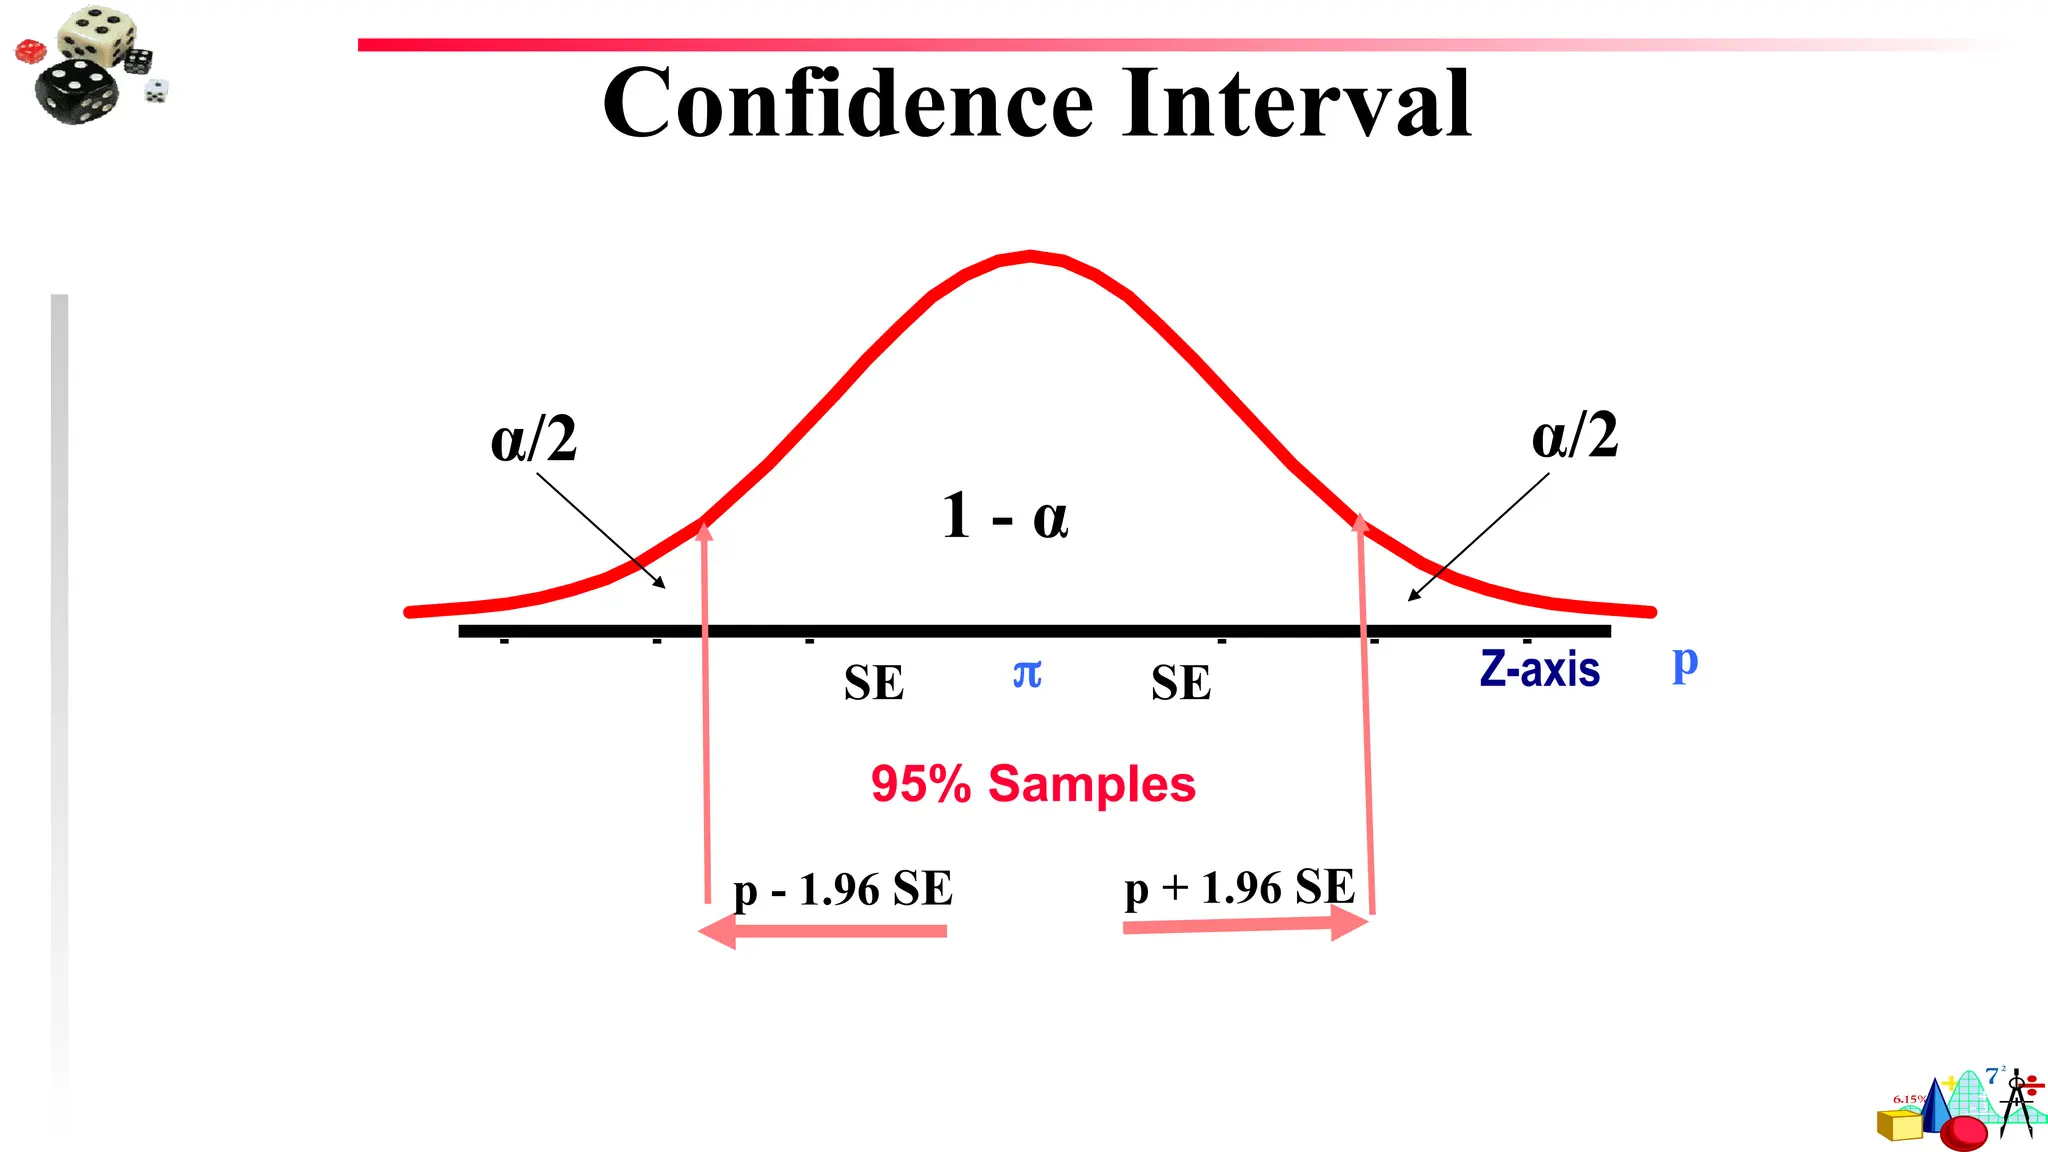
95% confidence level – there is a .95 probability that a specified interval DOES contain
the population mean. In other words, there are 5 chances out of 100 (or 1 chance out of
20) that the interval DOES NOT contain the population mean.
99% confidence level – there is 1 chance out of 100 that the interval DOES NOT
contain the population mean.
68.
Various Levels ofConfidence
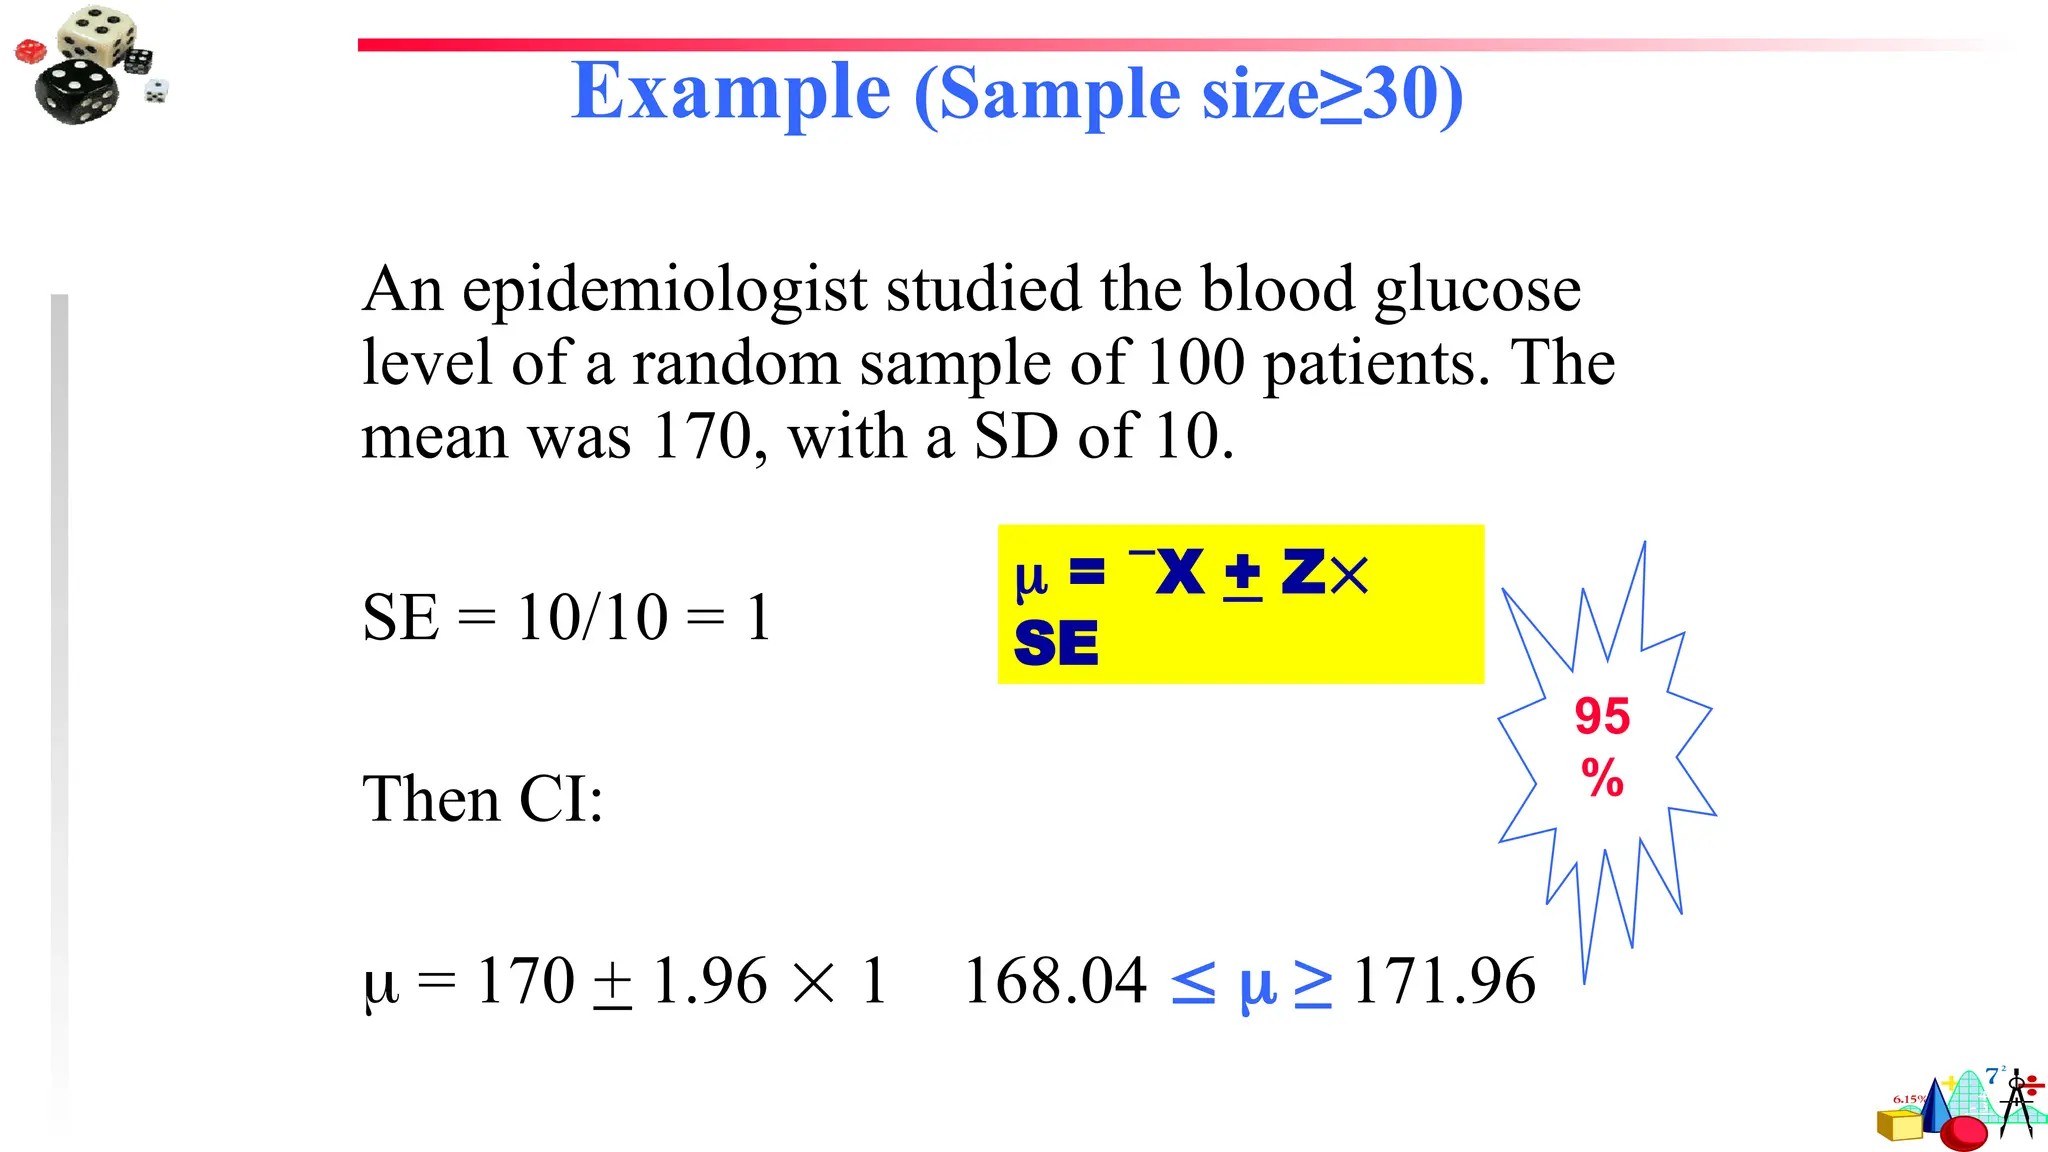
When population standard deviation is known use Z table values:
For 95%CI: mean +/- 1.96 s.e. of mean
For 99% CI: mean +/- 2.58 s.e. of mean
When population standard deviation is not known use “Critical
Value of t” table
For 95%CI: mean +/- 2.04 s.e. of mean
For 99% CI: mean +/- 2.75 s.e. of mean
69.
Process for ConstructingConfidence Intervals
Compute the sample statistic (e.g. a mean)
Compute the standard error of the mean
Make a decision about level of confidence that is desired (usually
95% or 99%)
Find tabled value for 95% or 99% confidence interval
Multiply standard error of the mean by the tabled value
Form interval by adding and subtracting calculated value to and
from the mean
A hypothesistest is used to determine whether or not a treatment has an effect, while
estimation is used to determine how much effect.
This complementary nature is demonstrated when estimation is used after a hypothesis test
that resulted in rejecting the null hypothesis.
In this situation, the hypothesis test has established that a treatment effect exists and the
next logical step is to determine how much effect.
You should keep in mind that even though estimation and hypothesis testing are inferential
procedures, these two techniques differ in terms of the type of question they address.
A hypothesis test, for example, addresses the somewhat academic question concerning the
existence of a treatment effect.
Estimation, on the other hand, is directed toward the more practical question of how much
effect.
72.
A hypothesistest is a process that uses sample statistics to test a claim about the value of
a population parameter.
A verbal statement, or claim, about a population parameter is called a statistical
hypothesis.
Hypothesis testing is designed to detect significant differences: differences that did not
occur by random chance.
In the “one sample” case: we compare a random sample (from a large group) to a
population.
We compare a sample statistic to a population parameter to see if there is a significant
difference.
73.
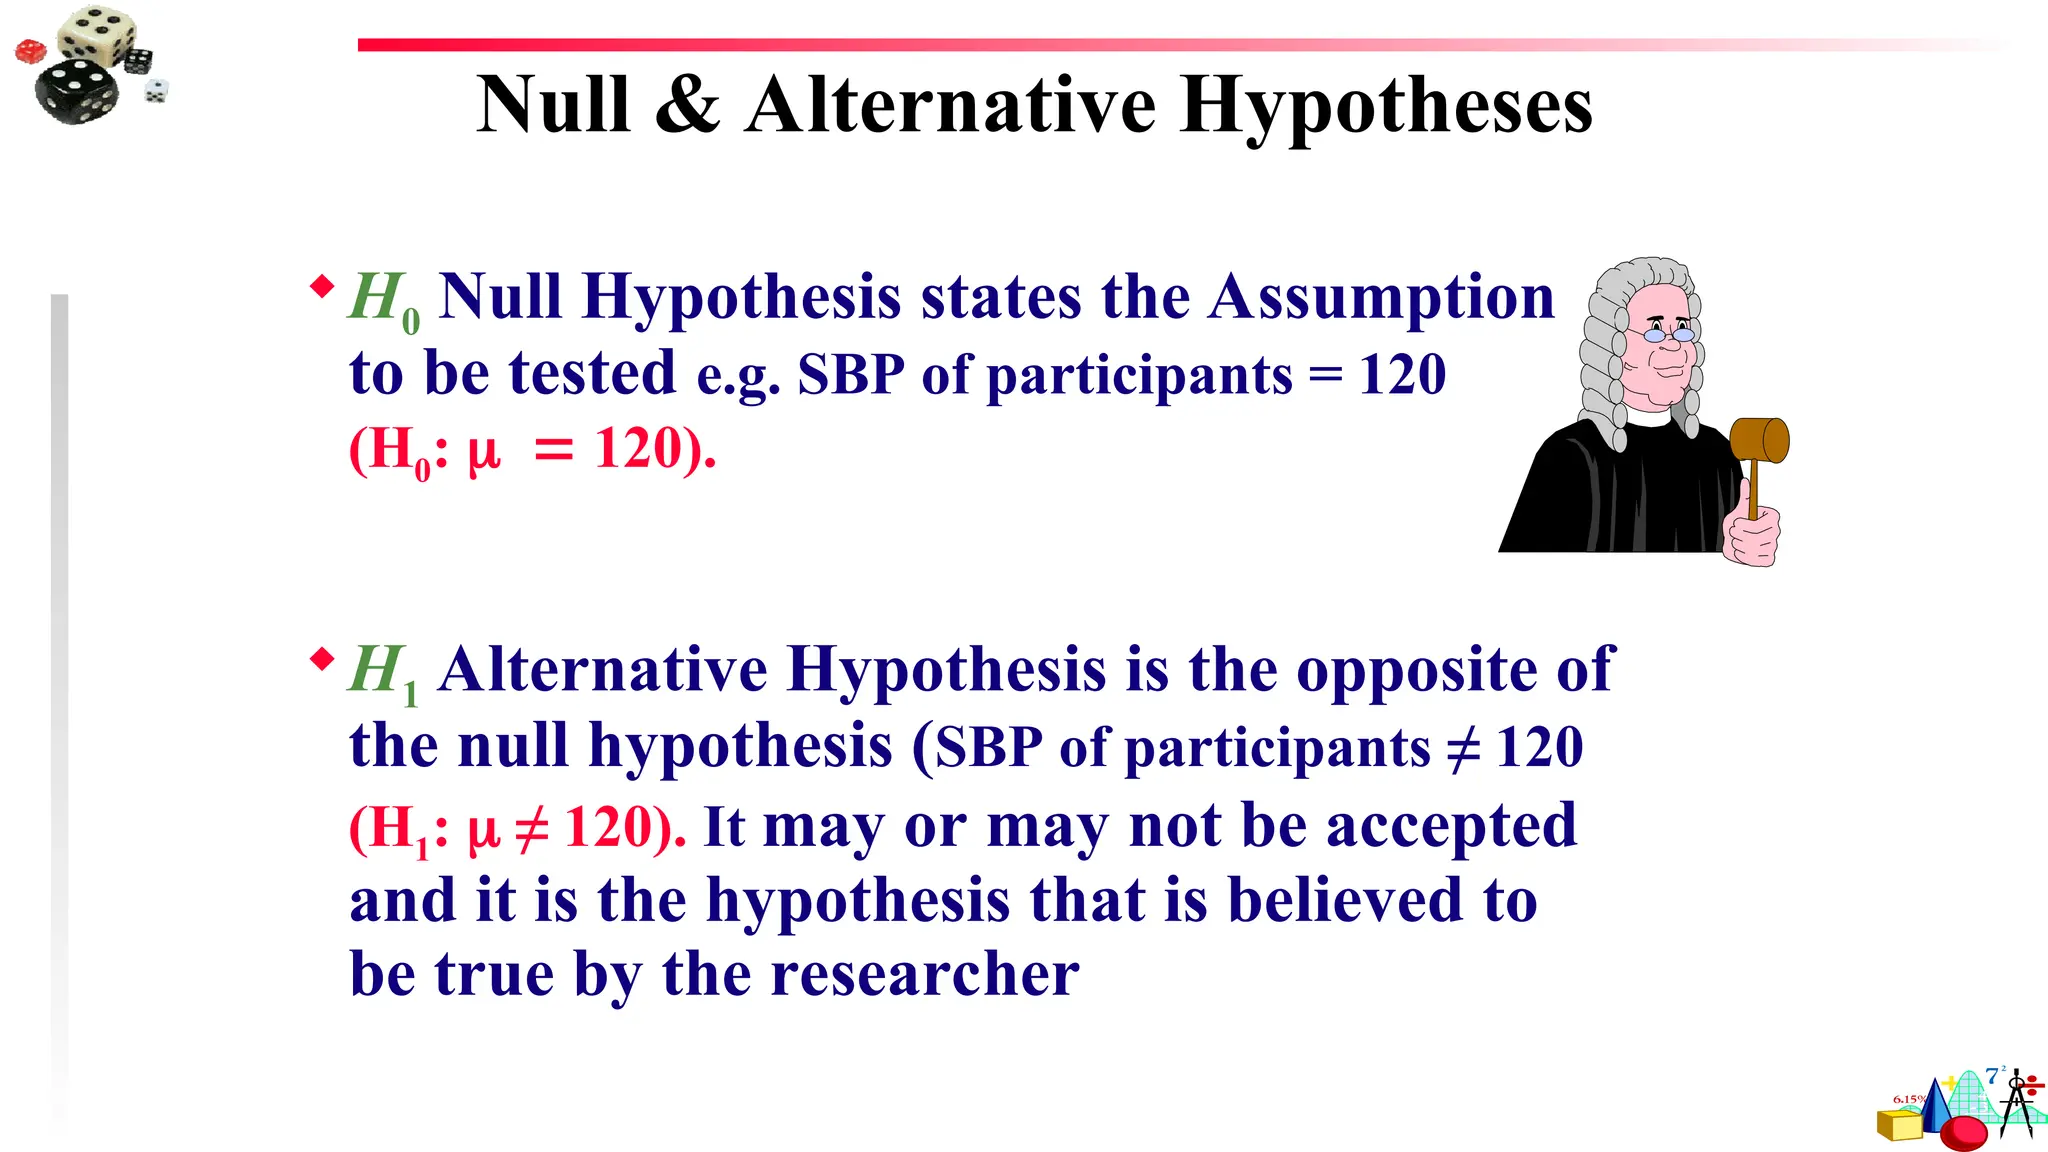
The Null andAlternative Hypotheses:
1. Null Hypothesis (H0)
What is tested
Has serious outcome if incorrect decision made
Always has equality sign: , , or
Designated H0 (pronounced H-oh)
Specified as H0: some numeric value
Specified with = sign even if or
• Example, H0: 3
“The difference is by random chance”.
The H0 always states there is “no significant difference.” In this case, we mean that there is no
significant difference between the population mean and the sample mean.
74.
1. Alternative hypothesis(H1)
Opposite of null hypothesis
Always has inequality sign: ,, or
Designated Ha
Specified Ha: ,, or some value
• Example, Ha: < 3
“The difference is real”.
(H1) always contradicts the H0.
75.
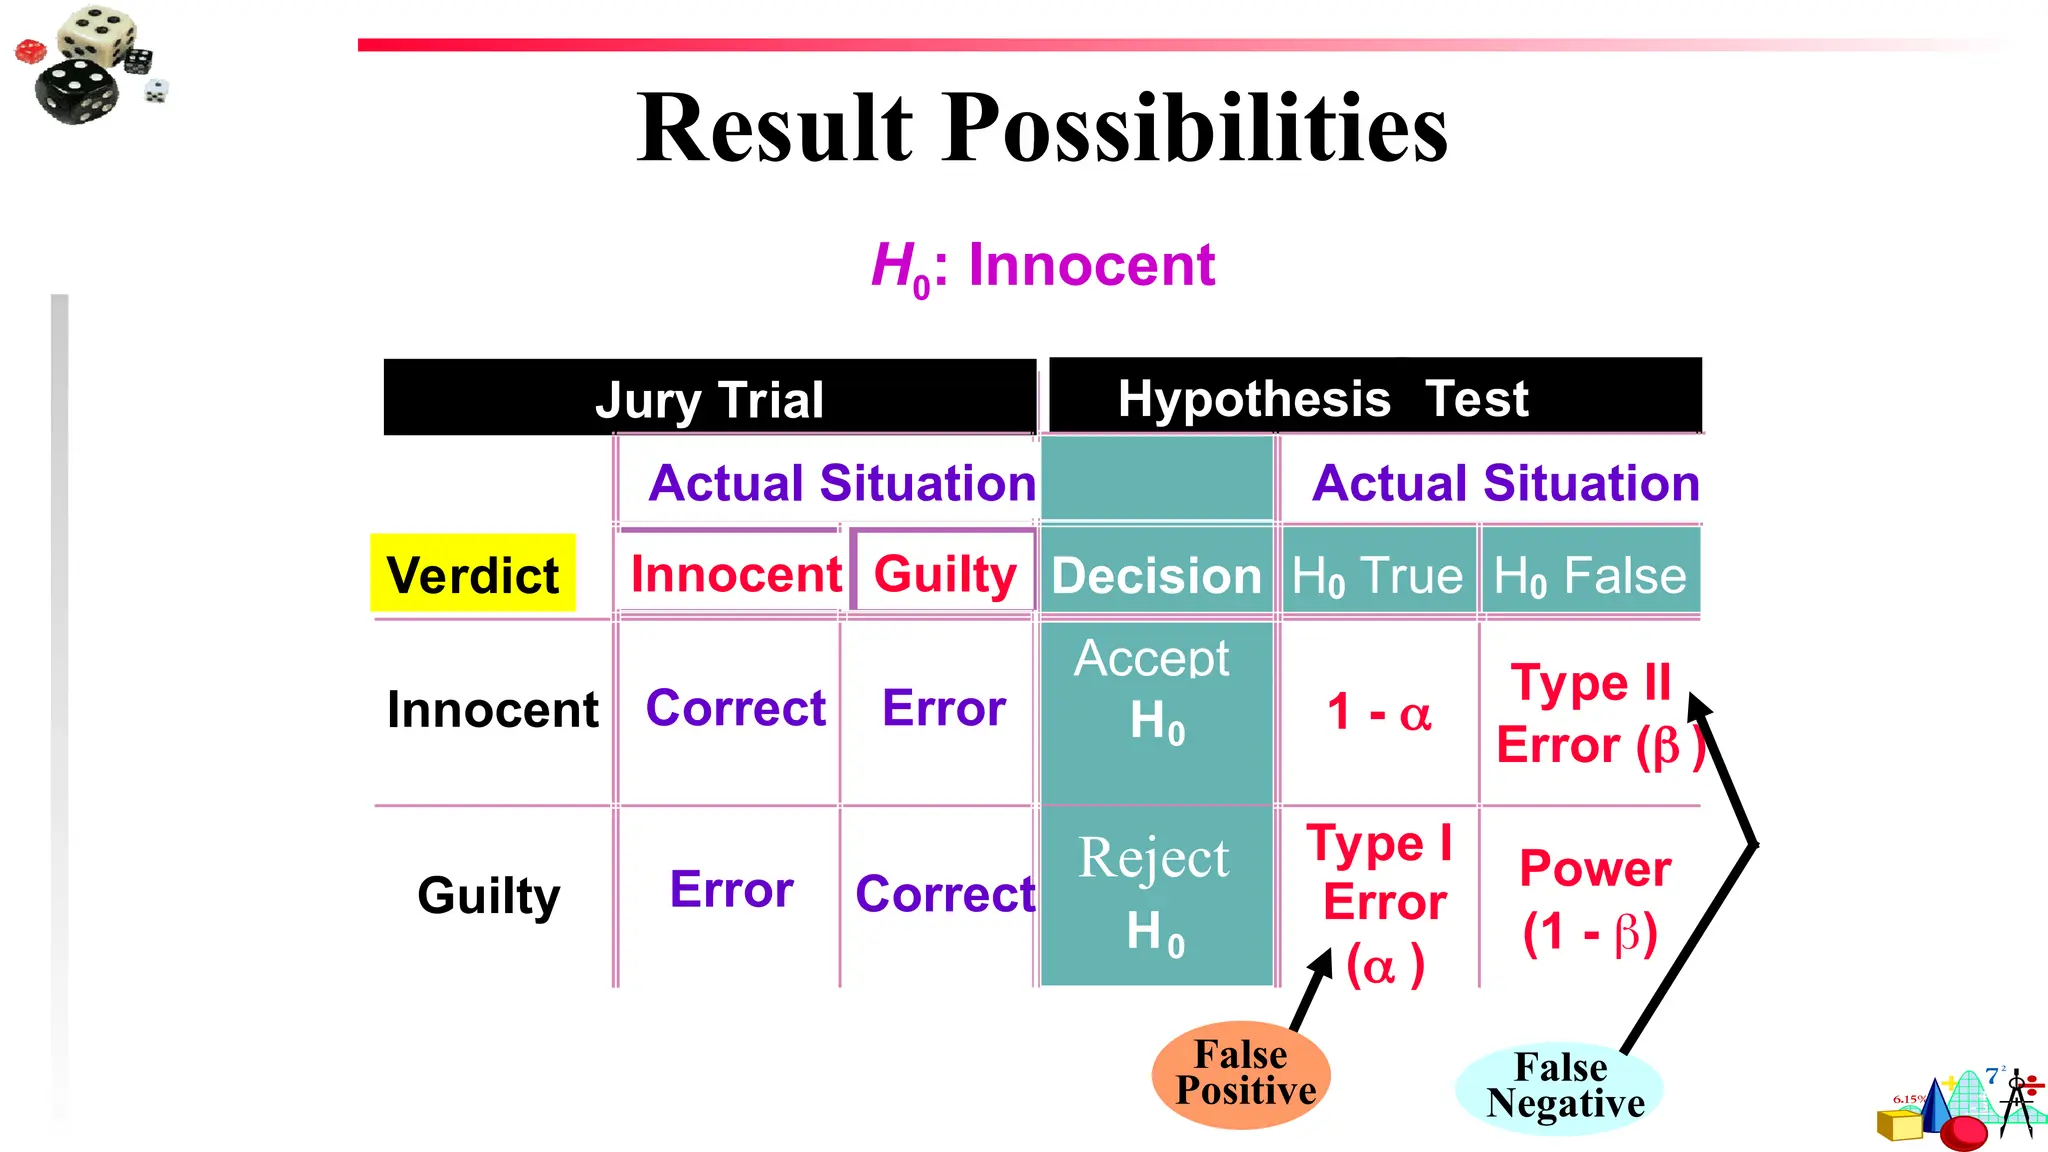
Types of Errors
Nomatter which hypothesis represents the claim, always begin the hypothesis test
assuming that the null hypothesis is true.
At the end of the test, one of two decisions will be made:
1. reject the null hypothesis, or
2. fail to reject the null hypothesis.
A type I error occurs if the null hypothesis is rejected when it is true.
A type II error occurs if the null hypothesis is not rejected when it is false.
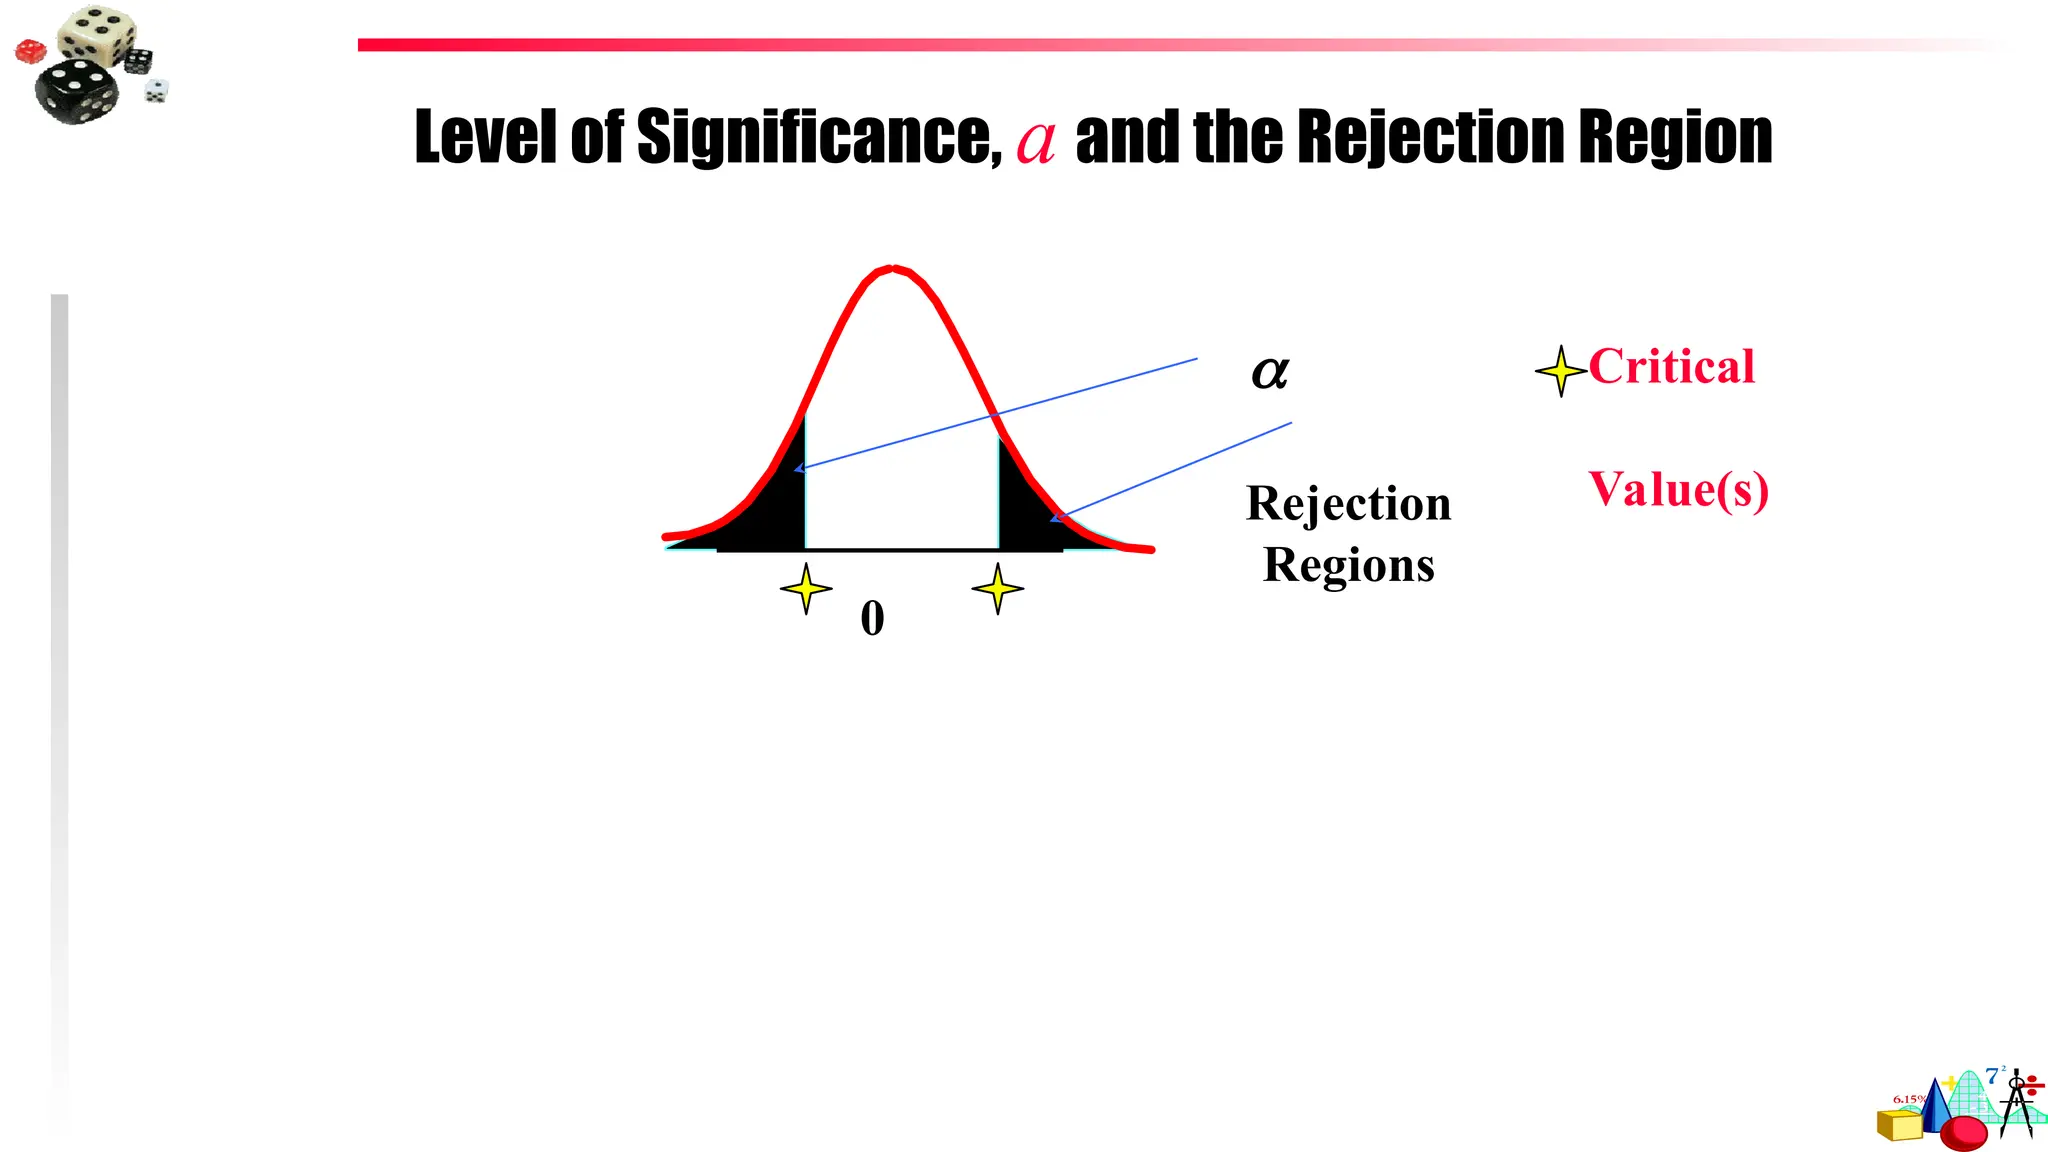
76.
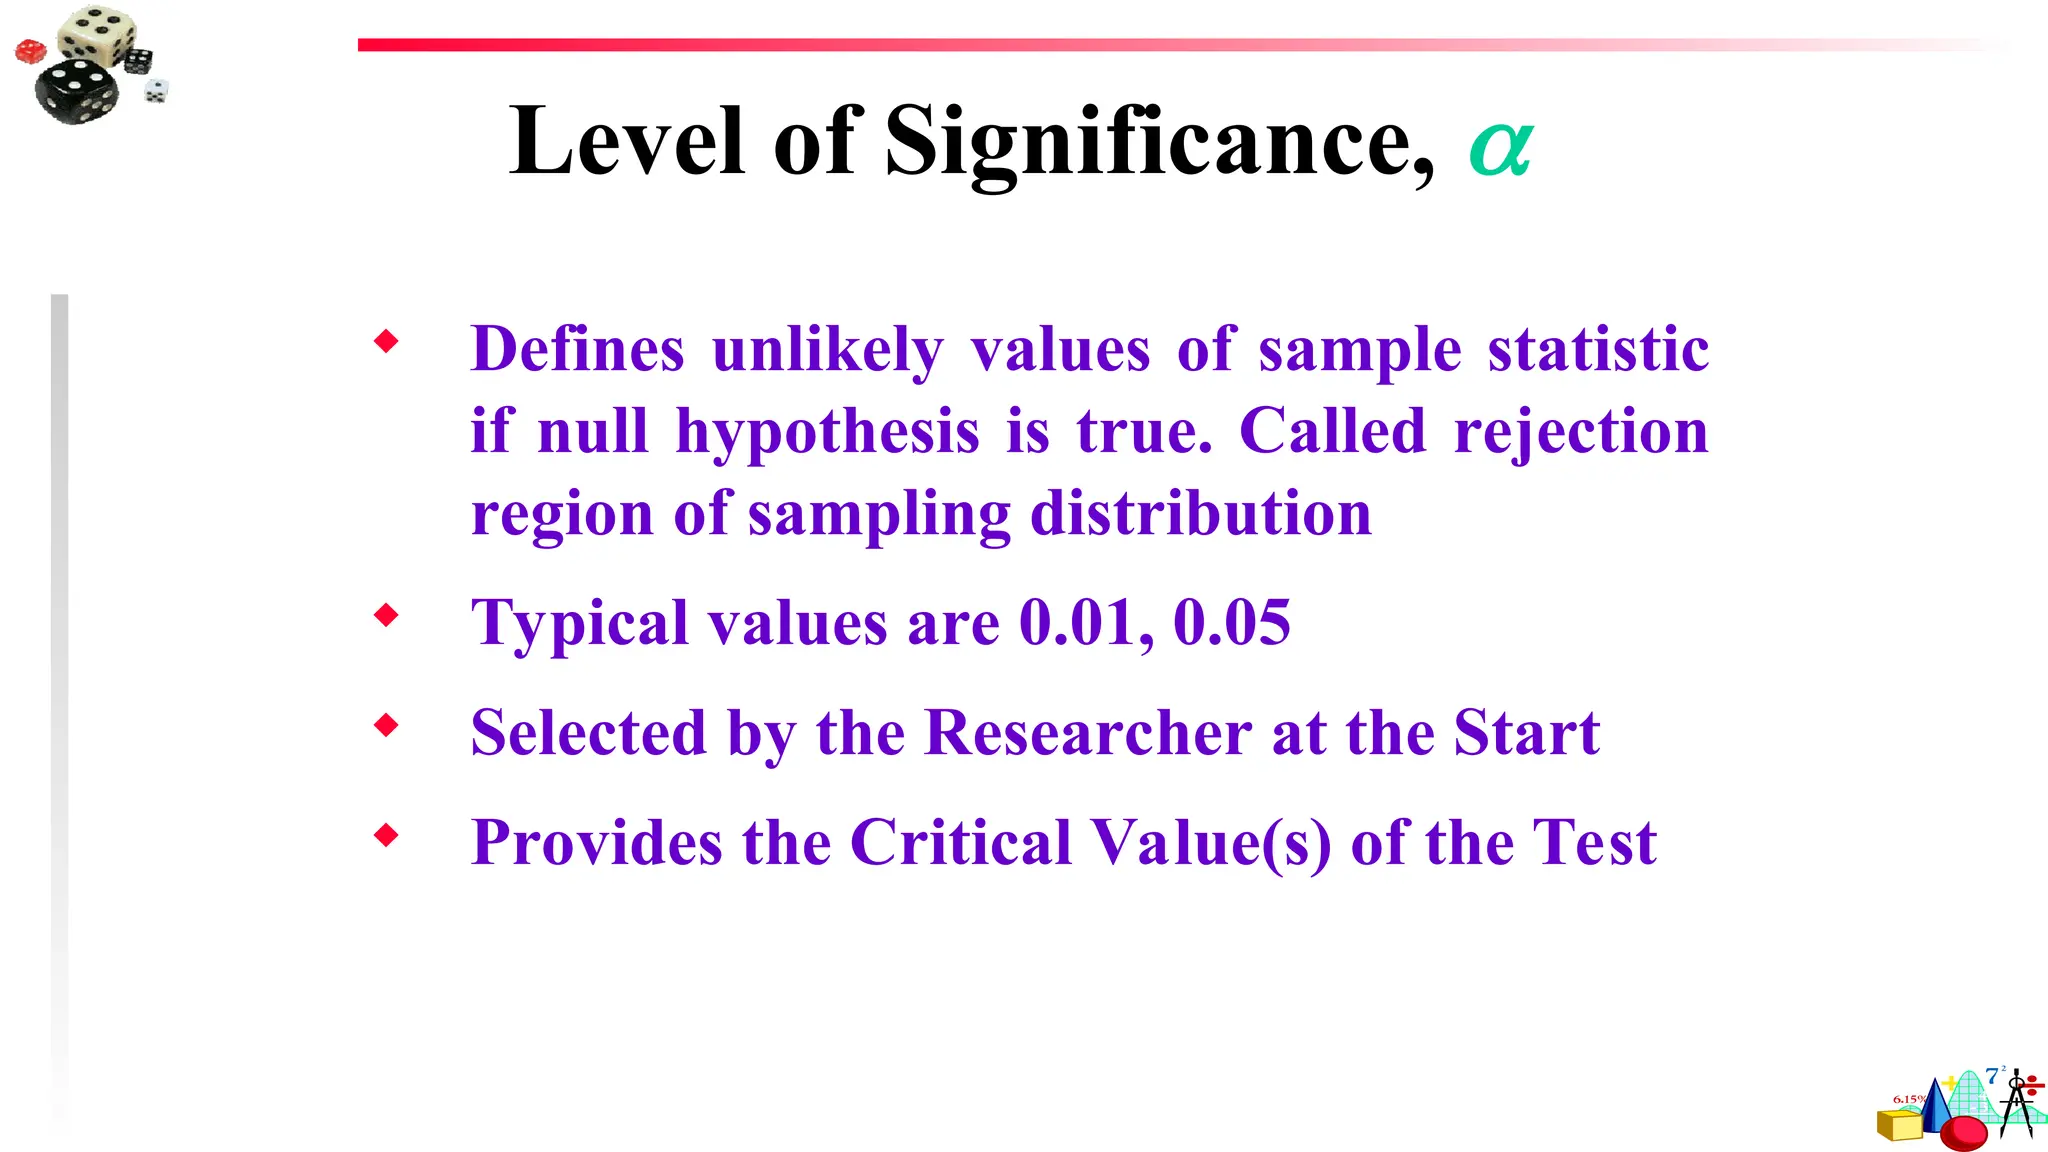
Level of Significance
Ina hypothesis test, the level of significance is your maximum allowable probability of making a type I error. It is denoted by , the lowercase Greek letter alpha.
The probability of making a type II error is denoted by , the lowercase Greek letter beta.
By setting the level of significance at a small value, you are saying that you want the
probability of rejecting a true null hypothesis to be small.
Commonly used levels of significance:
= 0.10 = 0.05 = 0.01
Hypothesis tests are
based on .
77.
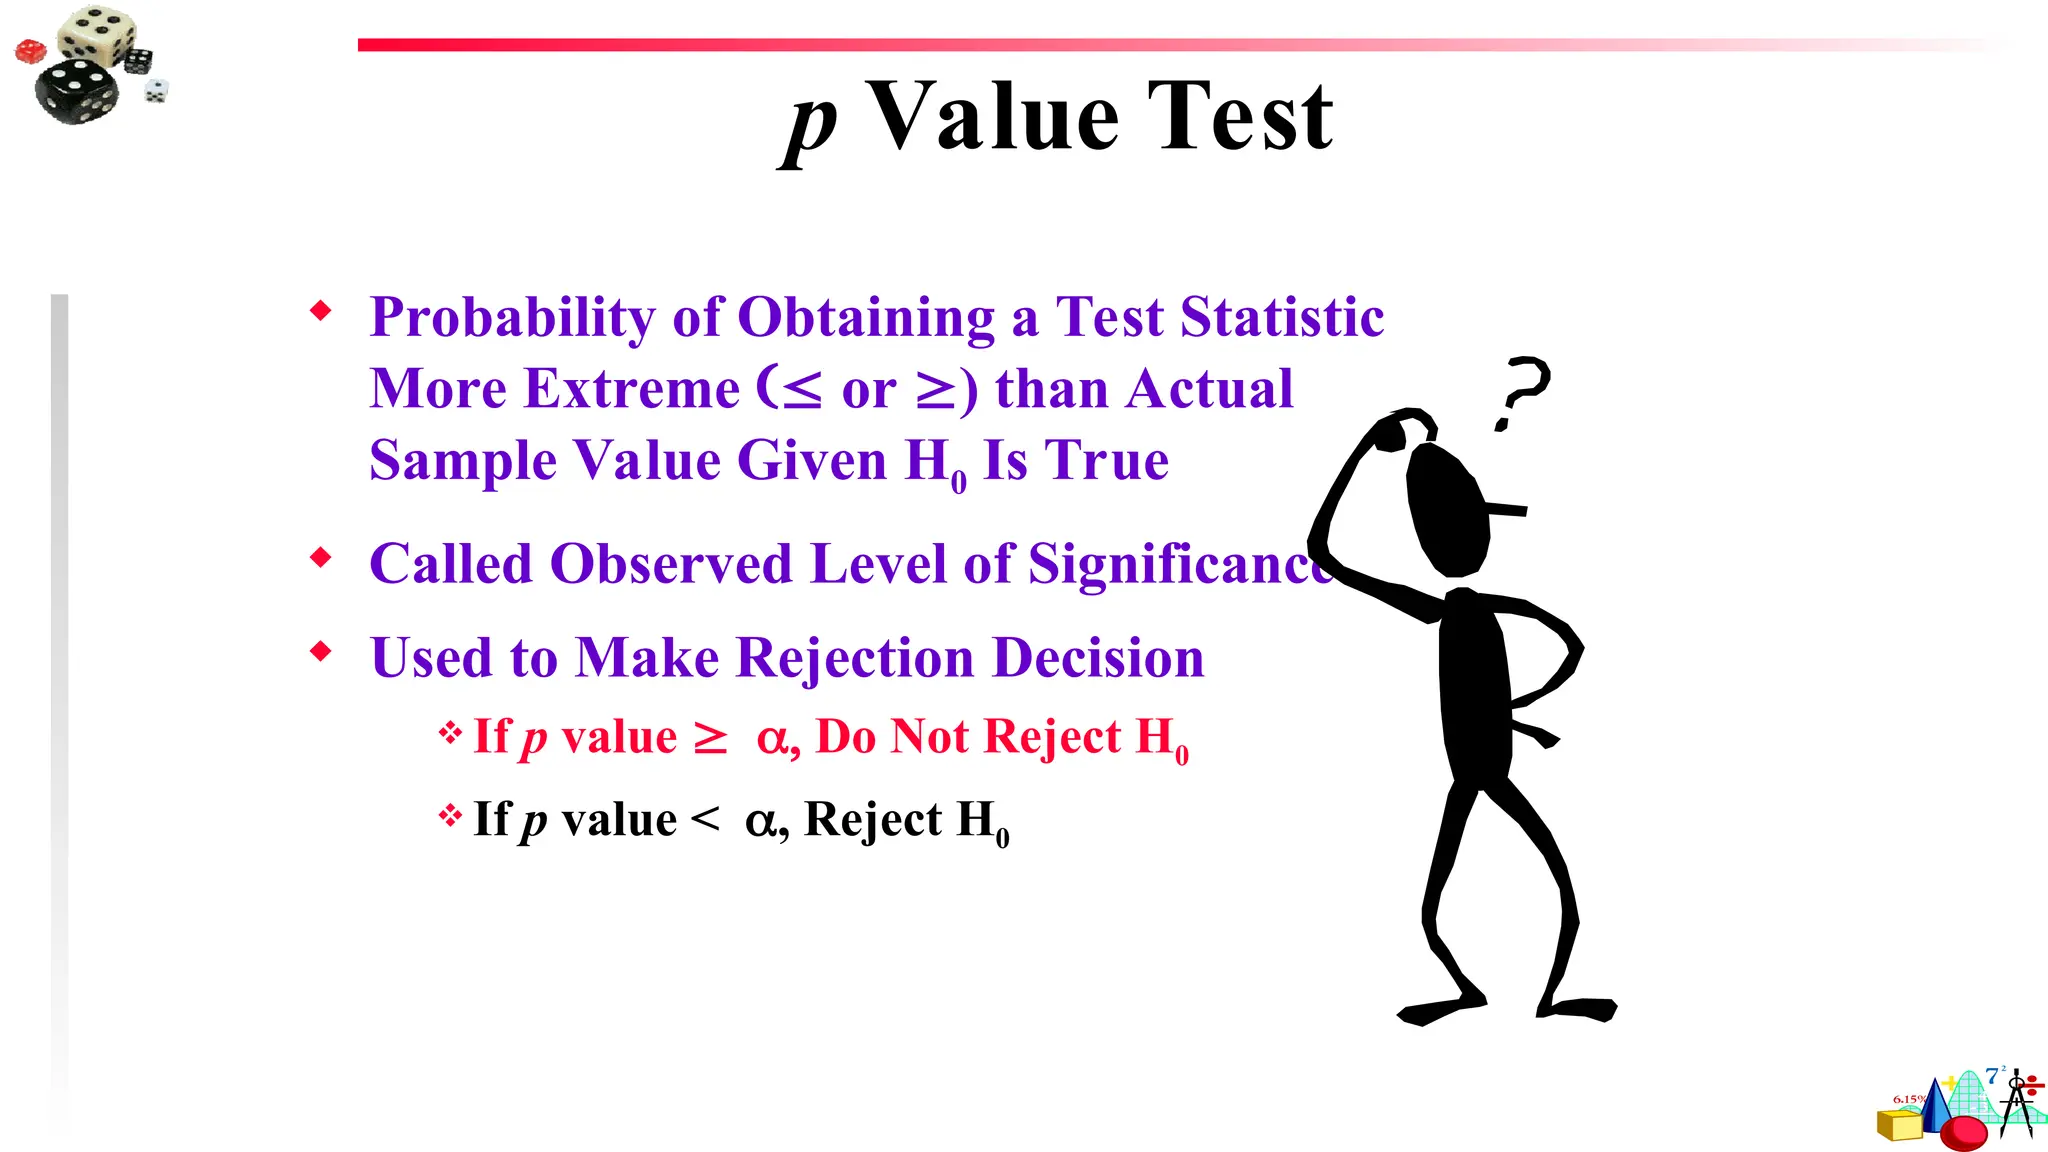
P-values
If thenull hypothesis is true, a P-value (or probability value) of a
hypothesis test is the probability of obtaining a sample statistic
with a value as extreme or more extreme than the one determined
from the sample data.
The P-value of a hypothesis test depends on the nature of the test.
There are three types of hypothesis tests – a left-, right-, or two-
tailed test. The type of test depends on the region of the sampling
distribution that favors a rejection of H0. This region is indicated
by the alternative hypothesis.
78.
If thealternative hypothesis contains the less-than inequality symbol (<), the
hypothesis test is a left-tailed test.
H0: μ k
Ha: μ < k
If the alternative hypothesis contains the greater-than symbol (>), the
hypothesis test is a right-tailed test.
H0: μ k
Ha: μ > k
z
0 1 2 3
-3 -2 -1
P is the area to the
left of the test
statistic.
Test
statistic
z
0 1 2 3
-3 -2 -1
P is the area to the
right of the test
statistic.
Test
statistic
79.
3. If thealternative hypothesis contains the not-equal-to symbol (), the hypothesis
test is a two-tailed test. In a two-tailed test, each tail has an area of P.
z
0 1 2 3
-3 -2 -1
Test
statistic
Test
statistic
H0: μ = k
Ha: μ k
P is twice the area
to the left of the
negative test
statistic.
P is twice the area
to the right of the
positive test
statistic.
2
1
80.
Making a Decision
DecisionRule Based on P-value
To use a P-value to make a conclusion in a hypothesis test, compare
the P-value with .
1. If P , then reject H0.
2. If P > , then fail to reject H0.
Claim
Claim is H0 Claim is Ha
Do not reject H0
Reject H0
There is enough evidence to
reject the claim.
Decision
There is not enough evidence to
reject the claim.
There is enough evidence to
support the claim.
There is not enough evidence to
support the claim.
81.
Interpreting a Decision
Example:
Youperform a hypothesis test for the following claim. How should you interpret your decision
if you reject H0? If you fail to reject H0?
H0: (Claim) A cigarette manufacturer claims that one-eighth
of the US adult population smokes cigarettes.
If H0 is rejected, you should conclude “there is sufficient evidence to
indicate that the manufacturer’s claim is false.”
If you fail to reject H0, you should conclude “there is not sufficient
evidence to indicate that the manufacturer’s claim is false.”
82.
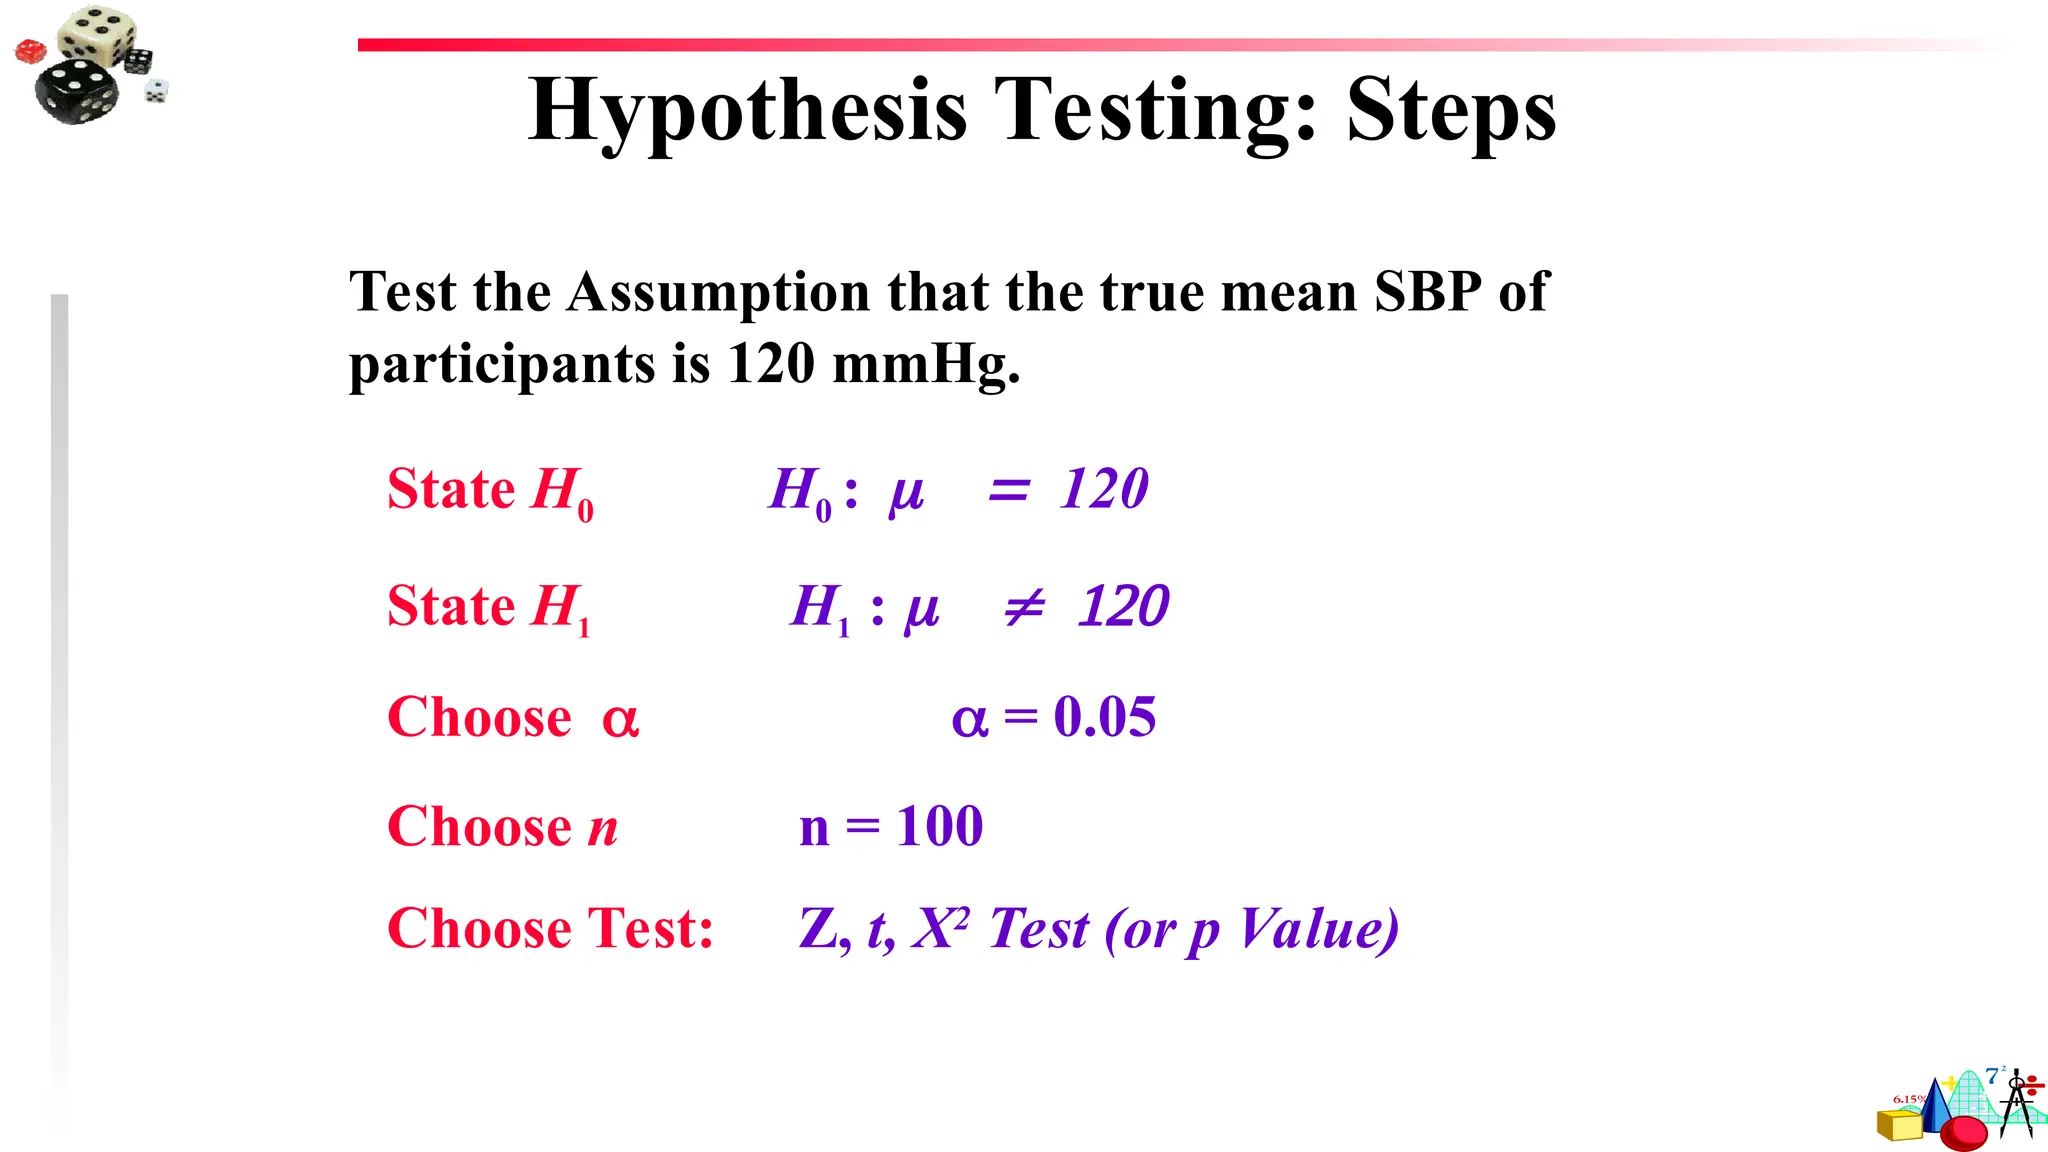
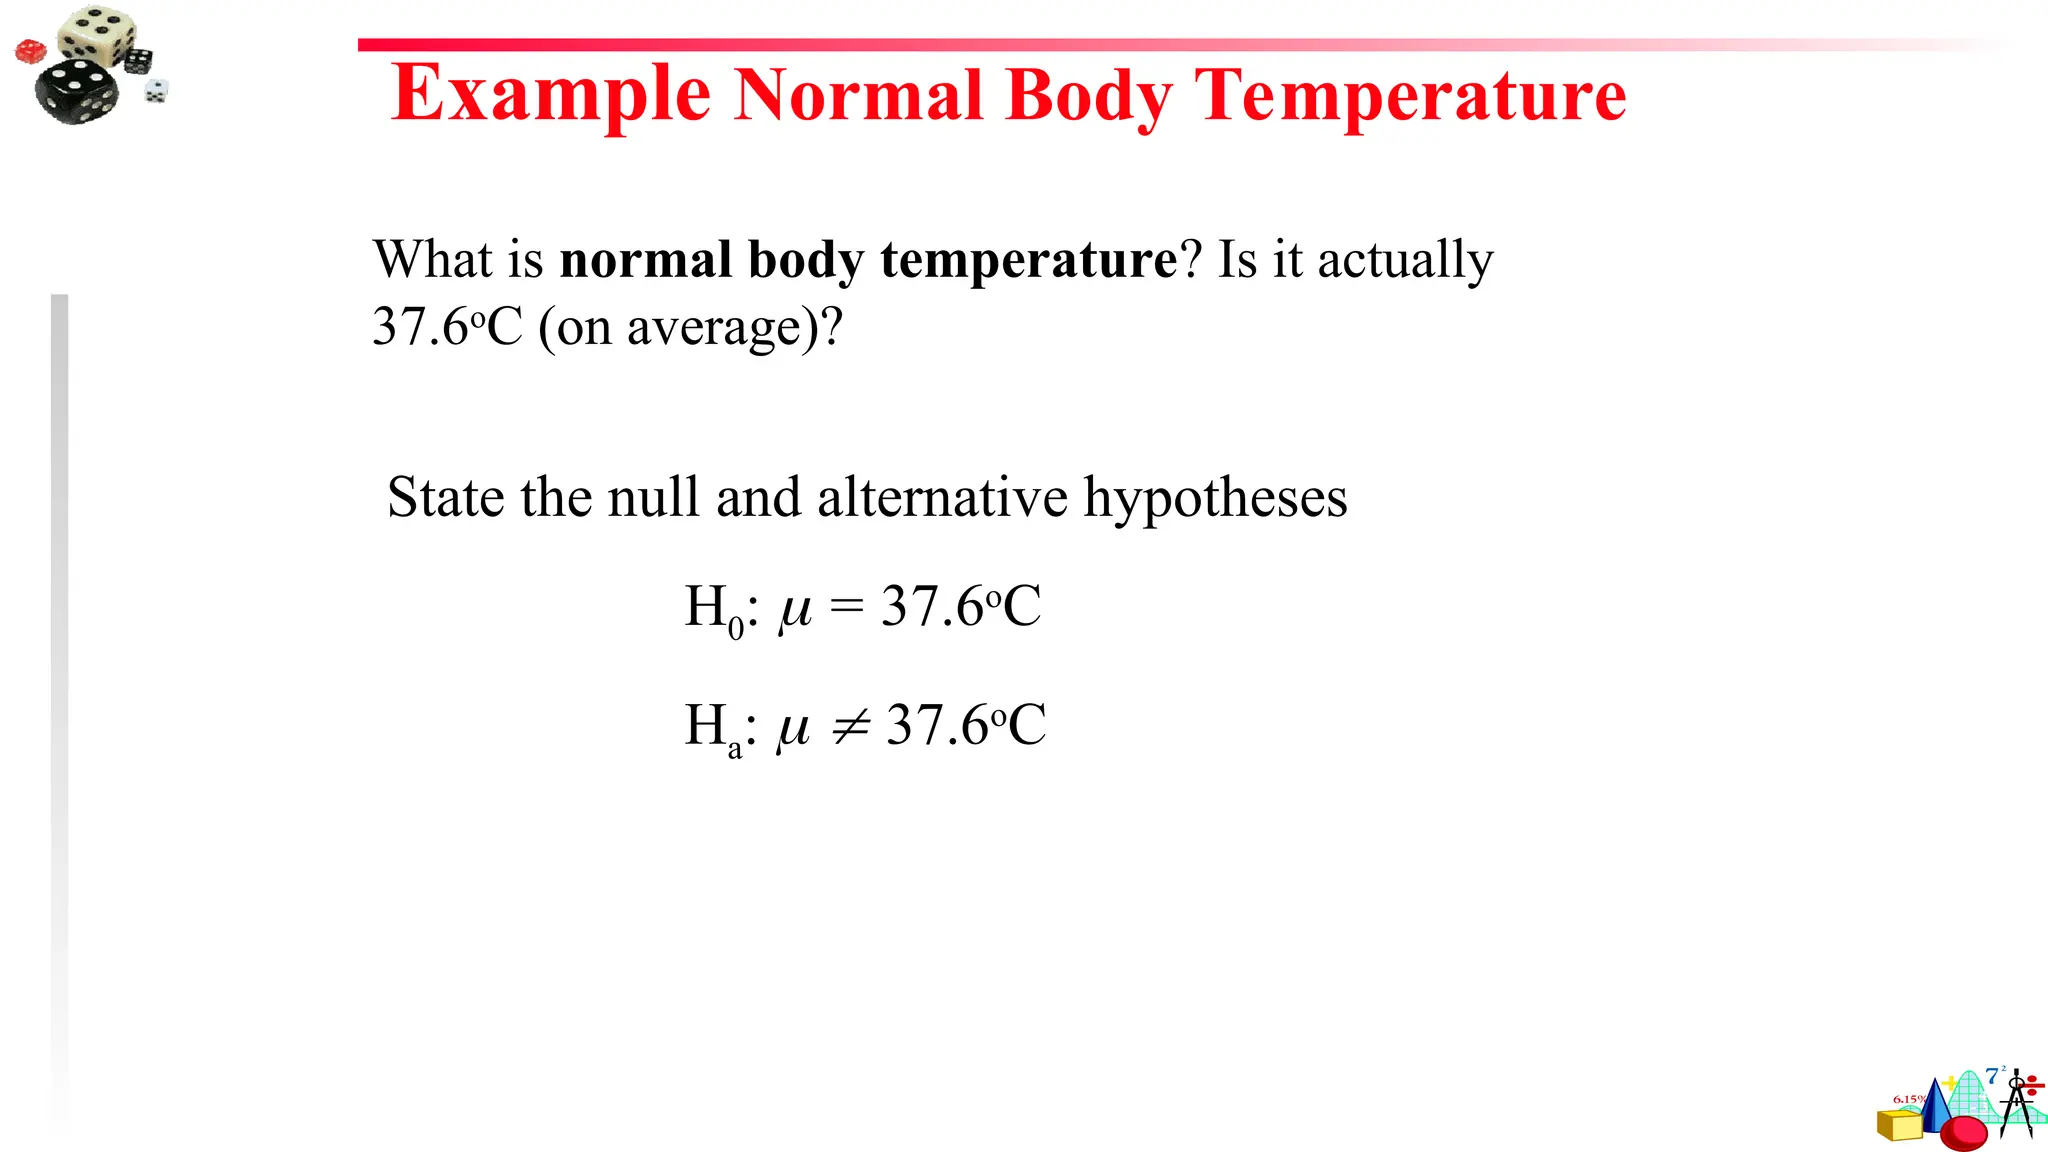
Steps for HypothesisTesting
1. State the claim mathematically and verbally. Identify the
null and alternative hypotheses.
2. Specify the level of significance.
3. Determine the standardized
sampling distribution and
draw its graph.
H0: ? Ha: ?
= ?
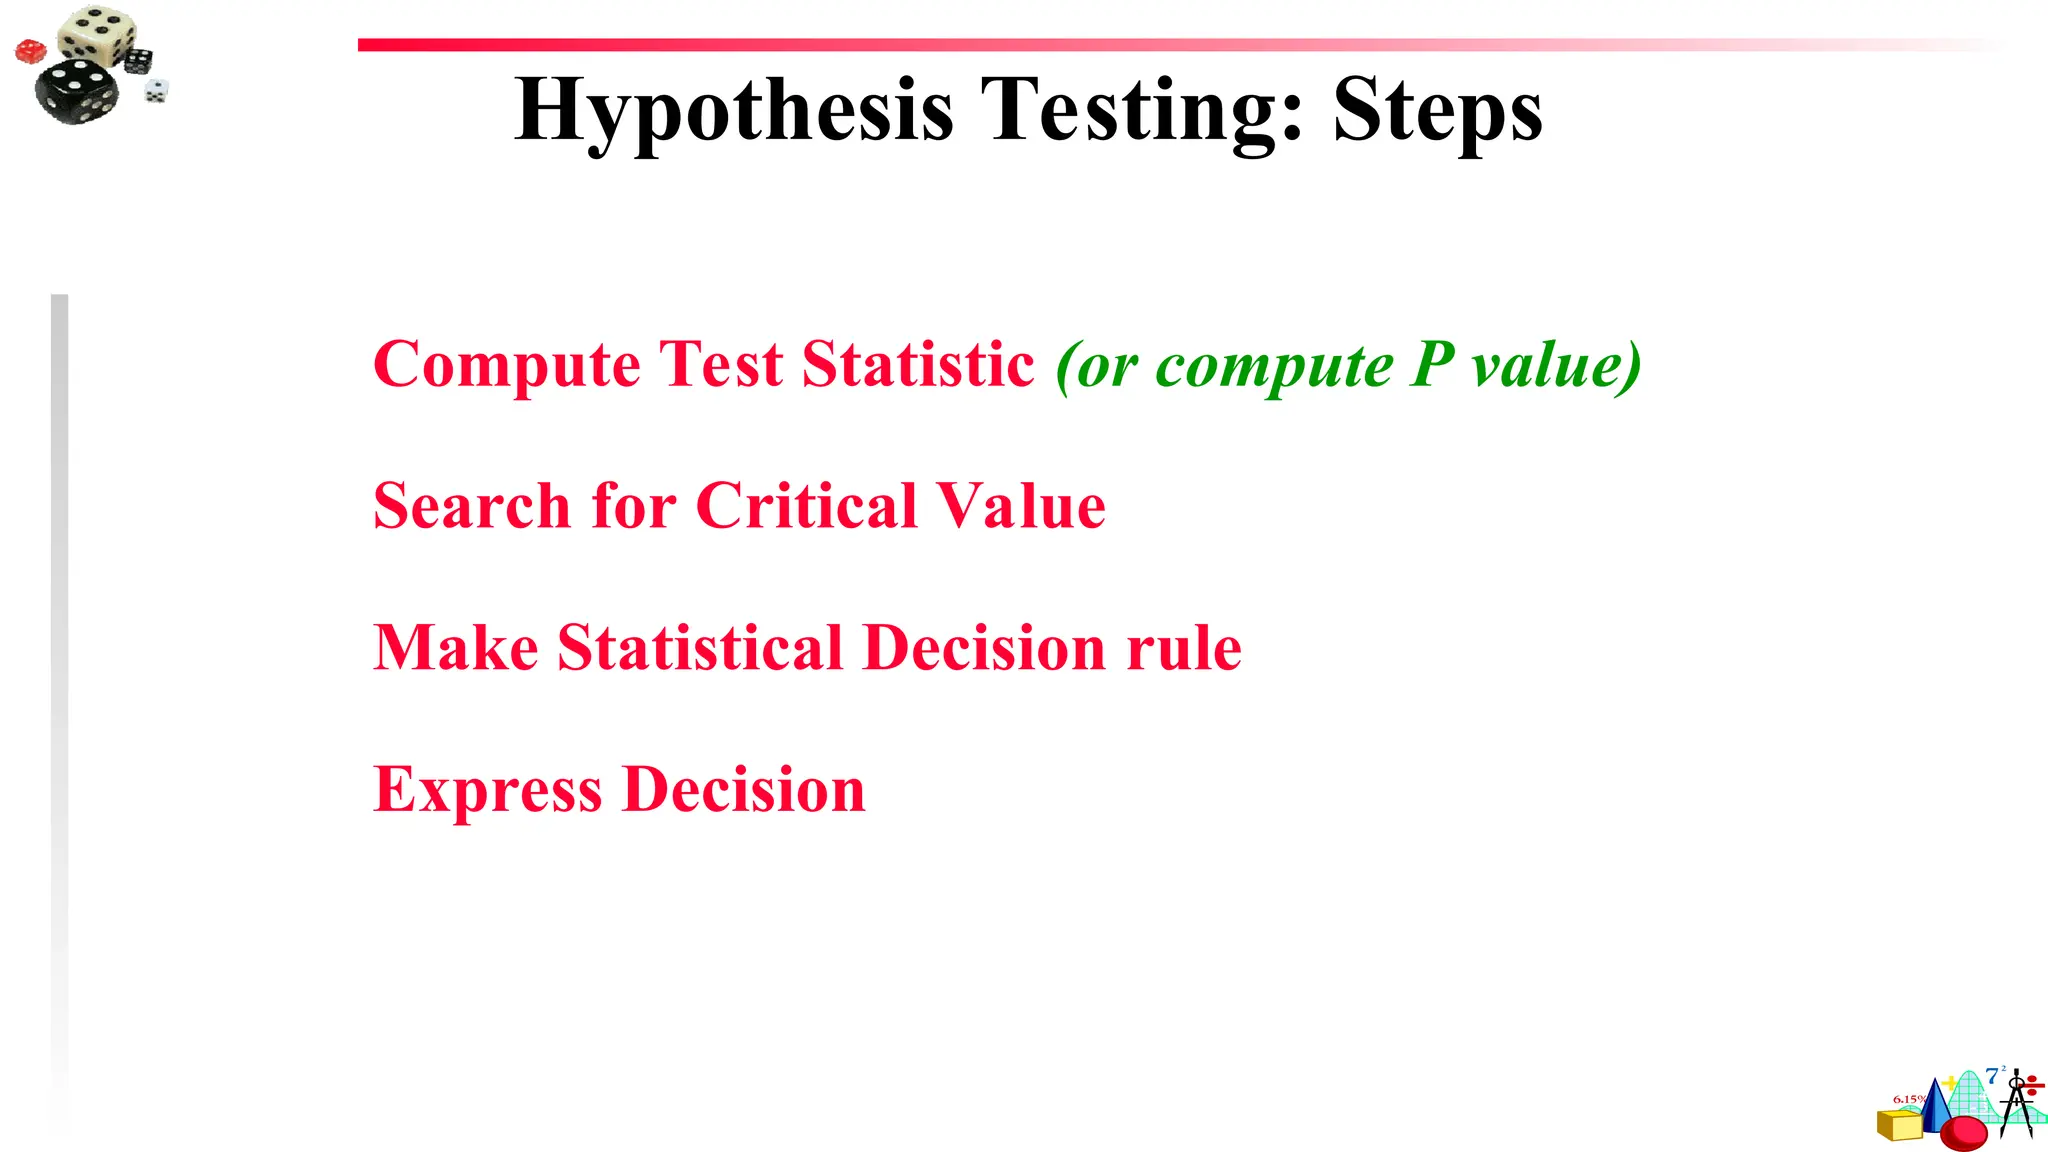
4. Calculate the test statistic
and its standardized value.
Add it to your sketch. Test statistic
This sampling distribution is
based on the assumption that
H0 is true.
z
0
Continued.
z
0
83.
Steps for HypothesisTesting
5. Find the P-value.
6. Use the following decision rule.
7. Write a statement to interpret the decision in the context of
the original claim.
Is the P-value less than or
equal to the level of
significance?
Fail to reject H0.
Yes
Reject H0.
No
These steps apply to left-tailed, right-tailed, and two-tailed
tests.3
Two Sample HypothesisTesting
In a two-sample hypothesis test, two parameters from two populations are
compared.
For a two-sample hypothesis test,
1.the null hypothesis H0 is a statistical hypothesis that usually states
there is no difference between the parameters of two populations.
The null hypothesis always contains the symbol , =, or .
2.the alternative hypothesis Ha is a statistical hypothesis that is true
when H0 is false. The alternative hypothesis always contains the
symbol >, , or <.
86.
Two Sample HypothesisTesting
To write a null and alternative hypothesis for a two-sample hypothesis test, translate
the claim made about the population parameters from a verbal statement to a
mathematical statement.
H0: μ1 = μ2
Ha: μ1 μ2
H0: μ1 μ2
Ha: μ1 > μ2
H0: μ1 μ2
Ha: μ1 < μ2
Regardless of which hypotheses used, μ1 = μ2 is always assumed to be true.
87.
Two Sample z-Test
Threeconditions are necessary to perform a z-test for the
difference between two population means μ1 and μ2.
1.The samples must be randomly selected.
2.The samples must be independent. Two samples are independent
if the sample selected from one population is not related to the
sample selected from the second population.
3.Each sample size must be at least 30, or, if not, each population
must have a normal distribution with a known standard deviation.
88.
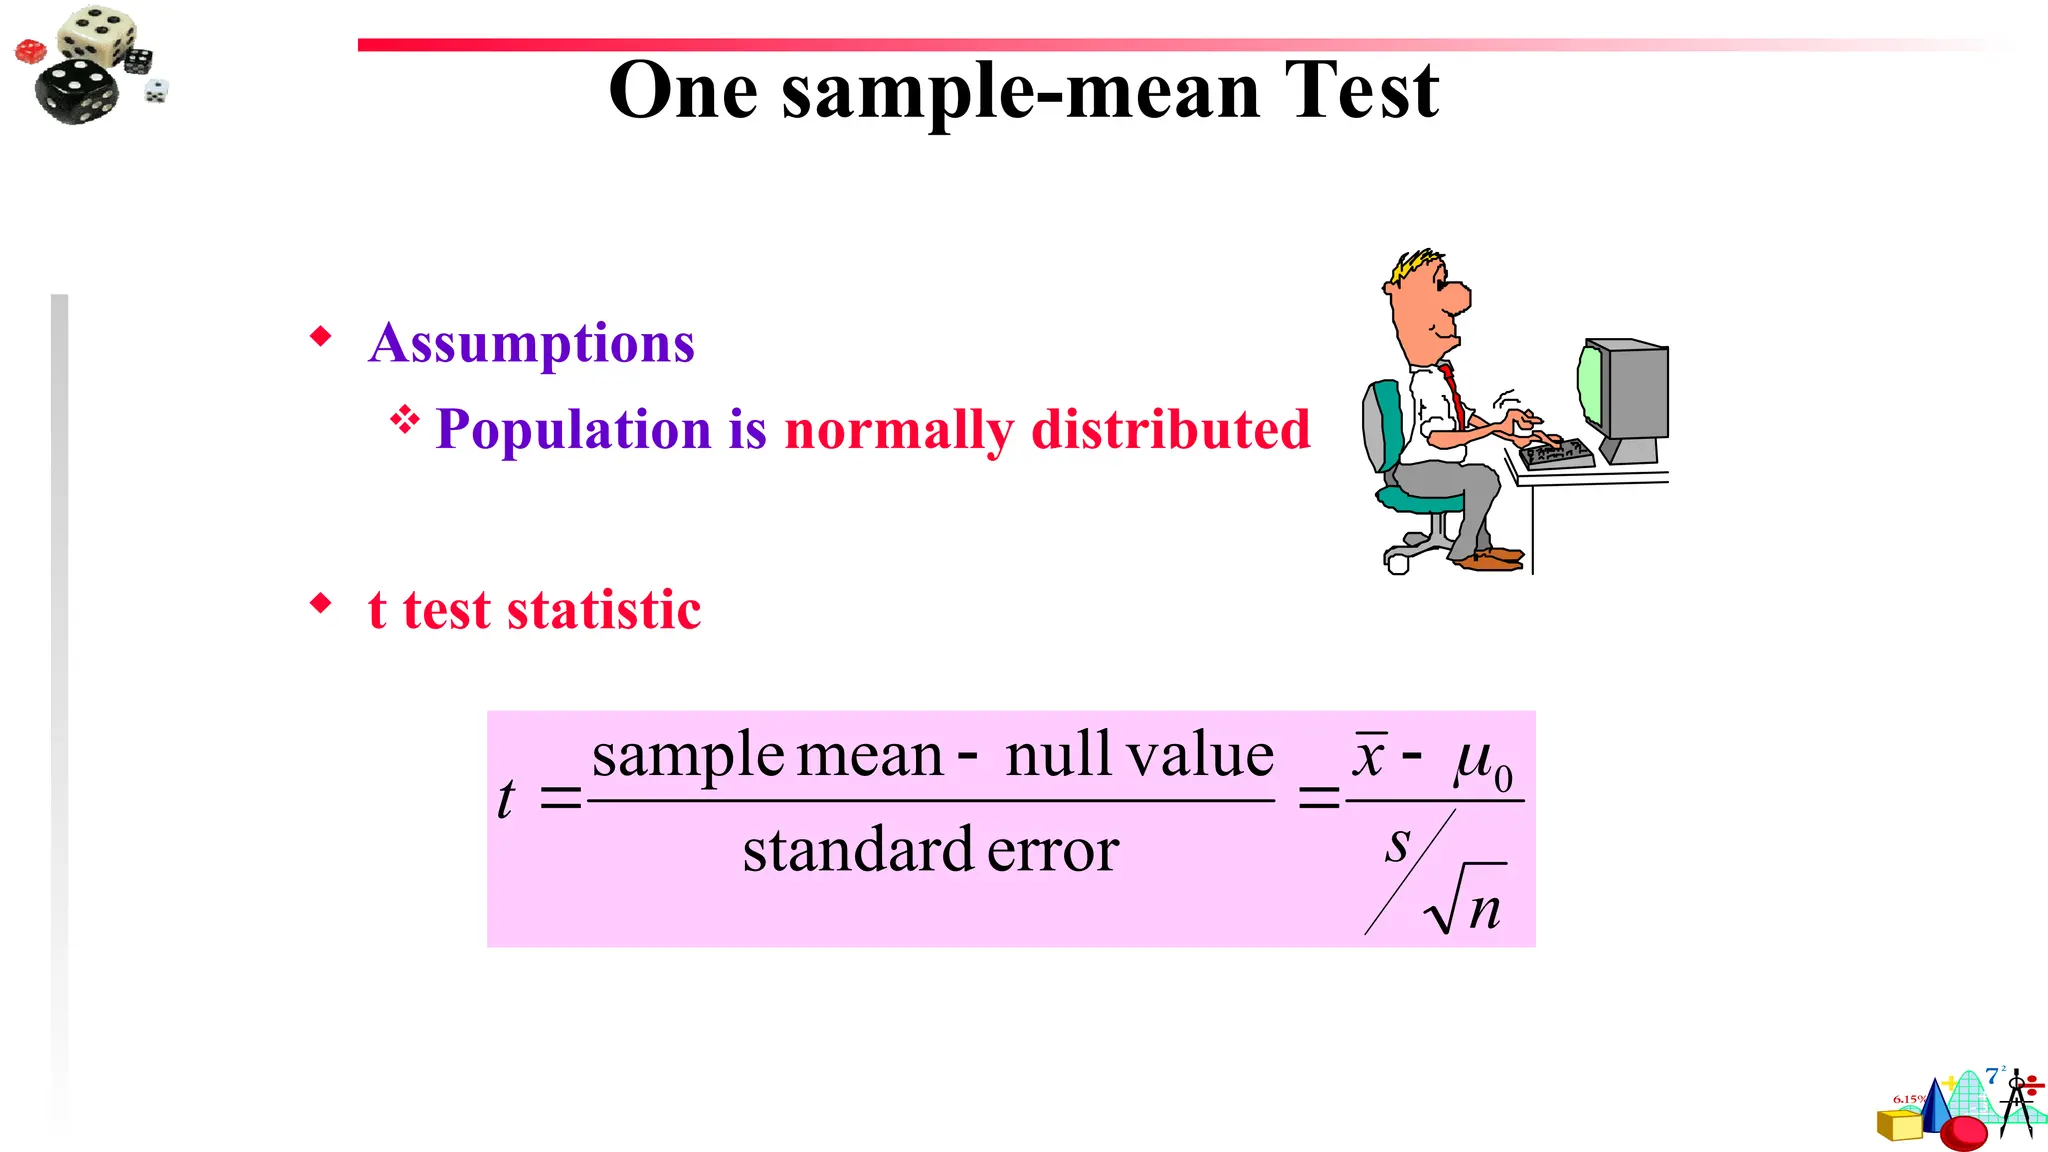
Two Sample t-Test
Ifsamples of size less than 30 are taken from normally-distributed
populations, a t-test may be used to test the difference between the
population means μ1 and μ2.
Three conditions are necessary to use a t-test for small independent samples.
1.The samples must be randomly selected.
2.The samples must be independent. Two samples are independent if the
sample selected from one population is not related to the sample selected
from the second population.
3.Each population must have a normal distribution, and samples of size less
than 30 .
Anova isa procedure that can be used to analyze the results
from both simple and complex experiments
Reveals whether the obtained difference between any
treatments is real or occur by chance.
It partition the total variation in to different components and
test their significance
91.
Assumptions of ANOVA
Most of the analysis are based on linear models (regression and ANOVA models)
1)Normality
Errors or residuals must be normally distributed. This is ensured through proper randomization
and blocking
Another way of assessing normality is to use probability plots (pplots) of the residuals-this
examines frequency distribution of your data, and compare the shape of that distribution to that
expected normal distribution
For normal, the pplot will be a straight line; various kinds of skewness..etc
If normality is violated the F-test is invalid
Can be checked using box plots,..etc
92.
2)Homogeneity of variances
Thevariance in the response variable is the same at each level, or combination of levels, of the
predictor variables.
check the normal distribution, but unequal variances may occur if sample sizes are small.
3) Linearity
Parametric correlation and linear regression analyses are based on straight-line relationships between
variables.
This assumption is checked by examining a scatter plot of the two variables or more variables
4)Independence of errors
This assumption implies all the observations should be independent of each other
Any treatment should be assigned randomly to any of the experimental units through proper
randomization to avoid dependency .
This assumption is not met when the same experimental unit is affected by under different treatments
If violated mean square of error will be inflated and
type II will occur
93.
Analysis of variance(ANOVA)
Commonly used to determine differences between several
groups or treatments
Partitioning of total variation into different component
Is used when we have two and more than two treatment levels
The simplest ANOVA -single factor – one-way ANOVA.
Because ofthe nature of agricultural research that focuses primarily on the behaviour of
biological organisms in a specified environment, the association among treatments,
environmental factors, and responses that are usually evaluated in livestock research are
association between response variables, Association between response and treatments,
association between response and environment.
Both correlation and regression has a numbers of advantages:-
To know the association/relationships between numbers of variables that could
affect the response of treatment on the experimental units in an experiment.
To understand the association of different variables on the response of animal
performances in an experiment
To predict the association of different variables on animal performance so that it
would be possible to adjust the amount of treatments used on the experimental
units.
96.
Correlation analysis
Thediscovering and measuring of the magnified and direction of the relationship between
two/more variable is called Correlation.
It is a measure of the degree to which variables vary together or a measure of the intensity
of the association between different variables in an experiment.
Suppose you have two continuous variables X and Y, if the change in one variable affects,
the change in the other variable, the variable X is said to be correlated with variable Y or
vice versa.
In this case, the correlation between two or more variables does not necessarily interested to
have dependent or independent variables, both can be dependent or independent variables or
both alternatively.
The correlation procedures can be classified according to the number of variables involved
and the form of the functional relationship between variables involved in the experiment.
97.
The proceduresis termed simple if only two variables are involved and multiple, otherwise.
The procedure is termed linear if the form of the underlying relationship is linear and non-
linear, otherwise.
Thus, correlation analysis can be classified into four types.
1. Simple linear correlation
2. Multiple linear correlation
3. Simple non linear correlation
4. Multiple non linear correlation
Correlation analysis is usually expressed by using index called coefficient of correlation
and it is symbolized by “r” incase of sample, and “p” incase of population.
The values of coefficient of correlation range between –1 and 1, inclusively (−1 ≤ r ≤ 1). It
tells us only the magnitude, degree, and direction of association of the variables in an
experiment.
98.
For r> 0, the two variables have a positive correlation, and for r < 0, the two variables
have a negative correlation.
The positive correlation means where the changes in both variables move in the same
direction (as values of one variable increase, increasing values of the other variable are
observed and as values of one variable decrease, decreasing values of the other variable are
observed).
A negative correlation means that as values of one variable increase, decreasing values of
the other variable are observed or vice versa.
The value r = 1 or r = –1 indicates an ideal or perfect linear relationship, and r = 0 means
that there is no linear association.
Coefficient of correlation is unit free. It is not affected by change of the origin, scale or
both in an experiment.
The coefficient of correlation ® is used under certain assumptions, such as the variables are
continuous, random variables and are normally distributed, the relationship between
variables is linear and each pair of observation is not connected with each other.
99.
The magnitudeof correlation is calculated by the formula called coefficient of determination (r2
) that
shows the amount of change in one variable is accounted by the second variable.
Correlation can be used as selection criteria in animal breeding if it is positive so decide up to what level the
variables are used in an experiment.
Example: From a research which is conducted in Horro Guduru Wollega Goats, the following weight and
heart girth data are taken. Calculate linear correlation coefficient and coefficient of determination.
Heart girth (x) Body weight (y) XiYi
70 25 1750
67 22 1474
73 32 2336
73 32 2336
65 20 1300
74 31 2294
73 31 2263
68 27 1836
Total ∑ Xi =563 ∑ Yi = 220 ∑XiYi = 15,589
Mean X-
= 70.4 y-
=27.5
100.
Solution
SSX =∑xi2
– (∑ xi)2
= [(70)2
+ (67)2
+--- (68)2
] – (563)2
= 39701-39621.13 =79.87
n 8
SSY = =∑ Yi2
– (∑ Yi)2
= [(25)2
+ (22)2
+--- (27)2
] – (220)2
= 6208 -6050 =158
n 8
Cov XY = ∑XiYi – (∑Xi∑Yi)= [1750 +1474+---1836] – (563x220) = 15589-15482.5 = 106.5
n 8
rXY (correlation coefficient) = Cov XY = 106.5 = 106.5 = 0.95
√SSX*SSY √79.87*158 112.34
r2
(coefficient of determination) = 0.952
= 0.8988 = 89.88%. This shows that
the relation between heart girth(x) and body weight(y) variable is 89.88%.
101.
Regression analysis
Itis often of interest to determine how changes of values of some variables influence the change
of values of other variables.
For example, how alteration of air temperature affects feed intake, or how increasing the protein
level in a feed affects daily gain.
In both the first and the second example, the relationship between variables can be described
with a function, a function of temperature to describe feed intake, or a function of protein level
to describe daily gain.
A function that explains such relationships is called a regression function and analysis of such
problems and estimation of the regression function is called regression analysis.
Regression includes a set of procedures designed to study statistical relationships among
variables in a way in which one variable is defined as dependent upon others defined as
independent variables.
102.
By usingregression, the cause-consequence relationship between
the independent and dependent variables can be determined.
In the examples above, feed intake and daily gain are dependent
variables, and temperature and protein level are independent
variables.
Regression analysis describes the effect of one or more variables
(designated as independent) on a single variable (designated as
the dependent variable) by expressing the latter as a function of
the former.
103.
For thisanalysis, it is important to clearly distinguish between the dependent and
independent variable.
The regression analysis tells us the cause and effect or the magnitude of relationship
between variables in an experiment.
The regression procedures can be classified according to the number of variables
involved and the form of the functional relationship between variables involved in the
experiment.
The procedures is termed simple if only two variables are involved and multiple,
otherwise.
The procedure is termed linear if the form of the underlying relationship is linear and
non-linear, otherwise.
104.
Thus, regression analysiscan be classified into four types.
1.Simple linear regression
2.Multiple linear regression
3.Simple non linear regression
4.Multiple non linear regression
The functional form of the linear relationship between a dependent variable Y and an
independent variable X is represented by the equation: Y= œ + βX, where œ is the
intercept of the line on the Y axis and β is the linear regression coefficient, is the slope of
the line or the amount of change in Y for each unit change in X.
where there is more than one independent variable, so k independent variables (X1, X2,
X3,---Xk), the simple linear functional form of the equation Y= œ + βX can be extended to
the multiple linear functional form of Y = œ + β1X1+ β2X2 +----+ βkXk, where œ is the
intercept (the value of Y where all X’s are zero) and βi (i =1---k), is the regression
coefficient associated with independent variable Xi, represents the amount of change in Y
for each unit change in Xi.
105.
The twomain applications of regression analysis are:
1. Estimation of a function of dependency between variables
2. Prediction of future measurements or means of the dependent variable using new measurements of the
independent variable(s).
Example: From a research which is conducted in Horro Guduru Wollega Goats, the
following weight and heart girth data are taken.
Heart girth (x) Body weight (x) XiYi
70 25 1750
67 22 1474
73 32 2336
73 32 2336
65 20 1300
74 31 2294
73 31 2263
68 27 1836
Total ∑Xi =563 ∑Yi = 220 ∑XiYi = 15,589
Mean X-
= 70.4 y-
=27.5
106.
Solution
SSX =∑ xi2
–(∑ xi)2
= [(70)2
+ (67)2
+--- (68)2
] – (563)2
= 39701-39621.13 =79.87
n 8
SSY = =∑ Yi2
– (∑ Yi)2
= [(25)2
+ (22)2
+--- (27)2
] – (220)2
= 6208 -6050 =158
n 8
Cov XY = ∑XiYi – (∑Xi∑Yi)= [1750 +1474+---1836] – (563x220) = 15589-15482.5 = 106.5
n 8
b = Cov XY/SSx = 106.5/79.87 = 1.33
Y = a + bx
a = y-
-b X-
= 27.5- (1.33 x 70.4) = 27.5 – 93.87 = -66.37
Y = -66.37 + 1.33x
Body weight = -66.37 + 1.33(heart girth)
107.
CHAPTER 7
SAMPLING TECHNIQUES
Many professions (business, government, engineering, science, social research, agriculture,
etc.) seek the broadest possible factual basis for decision-making. In the absence of data on
the subject, a decision taken is just like leaping into the dark.
Sampling is a procedure, where in a fraction of the data is taken from a large set of data,
and the inference drawn from the sample is extended to whole group. The surveyor’s (a
person or a establishment in charge of collecting and recording data) or researchers initial
task is to formulate a rational justification for the use of sampling in his research. If
sampling is found appropriate for a research, the researcher, then:
(1) Identifies the target population as precisely as possible, and in a way that makes sense in
terms of the purpose of study.
(2) Puts together a list of the target population from which the sample will be selected. This
list is termed as a frame (more appropriately list frame) by many statisticians.
108.
(3) Selects thesample, and decide on a sampling technique, and;
(4) Makes an inference about the population.
All these four steps are interwoven and cannot be considered isolated from one another. Simple random
sampling, systematic sampling, stratified sampling fall into the category of simple sampling techniques.
Complex sampling techniques are used, only in the presence of large experimental data sets; when
efficiency is required; and, while making precise estimates about relatively small groups within large
populations .
Characteristics of Good Samples
Representative
Accessible
Low cost
SAMPLING TERMINOLOGY
A population is a group of experimental data, persons, etc. A population is built up of elementary units,
which cannot be further decomposed.
A group of elementary units is called a cluster.
Population Total is the sum of all the elements in the sample frame.
Population Mean is the average of all elements in a sample frame or population.
The fraction of the population or data selected in a sample is called the Sampling Fraction.
The reciprocal of the sampling fraction is called the Raising Factor.
109.
A sample,in which every unit has the same probability of selection, is called a random
sample.
If no repetitions are allowed, it is termed as a simple random sample selected without
replacement. If repetitions are permitted, the sample is selected with replacement.
PROBABILITY AND NON-PROBABILITY SAMPLING
Probability sampling, is a sampling process that utilizes some form of random selection.
In probability sampling, each unit is drawn with known probability or has a non-zero
chance of being selected in the sample. Such samples are usually selected with the help
of random numbers. With probability sampling, a measure of sampling variation can be
obtained objectively from the sample itself.
Non-probability sampling or judgment sampling depends on subjective judgment.
110.
The non-probabilitymethod of sampling is a process where probabilities cannot be
assigned to the units objectively, and hence it becomes difficult to determine the
reliability of the sample results in terms of probability. Examples of non-
probability sampling used extensively in 1920’s and 1930’s are the judgment
sample, quota sample, and the mail questionnaire.
In non-probability sampling, often, the surveyor selects a sample according to his
convenience, or generality in nature. Non-probability sampling is well suited for
exploratory research intended to generate new ideas that will be systematically
tested later. However, if the goal is to learn about a large population, it is
imperative to avoid judgment of non-probabilistic samples in survey research.
In contrast to probability sampling techniques, there is no way of knowing the
accuracy of a non-probabilistic sample estimate.
111.
SAMPLING ERRORS
Samplingerrors occur as a result of calculating the estimate (estimated mean, total, proportion,
etc) based on a sample rather than the entire population. This is due to the fact that the estimated
figure obtained from the sample may not be exactly equal to the true value of the population. For
example, if a sample of blocks is used to estimate the total number of persons in the city, and the
blocks in the sample are larger than the average — then this sample will overstate the true
population of the city.
When results from a sample survey are reported, they are often stated in the form “plus or minus”
of the respective units being used. This “plus or minus” reflects sampling errors. Salant and
Dilman, describe, that the statistics based on samples drawn from the same population always vary
from each other (and from the true population value) simply because of chance. This variation is
sampling error and the measure used to estimate the sampling error is the standard error.
se (p) = [(p q)/n] where, se (p) is the standard error of a proportion, p and q is the proportion of the sample
that do (p) and do not (q) have a particular characteristic, and n = the number of units in the sample.
112.
Standard errorsare usually used to quantify the precision of the estimates.
Sample distribution theory, points out that about 68 percentage of the estimates lie within one standard
error or standard deviation of the mean, 95 percentages lie within two standard deviations and all estimates
lie within three standard deviations.
Sampling errors can be minimized by proper selection of samples, and Salant and Dilman state ― “Three
factors affect sampling errors with respect to the design of samples – the sampling procedure, the variation
within the sample with respect to the variate of interest, and the size of the sample. Large sample results in
lesser sampling error.
NON-SAMPLING ERRORS
The accuracy of an estimate is also affected by errors arising from causes such as incomplete coverage and
faulty procedures of estimation, and together with observational errors, these make up what are termed non
sampling errors.
The aim of a survey is always to obtain information on the true population value. The idea is to get as close
as possible to the latter within the resources available for survey. The discrepancy between the survey
value and the corresponding true value is called the observational error or response error.
113.
Non-sampling errorsoccur as a result of improper records on the variate of interests,
careless reporting of the data, or deliberate modification of the data by the data collectors
and recorders to suit their interests. Non response error occurs when a significant
number of people in a survey sample are either absent; do not respond to the
questionnaire; or, are different from those who do in a way that is important to the study.
BIAS
Although judgment sampling is quicker than probability sampling, it is prone to
systematic errors. For example, if 20 books are to be selected from a total of 200 to
estimate the average number of pages in a book, a surveyor might suggest picking out
those books which appear to be of average size.
The difficulty with such a procedure is that consciously or unconsciously, the sampler
will tend to make errors of judgment in the same direction by selecting most of the
books which are either bigger than the average of otherwise. Such systematic errors lead
to what are called biases.
114.
BASIC PROBABILISTIC SAMPLINGTECHNIQUES
SIMPLE RANDOM SAMPLING
Sample surveys deal with samples drawn from populations, and contain a finite number of N units. If
these units can all be distinguished from one another, the number of distinct samples of size n that can be
drawn from N units is given by the combinatorial formula-
Objective: To select n units out of N, such that each number of combinations has an equal chance of
being selected, i.e., each unit in any given population has the same probability of being selected in the
sample.
Procedure: Use a table random numbers, a computer random number generator, or a mechanical device to
select the sample.
Example Suppose there are N = 850 students in a school from which a sample of n = 10 students is to
be taken. The students are numbered from 1 to 850. Since our population runs into three digits we use
random numbers that contain three digits. All numbers exceeding 850 are ignored because they do not
correspond to any serial number in the population. In case the same number occurs again, the
repetition is ignored. Following these rules the following simple random sample of 10 students is
obtained when columns 31 and 32 of the random numbers given in Appendix 1 are used.
251 546 214 495 074 800 407 502 513 628
115.
Remark: Ifrepetitions are included, the procedure is termed as selecting a sample
with replacements. In the present example the sample is selected without
replacement.
SYSTEMATIC SAMPLING
Systematic sampling is a little bit different from simple random sampling.
Suppose that N units of the population are numbered 1 to N in some order.
To select a sample of n units, we must take a unit at random from the first k
units and every kth unit thereafter.
Procedure:
1. Number the units in population from 1 to N
2. Decide on the n (sample size) that is required
3. Select an interval size k = N/n
4. Randomly select an integer between 1 to k
5. Finally, take every kth unit
116.
Let's assumethat we have a population that only has N=100 people in it and that you
want to take a sample of n=20. To use systematic sampling, the population must be listed
in a random order. The sampling fraction would be n/N = 20/100 = 20%. In this case, the
interval size, k, is equal to N/n = 100/20 = 5. Now, select a random integer from 1 to 5.
In our example, imagine that you chose 4. Now, to select the sample, start with the 4th
unit in the list and take every k-th unit (every 5th, because k=5). You would be sampling
units 4, 9, 14, 19, and so on to 100 and you would wind up with 20 units in your sample.
In order for systematic sampling to work, it is essential that the units in the population be
randomly ordered, at least with respect to the characteristics you are measuring.
Systematic sampling is fairly easy to do and is widely used for its convenience and time
efficiency. In many surveys, it is found to provide more precise estimates than simple
random sampling. This happens when there is a trend present in the list with respect to
the characteristic of interest.
117.
Systematic samplingis at its worst, when there is periodicity in the sampled data and the
sampling interval has fallen in line with it. When this happens, most of the units in the
sample will be either too high or low, which makes the estimate very variable.
STRATIFIED SAMPLING
It involves dividing the population into homogeneous non-overlapping groups (i.e.,
strata), selecting a sample from each group, and conducting a simple random sample in
each stratum.
On the basis of information available from a frame, units are allocated to strata by
placing within the same stratum, those units which are more-or-less similar with respect
to the characteristics being measured. If this can be reasonably achieved, the strata will
become homogenous, i.e., the unit-to-unit variability within a stratum will be small.
Surveyors use various different sample allocation techniques to distribute the samples in
the strata.
118.
In proportionalallocation, the sample size in a stratum is made proportional to the
number of units in the stratum. In equal allocation, the same number of units is taken
from each stratum irrespective of the size of the stratum.
CLUSTER SAMPLING
The smallest units into which a population can be divided are called the elements of the
population, and groups of elements, the clusters.
The problem with random sampling methods when sampling a population that's
distributed across a wide geographic region lies in covering a lot of ground
geographically in order to get to each of the units sampled. This geographic trotting to
collect samples is an expensive affair. But, without taking samples from across the whole
geographic population, it may become difficult to conclude anything affirmatively about
the population. The impasse is to determine the best size of the cluster for a specified cost
of the survey. This predicament can be solved if the cost of the survey and the variance of
the estimate can be expressed as functions of the size of the cluster.
119.
Cluster samplingincludes:
1. Divide population into clusters
2. Randomly sample clusters
3. Measure all units within sampled clusters
Cluster sampling is ordinarily conducted in order to reduce costs. The variance of
the estimate of the mean in simple random sampling of clusters depends on the
sample size, the population variance and on the correlation of the variate of
interest between units within the same cluster.
If the units within a cluster are more similar than units belonging to different
clusters, the estimator is subject to a larger variance; thus the smaller the intra-
cluster correlation, the better.
120.
MULTISTAGE SAMPLING
Multistagesampling involves, combining various probability techniques in the most
efficient and effective manner possible. The process of estimation is carried out stage
by stage, using the most appropriate methods of estimation at each stage.
Quite often, auxiliary information is used to improve the precision of an estimate. But,
in the absence of auxiliary information, it may be advantageous to conduct the enquiry
in two phases. In the first phase, auxiliary information is collected on the variate of a
fairly large sample. Then a sub-sample is taken, and information collected on the
variate of interest. Then the two samples are used in the best possible manner to
produce an estimate for the variate of interest. The procedure of first selecting clusters
and then choosing a specified number of elements from each selected cluster is known
as sub sampling. It is also known as two-stage sampling or double sampling.
The clusters, which form the units of sampling at the first stage, are called first stage
units, and the elements or group of elements within clusters, which form the units of
sampling at the second stage, are called sub-units or second-stage units. The procedure
can be easily generalized to three or more stages and hence known as multi-stage
sampling. Double sampling can be used to reduce the response bias in survey results.
121.
NON-PROBABILISTIC SAMPLING
ACCIDENTAL, HAPHAZARDOR CONVENIENCE SAMPLING
One of the most common methods of sampling goes under the various titles listed here. I
would include in this category the traditional "man on the street" (of course, now it's
probably the "person on the street") interviews conducted frequently by television news
programs to get a quick (although non representative) reading of public opinion. I would
also argue that the typical use of college students in much psychological research is
primarily a matter of convenience. (You don't really believe that psychologists use
college students because they believe they're representative of the population at large, do
you?).
In clinical practice, we might use clients who are available to us as our sample.
In many research contexts, we sample simply by asking for volunteers. Clearly, the
problem with all of these types of samples is that we have no evidence that they are
representative of the populations we're interested in generalizing to -- and in many cases
we would clearly suspect that they are not.
122.
PURPOSIVE SAMPLING
Inpurposive sampling, sampling is done with a purpose in mind. We usually would have one or more
specific predefined groups we are seeking. For instance, have you ever run into people in a mall or on
the street who are carrying a clipboard and who are stopping various people and asking if they could
interview them? Most likely they are conducting a purposive sample (and most likely they are
engaged in market research). They might be looking for Caucasian females between 30-40 years old.
They size up the people passing by and anyone who looks to be in that category they stop to ask if
they will participate. One of the first things they're likely to do is verify that the respondent does in
fact meet the criteria for being in the sample.
Purposive sampling can be very useful for situations where you need to reach a targeted sample quickly and where
sampling for proportionality is not the primary concern. With a purposive sample, you are likely to get the opinions of
your target population, but you are also likely to overweight subgroups in your population that are more readily
accessible.
All of the methods that follow can be considered as sub-categories of purposive
sampling methods. We might sample for specific groups or types of people as in modal
instance, expert, or quota sampling. We might sample for diversity as in heterogeneity
sampling. Or, we might capitalize on informal social networks to identify specific
respondents who are hard to locate otherwise, as in snowball sampling. In all of these
methods we know what we want -- we are sampling with a purpose.
123.
1. MODAL INSTANCESAMPLING
In statistics, the mode is the most frequently occurring value in a distribution. In sampling, when we do a
modal instance sample, we are sampling the most frequent case, or the "typical" case. In a lot of informal
public opinion polls, for instance, they interview a "typical" voter. There are a number of problems with
this sampling approach. First, how do we know what the "typical" or "modal" case is? We could say that
the modal voter is a person who is of average age, educational level, and income in the population. But,
it's not clear that using the averages of these is the fairest (consider the skewed distribution of income, for
instance). And, how do you know that those three variables -- age, education, income -- are the only or
event the most relevant for classifying the typical voter? What if religion or ethnicity is an important
discriminator? Clearly, modal instance sampling is only sensible for informal sampling contexts.
2. EXPERT SAMPLING
Expert sampling involves the assembling of a sample of persons with known or demonstrable experience
and expertise in some area. Often, we convene such a sample under the auspices of a "panel of experts."
There are actually two reasons you might do expert sampling. First, because it would be the best way to
elicit the views of persons who have specific expertise. In this case, expert sampling is essentially just a
specific sub case of purposive sampling. But the other reason you might use expert sampling is to provide
evidence for the validity of another sampling approach you've chosen.
124.
3. QUOTA SAMPLING
In quota sampling, you select people non-randomly according to some fixed quota. There are
two types of quota sampling: proportional and non proportional. In proportional quota
sampling you want to represent the major characteristics of the population by sampling a
proportional amount of each. For instance, if you know the population has 40% women and
60% men, and that you want a total sample size of 100, you will continue sampling until you
get those percentages and then you will stop. So, if you've already got the 40 women for your
sample, but not the sixty men, you will continue to sample men but even if legitimate women
respondents come along, you will not sample them because you have already "met your
quota." The problem here (as in much purposive sampling) is that you have to decide the
specific characteristics on which you will base the quota. Will it be by gender, age, education
race, religion, etc.?
4. NON-PROPORTIONAL QUOTA SAMPLING
It is a bit less restrictive. In this method, you specify the minimum number of sampled units
you want in each category. Here, you're not concerned with having numbers that match the
proportions in the population. Instead, you simply want to have enough to assure that you will
be able to talk about even small groups in the population.
This method is the non-probabilistic analogue of stratified random sampling in that it is
typically used to assure that smaller groups are adequately represented in your sample.
125.
5. HETEROGENEITY SAMPLING
We sample for heterogeneity when we want to include all opinions or views, and we aren't
concerned about representing these views proportionately. Another term for this is sampling for
diversity. In many brainstorming or nominal group processes (including concept mapping), we
would use some form of heterogeneity sampling because our primary interest is in getting
broad spectrum of ideas, not identifying the "average" or "modal instance" ones. In effect, what
we would like to be sampling is not people, but ideas. We imagine that there is a universe of all
possible ideas relevant to some topic and that we want to sample this population, not the
population of people who have the ideas. Clearly, in order to get all of the ideas, and
especially the "outlier" or unusual ones, we have to include a broad and diverse range of
participants. Heterogeneity sampling is, in this sense, almost the opposite of modal instance
sampling.
6. SNOWBALL SAMPLING
In snowball sampling, you begin by identifying someone who meets the criteria for inclusion in
your study. You then ask them to recommend others who they may know who also meet the
criteria. Although this method would hardly lead to representative samples, there are times
when it may be the best method available. Snowball sampling is especially useful when you are
trying to reach populations that are inaccessible or hard to find. For instance, if you are
studying the homeless, you are not likely to be able to find good lists of homeless people within
a specific geographical area. However, if you go to that area and identify one or two, you may
find that they know very well who the other homeless people in their vicinity are and how you
can find them.
126.
Inference
Two waysto make inference
Estimation of parameters
* Point Estimation (X or p)
* Intervals Estimation
Hypothesis Testing
Interpretation of
CI
Probabilistic Practical
Weare 100(1-)%
confident that the single
computed CI contains
In repeated sampling 100(1-
)% of all intervals around
sample means will in the
long run include
135.
Example (Sample size≥30)
Anepidemiologist studied the blood glucose
level of a random sample of 100 patients. The
mean was 170, with a SD of 10.
SE = 10/10 = 1
Then CI:
= 170 + 1.96 1 168.04 ≥ 171.96
95
%
= X + Z
SE
136.
In a surveyof 140 asthmatics, 35% had
allergy to house dust. Construct the 95% CI
for the population proportion.
= p + Z
0.35 – 1.96 0.04 ≥ 0.35 + 1.96 0.04
0.27 ≥ 0.43
27% ≥ 43%
Example (Proportion)
In a survey of 140 asthmatics, 35% had
allergy to house dust. Construct the 95% CI
for the population proportion.
= p + Z
0.35 – 1.96 0.04 ≥ 0.35 + 1.96 0.04
0.27 ≥ 0.43
27% ≥ 43%
P(1-p)
n 140
0.35(1-0.35) = 0.04
SE =
137.
Hypothesis testing
A statisticalmethod that uses sample
data to evaluate a hypothesis
about a population parameter. It
is intended to help researchers
differentiate between real and
random patterns in the data.
138.
An assumption
about thepopulation
parameter.
I assume the mean SBP of
participants is 120 mmHg
What is a Hypothesis?
139.
H0 NullHypothesis states the Assumption
to be tested e.g. SBP of participants = 120
(H0: 120).
H1 Alternative Hypothesis is the opposite of
the null hypothesis (SBP of participants ≠ 120
(H1: ≠ 120). It may or may not be accepted
and it is the hypothesis that is believed to
be true by the researcher
Null & Alternative Hypotheses
140.
Defines unlikelyvalues of sample statistic
if null hypothesis is true. Called rejection
region of sampling distribution
Typical values are 0.01, 0.05
Selected by the Researcher at the Start
Provides the Critical Value(s) of the Test
Level of Significance,
141.
Level of Significance,a and the Rejection Region
0
Critical
Value(s)
Rejection
Regions
142.
H0: Innocent
Jury TrialHypothesis Test
Actual Situation Actual Situation
Verdict Innocent Guilty Decision H0 True H0 False
Innocent Correct Error
Accept
H0 1 -
Type II
Error ( )
Guilty Error Correct
H0
Type I
Error
( )
Power
(1 - )
Result Possibilities
False
Negative
False
Positive
Reject
143.
True Valueof Population Parameter
Increases When Difference Between Hypothesized
Parameter & True Value Decreases
Significance Level
Increases When Decreases
Population Standard Deviation
Increases When Increases
Sample Size n
Increases When n Decreases
Factors Increasing
Type II Error
n
β
d
144.
Probability ofObtaining a Test Statistic
More Extreme or ) than Actual
Sample Value Given H0 Is True
Called Observed Level of Significance
Used to Make Rejection Decision
If p value Do Not Reject H0
If p value <, Reject H0
p Value Test
145.
State H0 H0: 120
State H1 H1 :
Choose = 0.05
Choose n n = 100
Choose Test: Z, t, X2
Test (or p Value)
Hypothesis Testing: Steps
Test the Assumption that the true mean SBP of
participants is 120 mmHg.
146.
Compute Test Statistic(or compute P value)
Search for Critical Value
Make Statistical Decision rule
Express Decision
Hypothesis Testing: Steps
147.
Assumptions
Populationis normally distributed
t test statistic
One sample-mean Test
n
s
x
t 0
error
standard
value
null
mean
sample
148.
Example Normal BodyTemperature
What is normal body temperature? Is it actually
37.6o
C (on average)?
State the null and alternative hypotheses
H0: = 37.6o
C
Ha: 37.6o
C
149.
Example Normal BodyTemp (cont)
n
s
x
t 0
error
standard
value
null
mean
sample
Data: random sample of n = 18 normal body temps
37.2 36.8 38.0 37.6 37.2 36.8 37.4 38.7 37.2
36.4 36.6 37.4 37.0 38.2 37.6 36.1 36.2 37.5
Variable n Mean SD SE t P
Temperature 18 37.22 0.68 0.161 2.38 0.029
Summarize data with a test statistic
Example Normal BodyTemp (cont)
Find the p-value
Df = n – 1 = 18 – 1 = 17
From SPSS: p-value = 0.029
From t Table: p-value is
between 0.05 and 0.01.
Area to left of t = -2.11 equals area
to right of t = +2.11.
The value t = 2.38 is between
column headings 2.110& 2.898 in
table, and for df =17, the p-values
-2.11 +2.11 t
152.
Example Normal BodyTemp (cont)
Decide whether or not the result is
statistically significant based on the p-value
Using = 0.05 as the level of significance criterion,
the results are statistically significant because 0.029
is less than 0.05. In other words, we can reject the
null hypothesis.
Report the Conclusion
We can conclude, based on these data, that the mean
temperature in the human population does not equal
37.6.
153.
Involves categoricalvariables
Fraction or % of population in a category
Sample proportion (p)
n
p
Z
)
1
(
One-sample test for proportion
size
sample
successes
of
number
n
X
p
Test is called Z test
where:
Z is computed value
π is proportion in population
(null hypothesis value)
Critical Values: 1.96 at α=0.05
2.58 at α=0.01
154.
Example
• In asurvey of diabetics in a large city, it was
found that 100 out of 400 have diabetic foot.
Can we conclude that 20 percent of diabetics in
the sampled population have diabetic foot.
• Test at the =0.05 significance level.
155.
Solution
Critical Value: 1.96
Decision:
Wehave sufficient evidence to
reject the Ho value of 20%
We conclude that in the
population of diabetic the
proportion who have diabetic foot
does not equal 0.20
Z
0
Reject Reject
.025
.025
= 2.50
Ho: π = 0.20
H1: π 0.20
Z =
0.25 – 0.20
0.20 (1- 0.20)
400
+1.96
-1.96


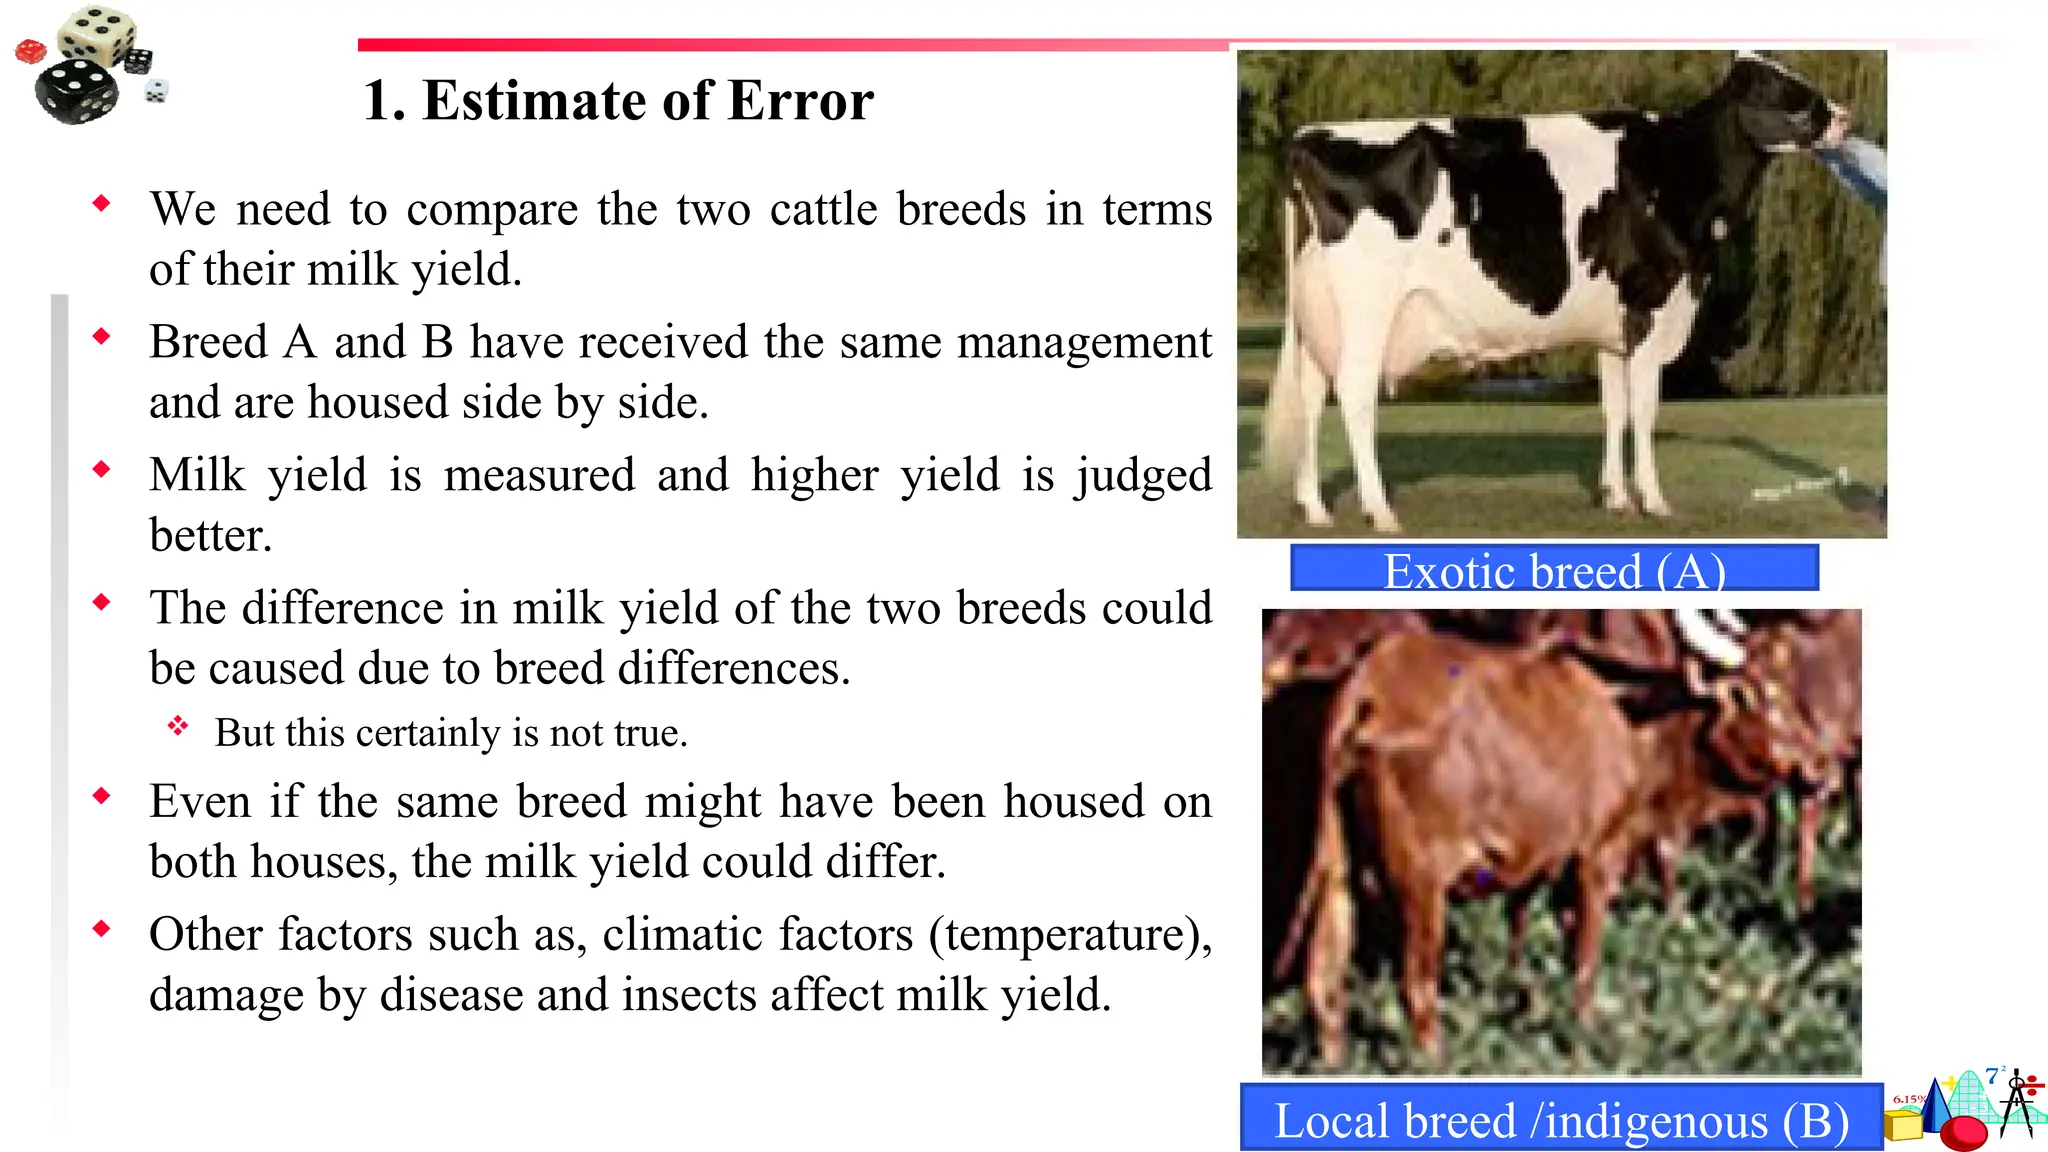


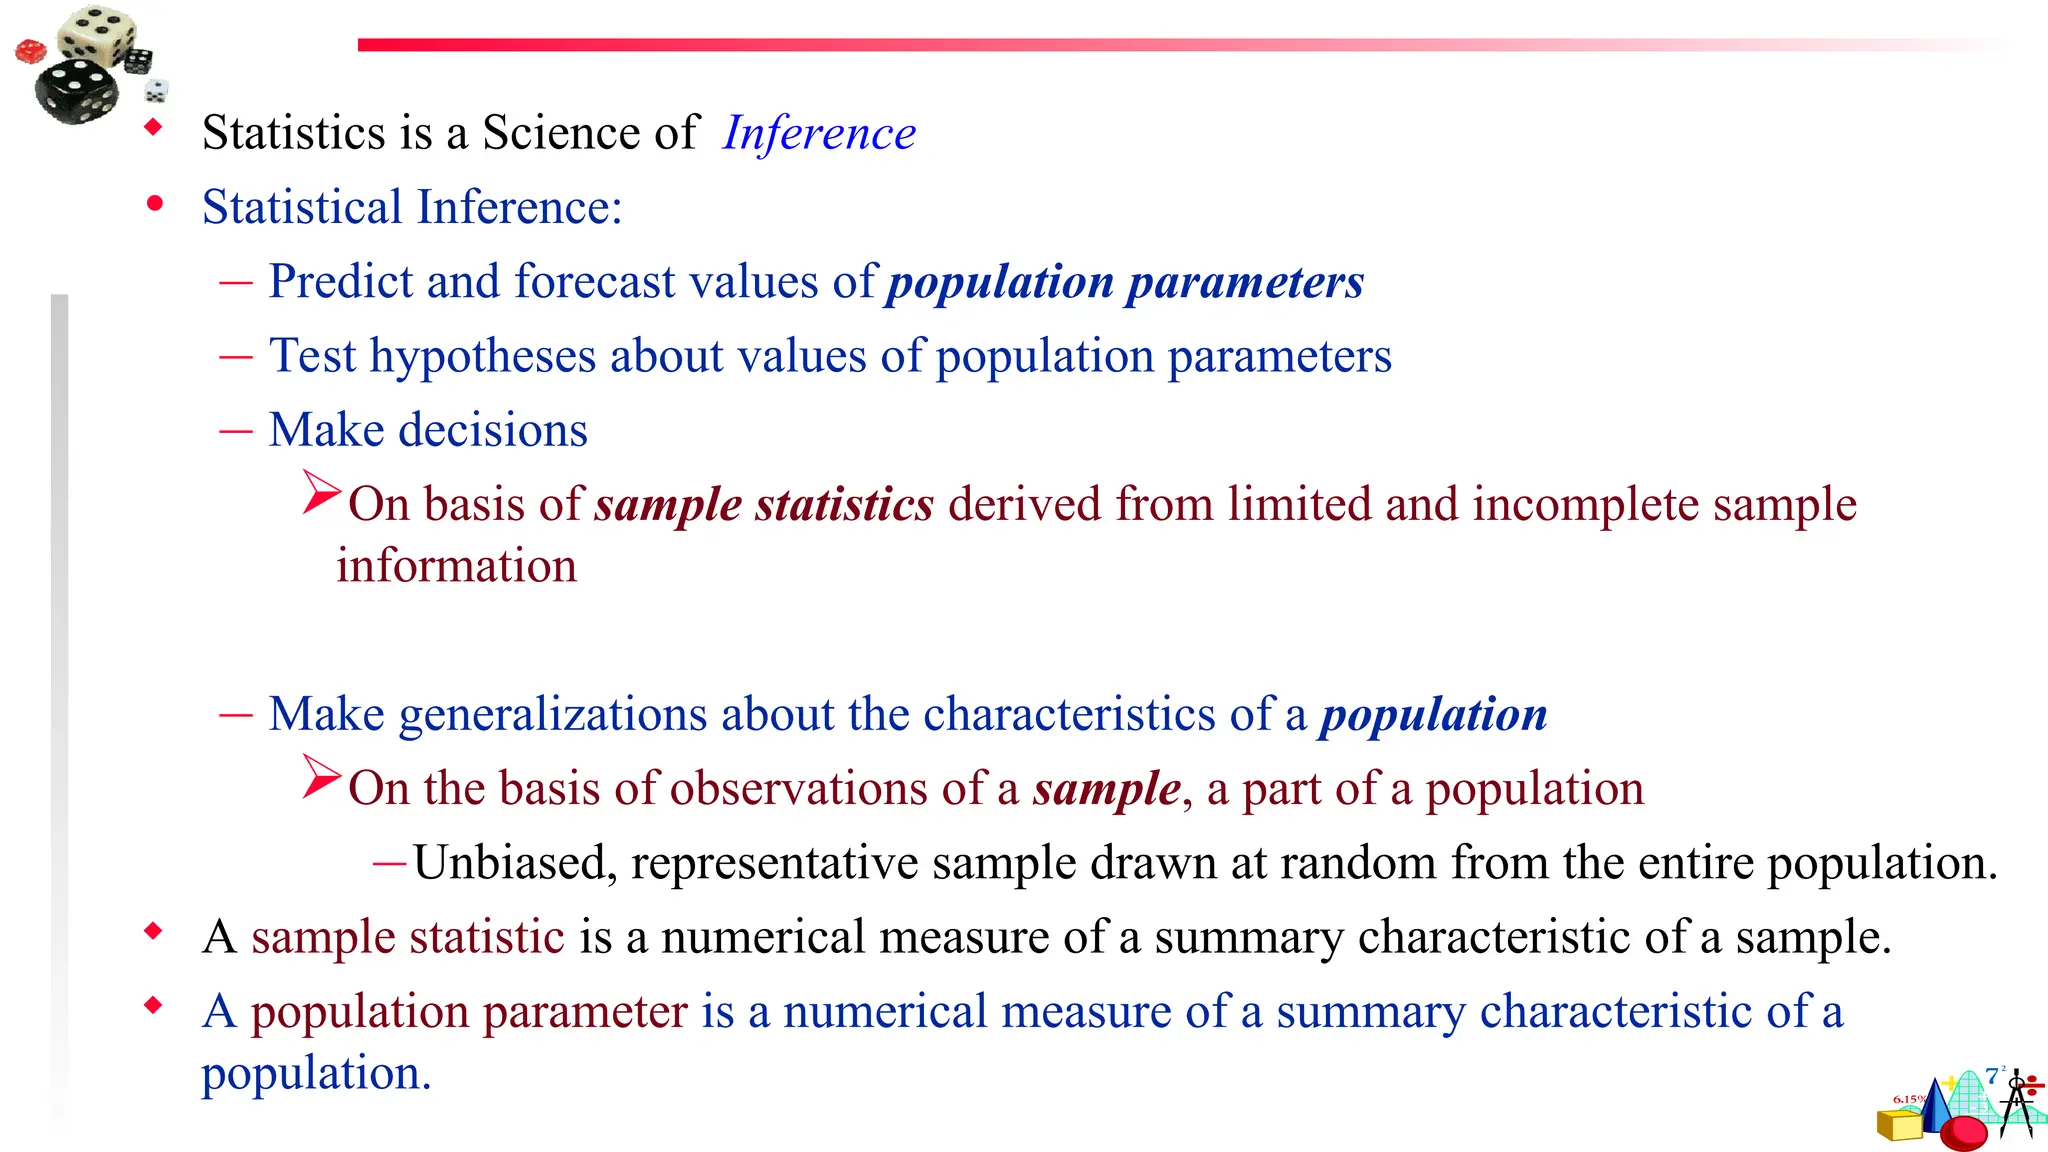
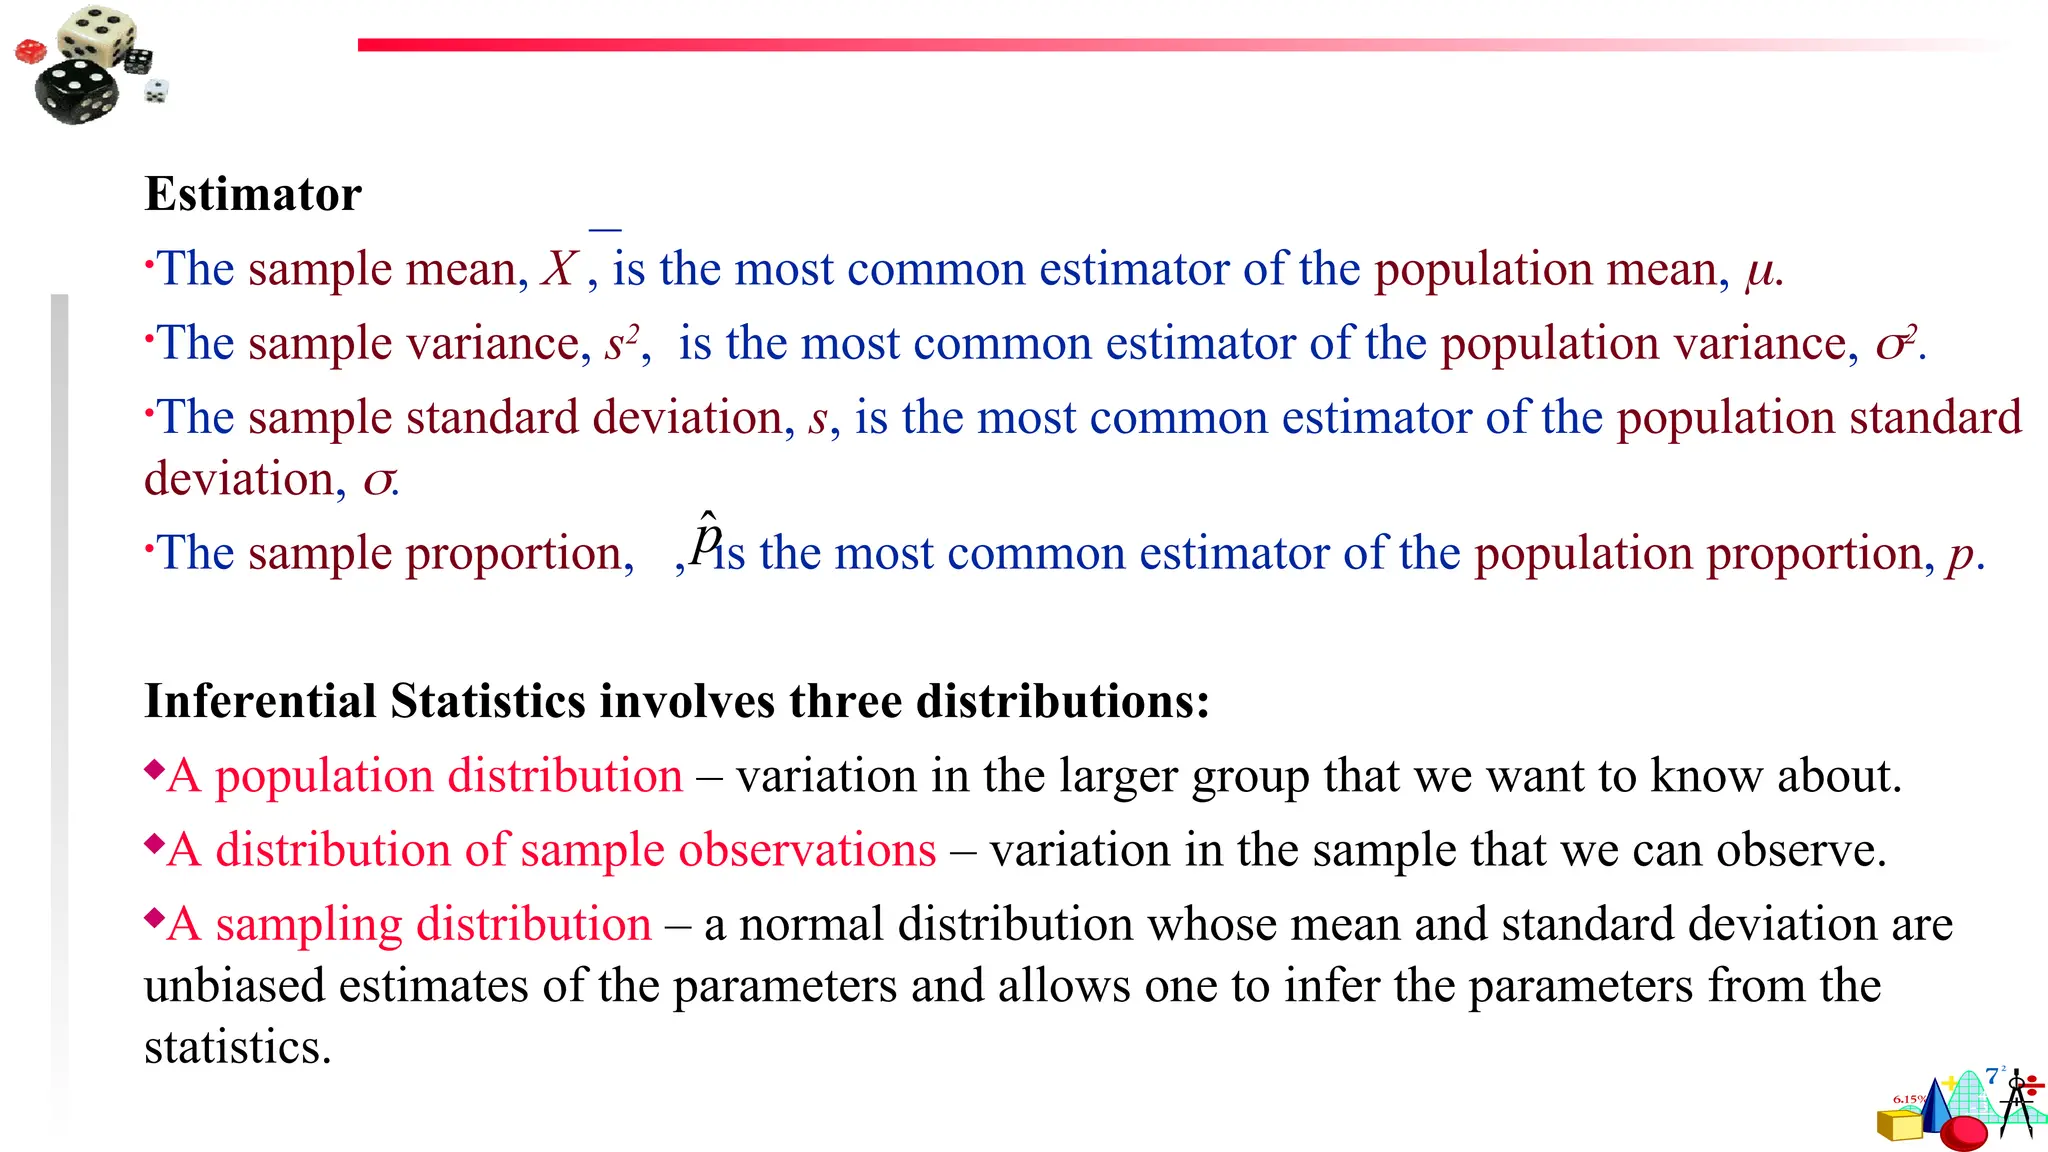
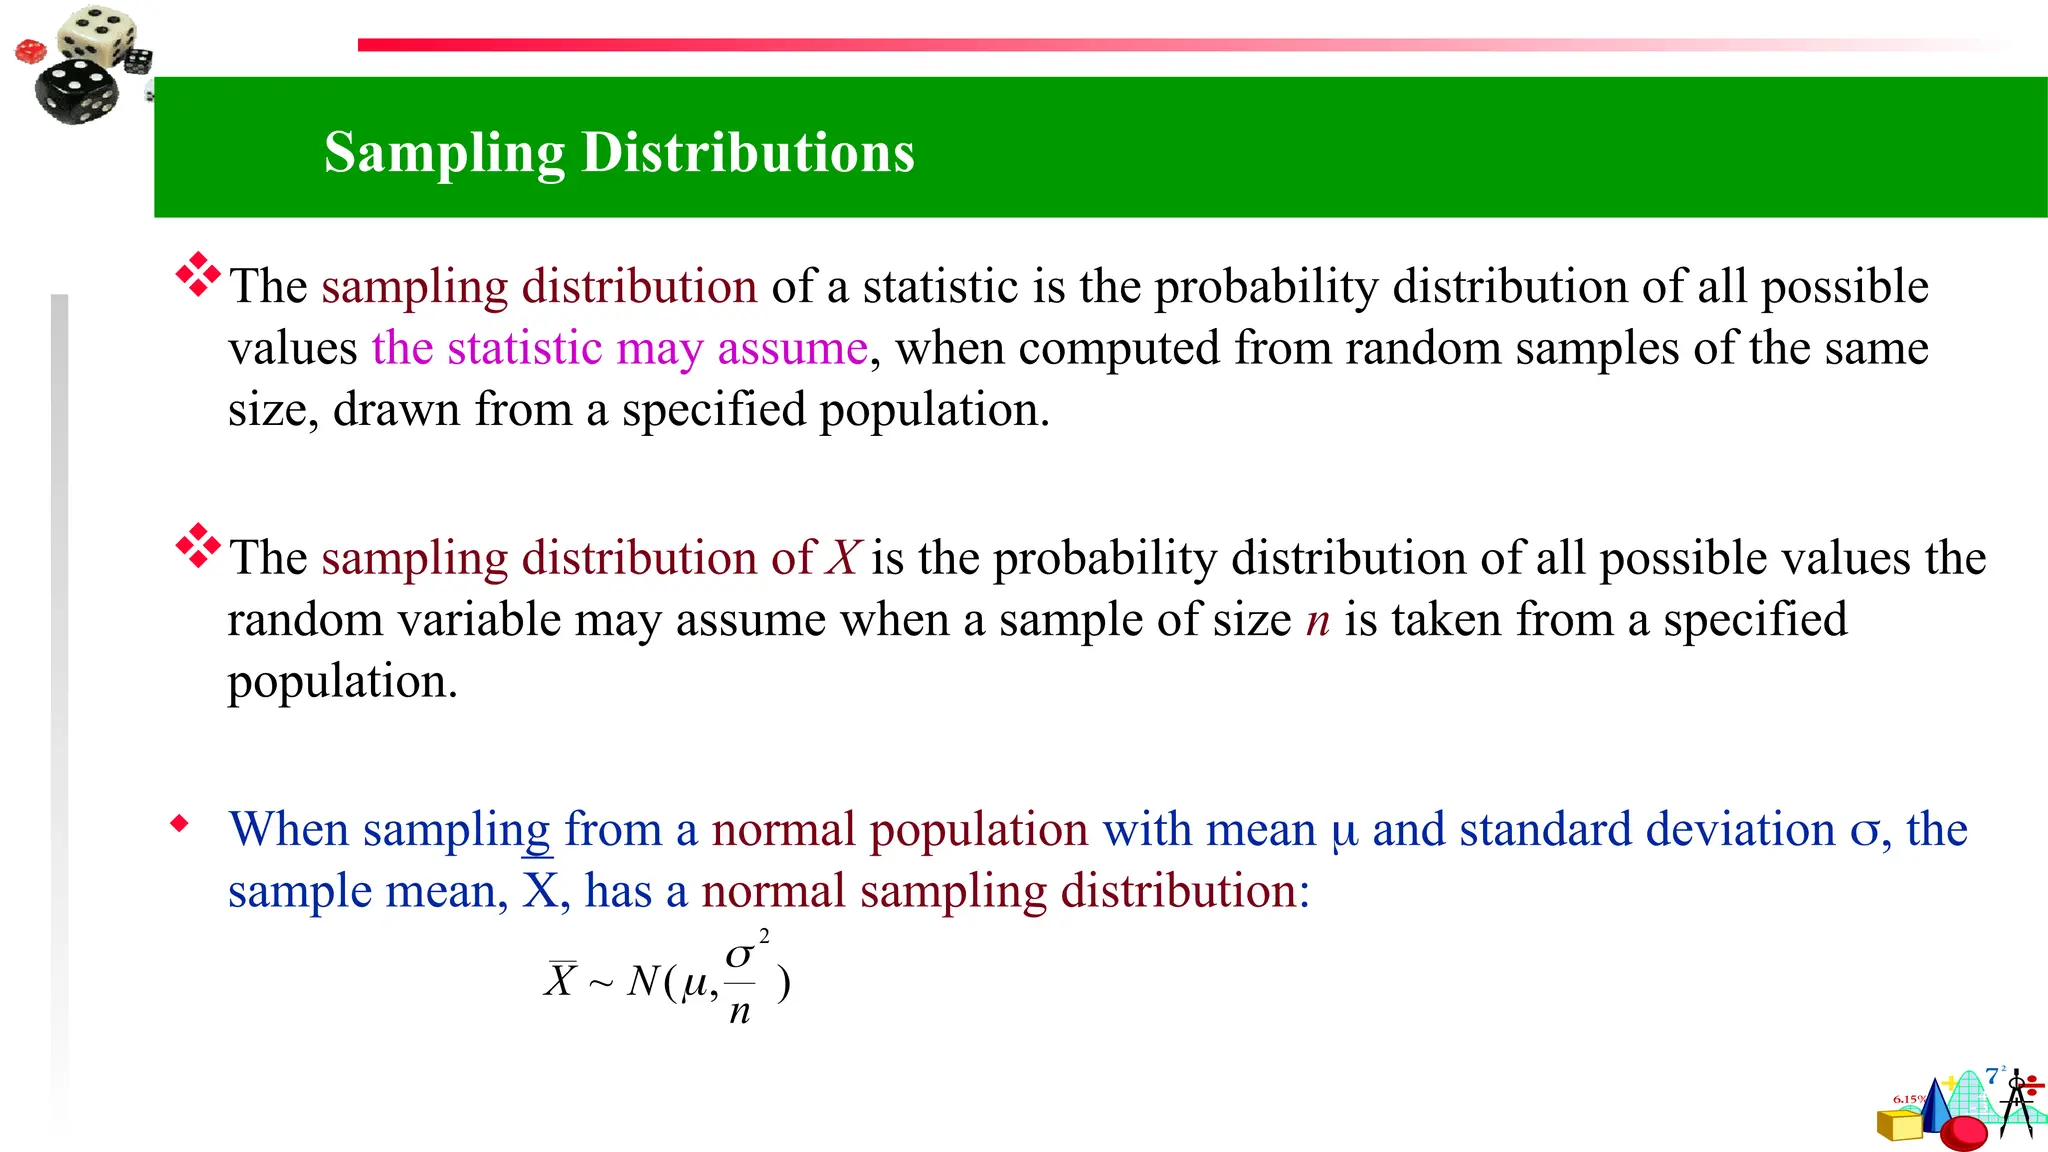
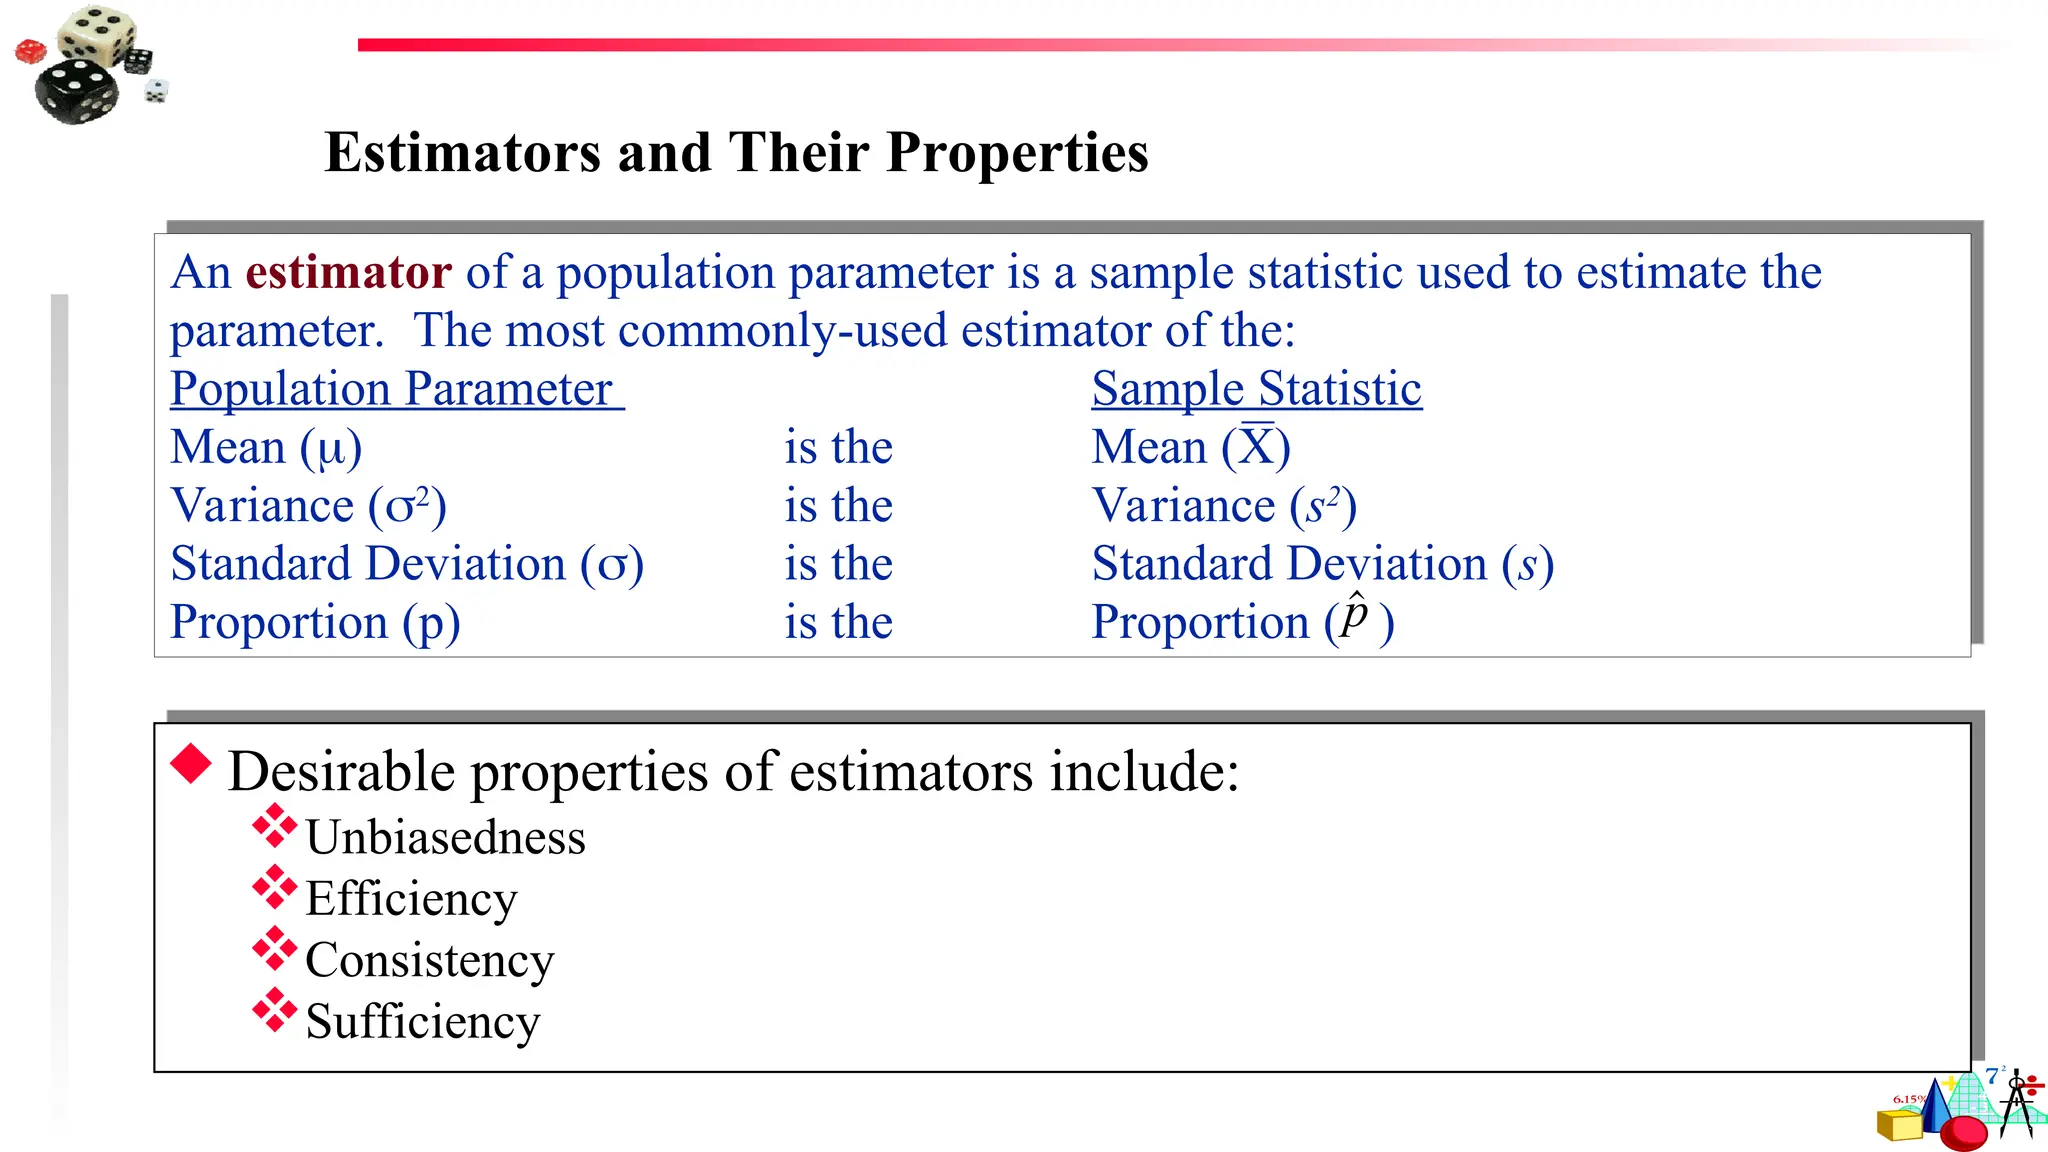


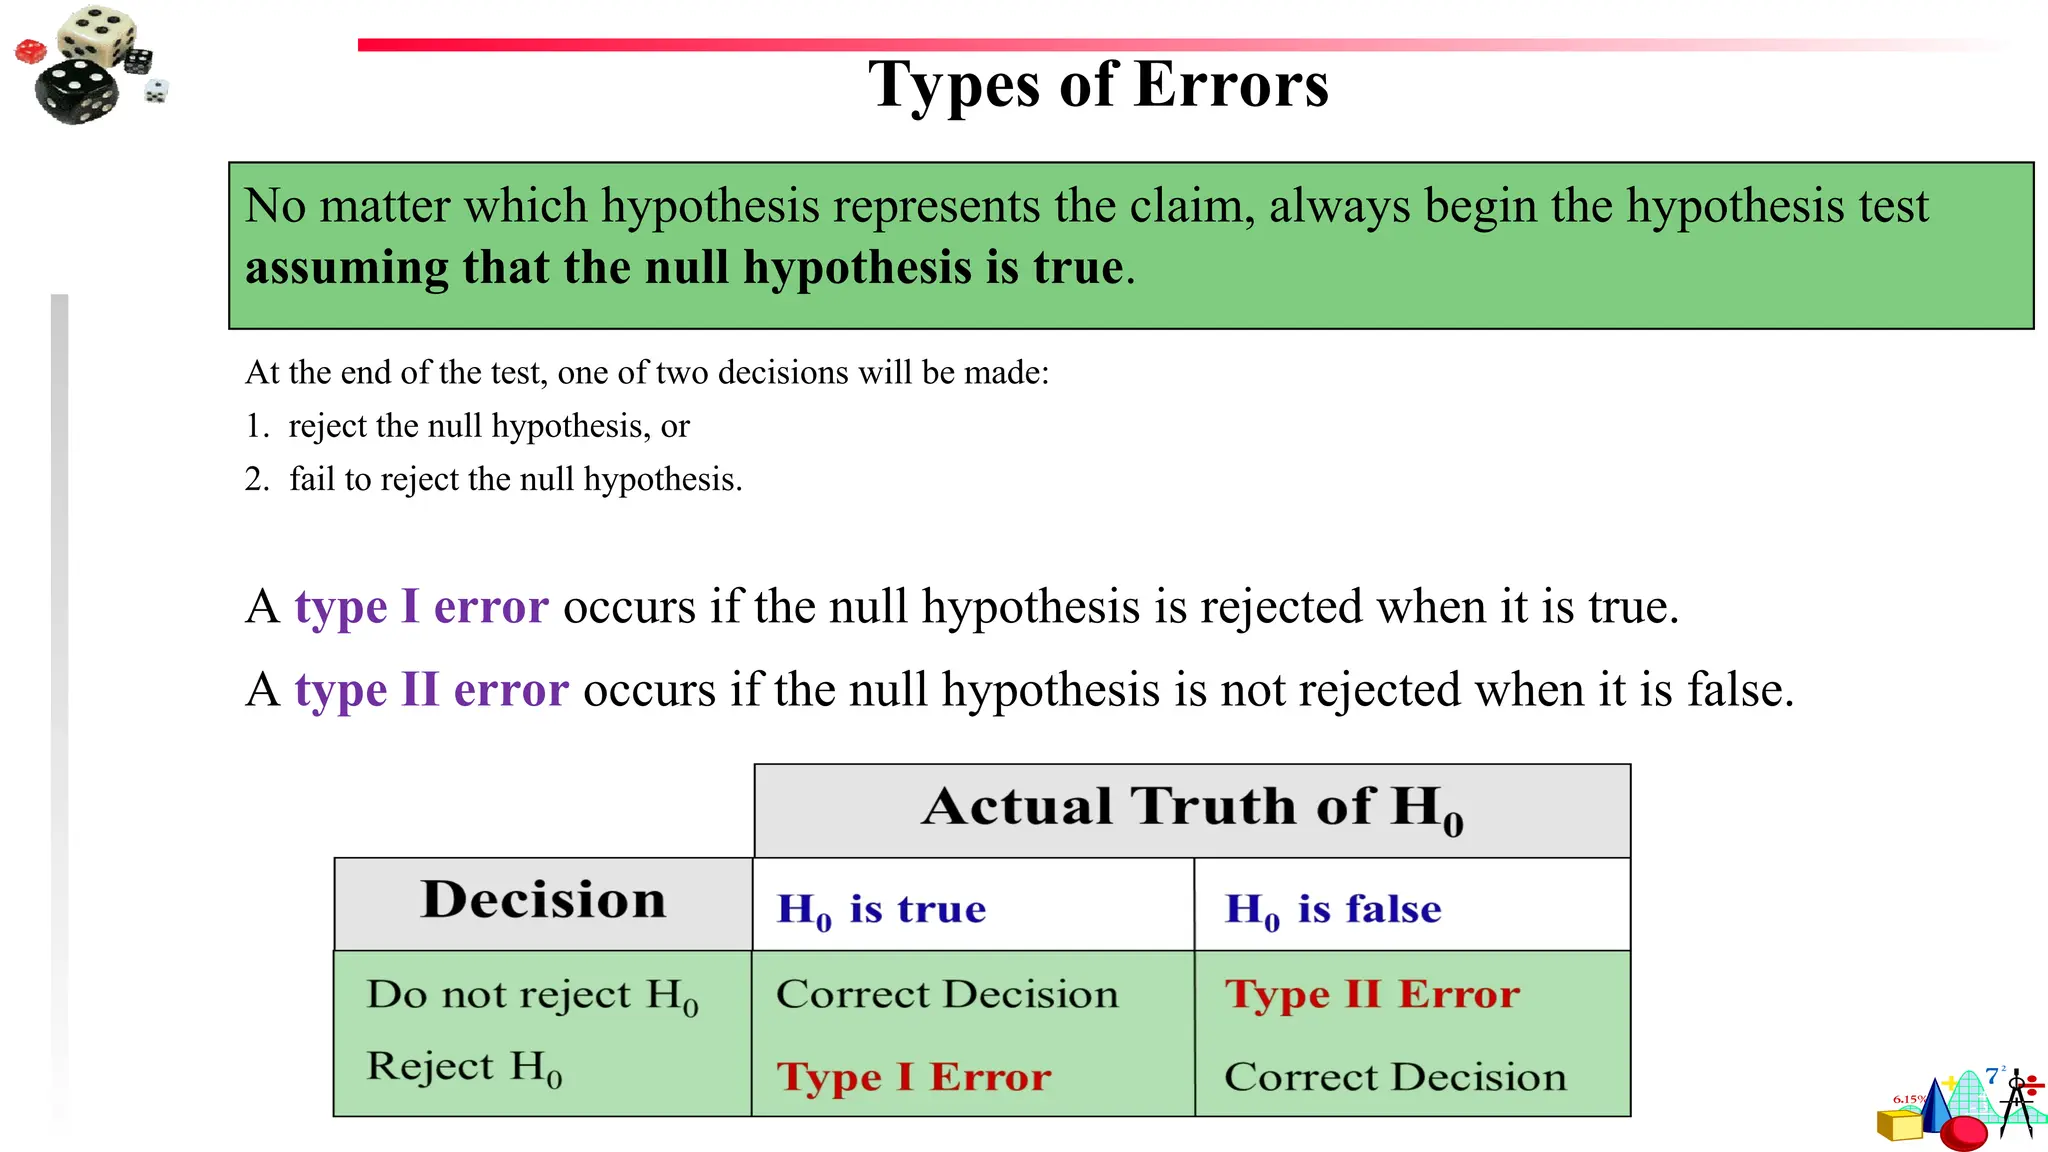
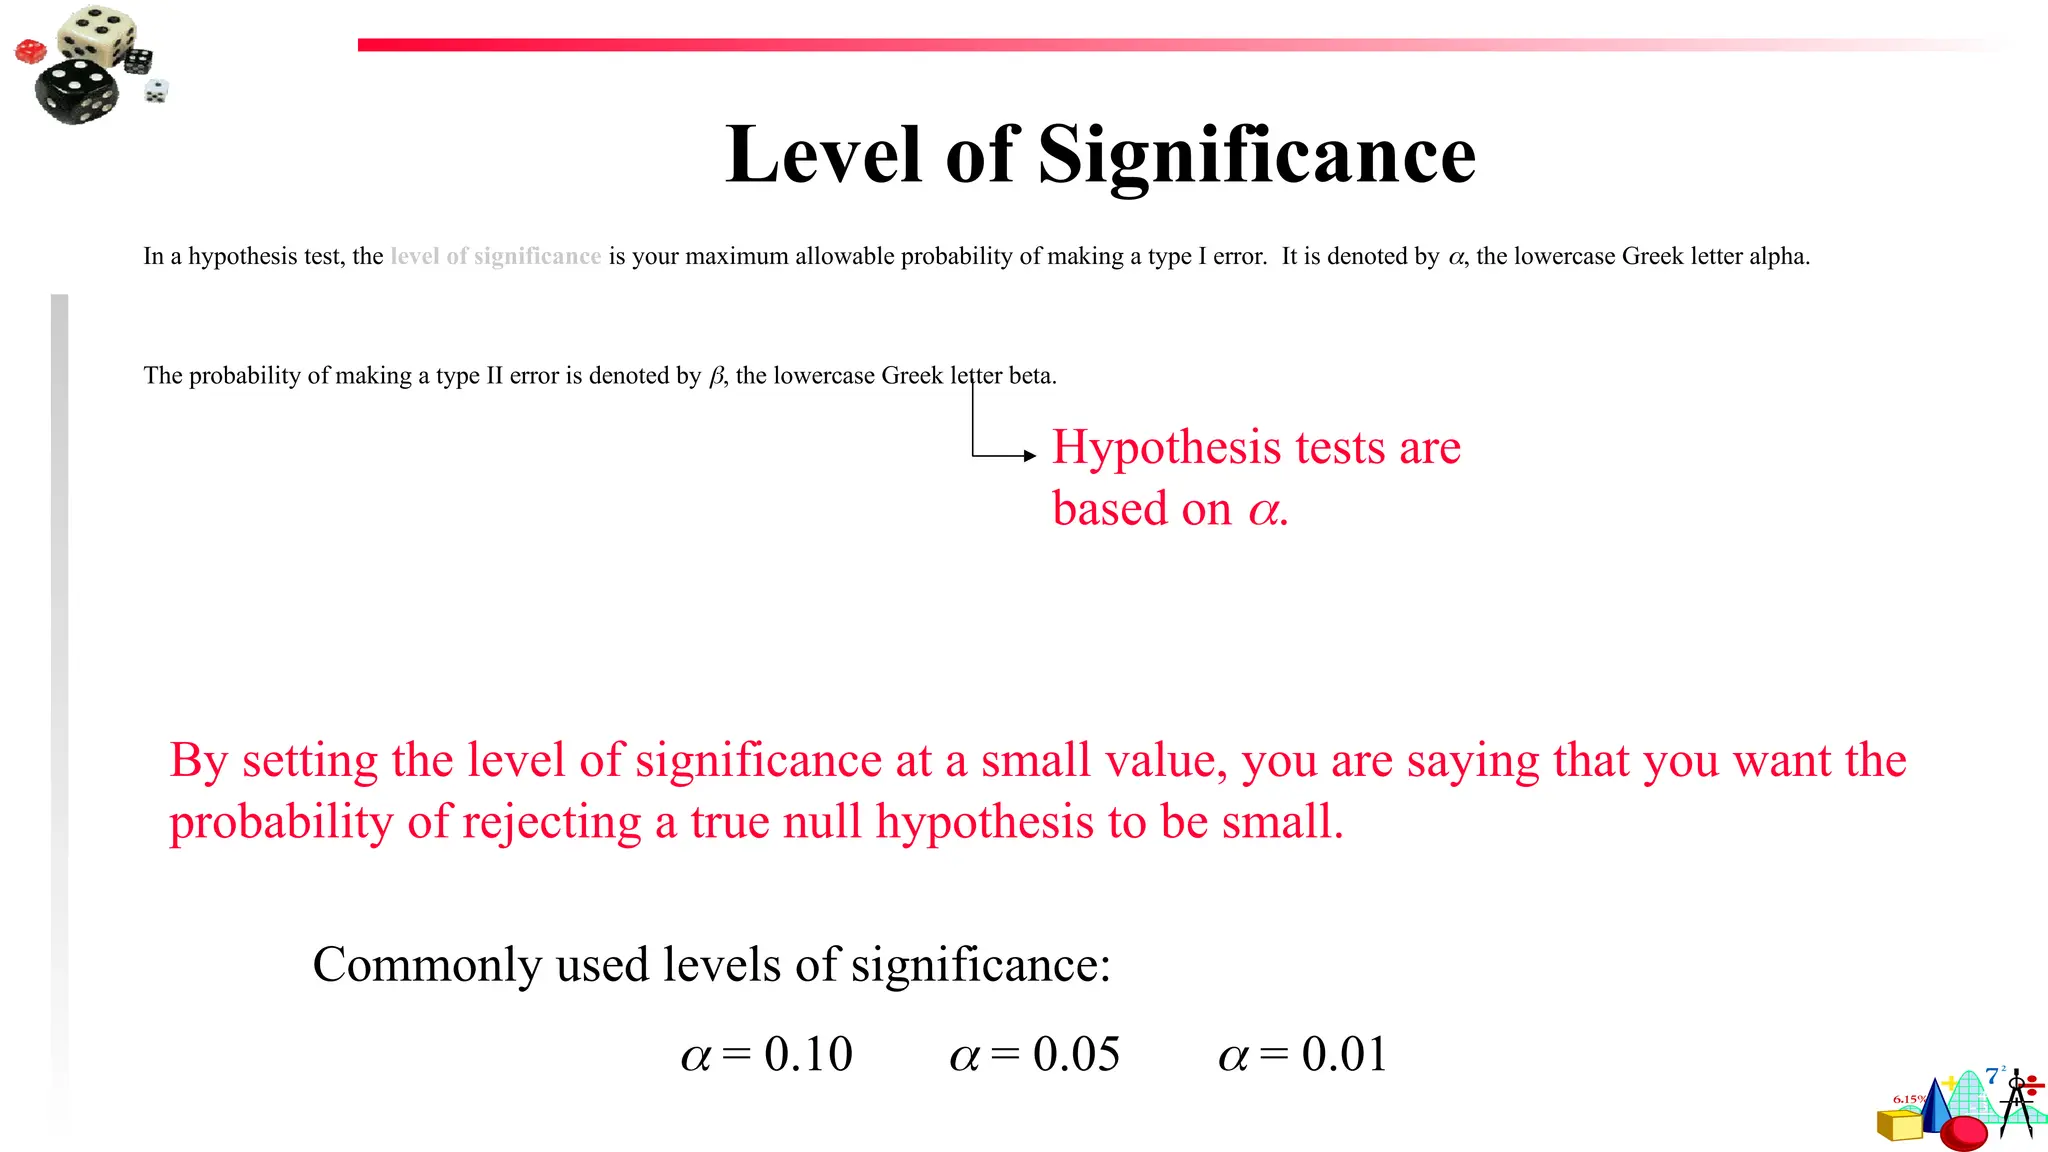
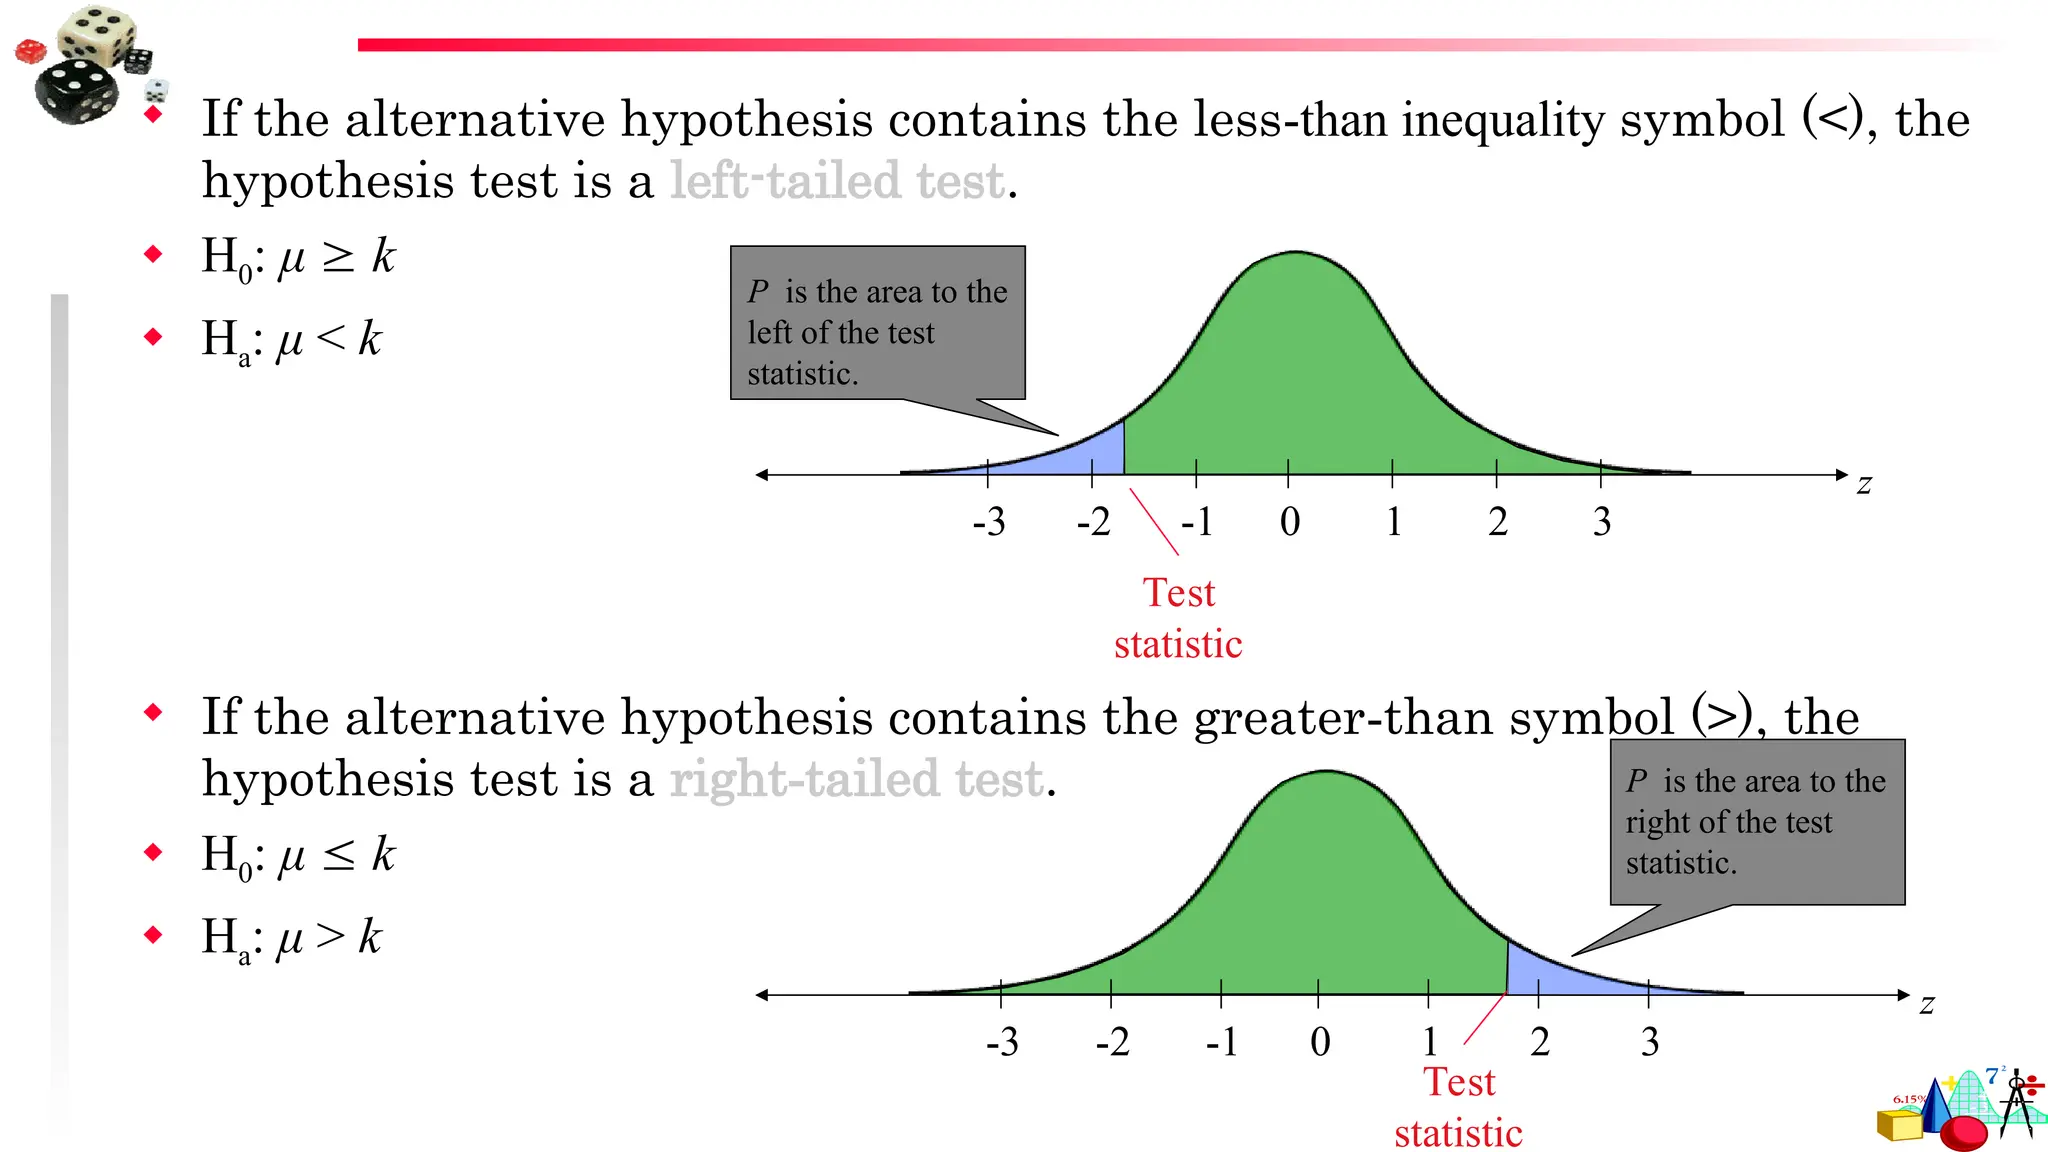
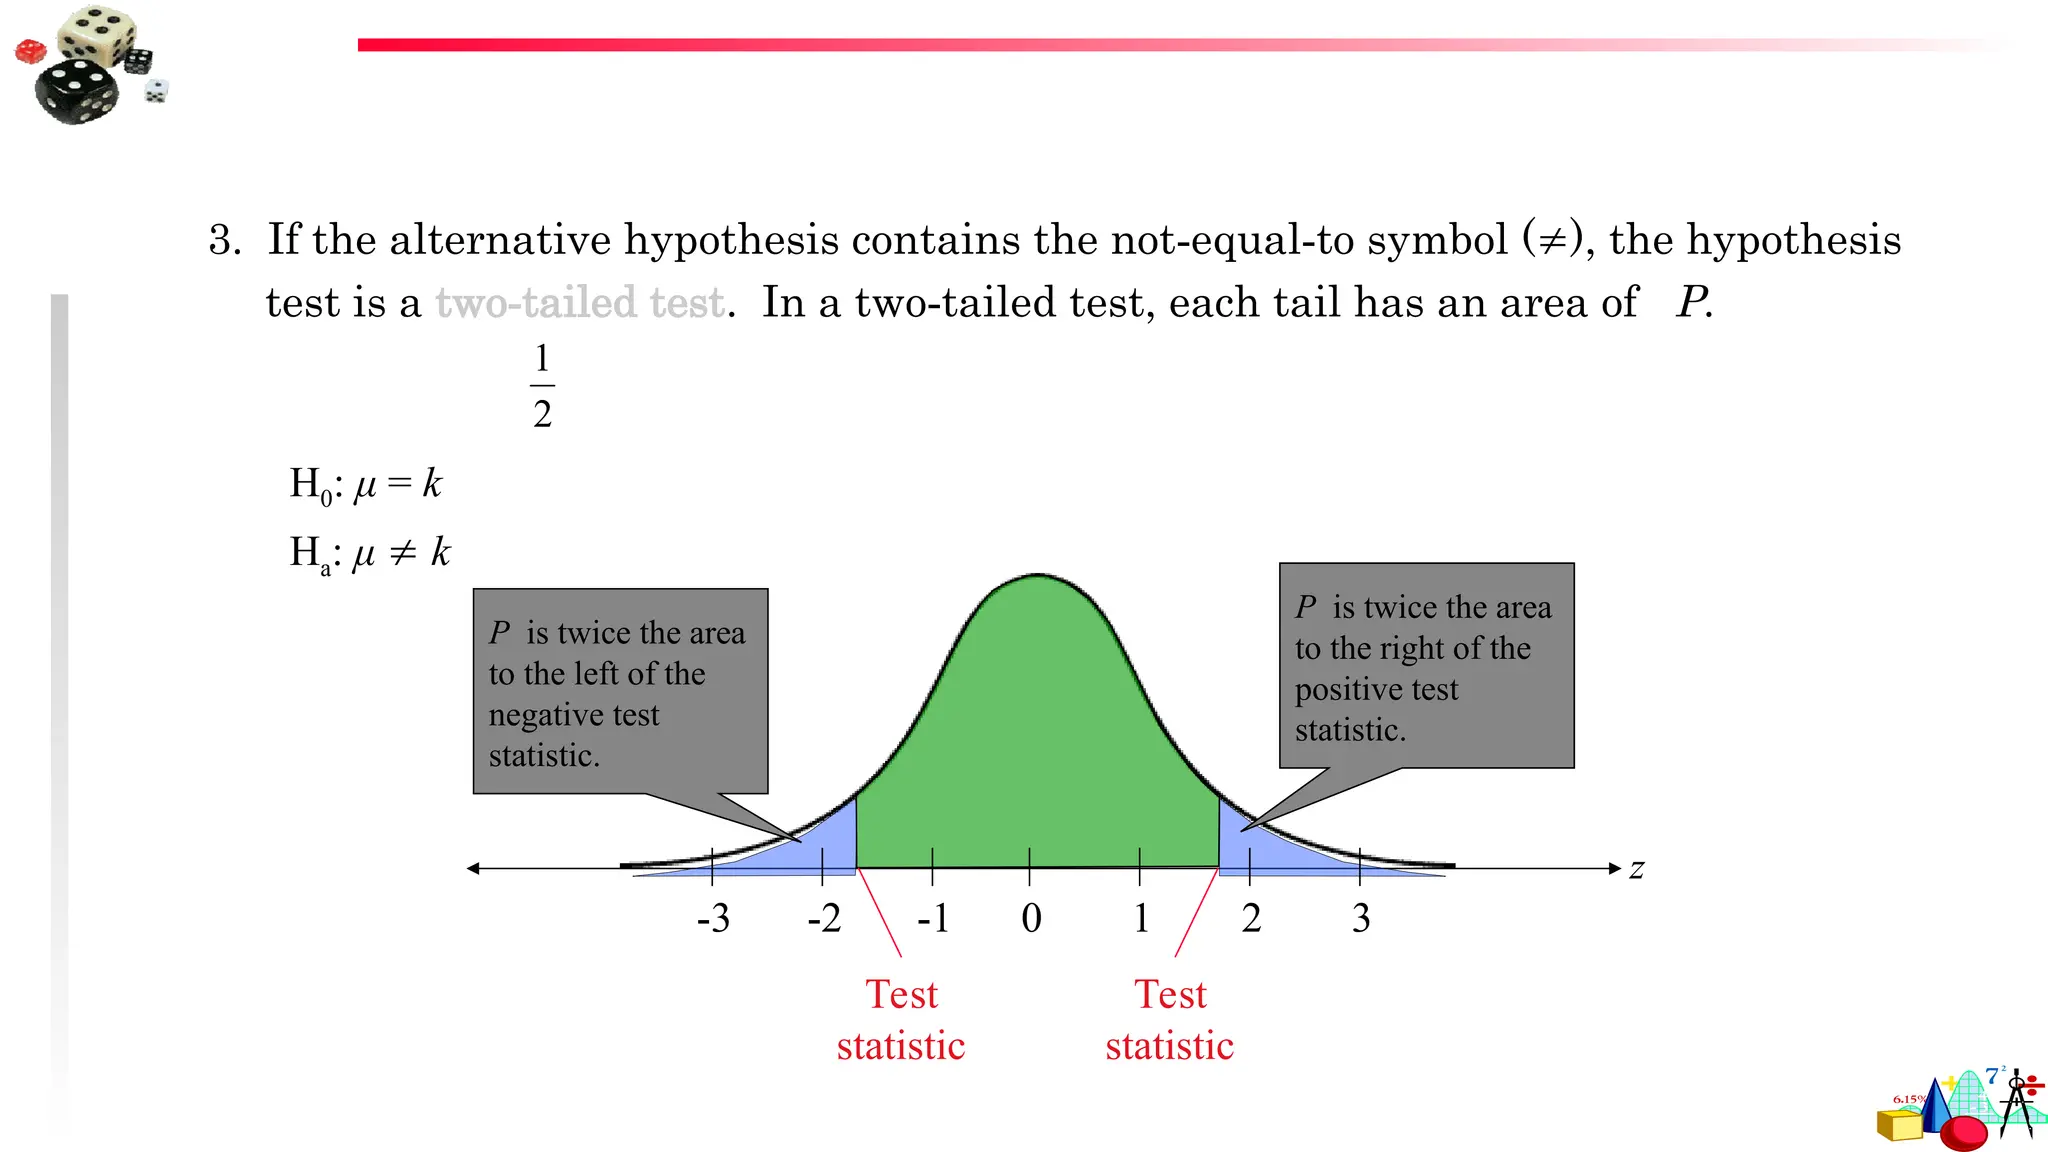
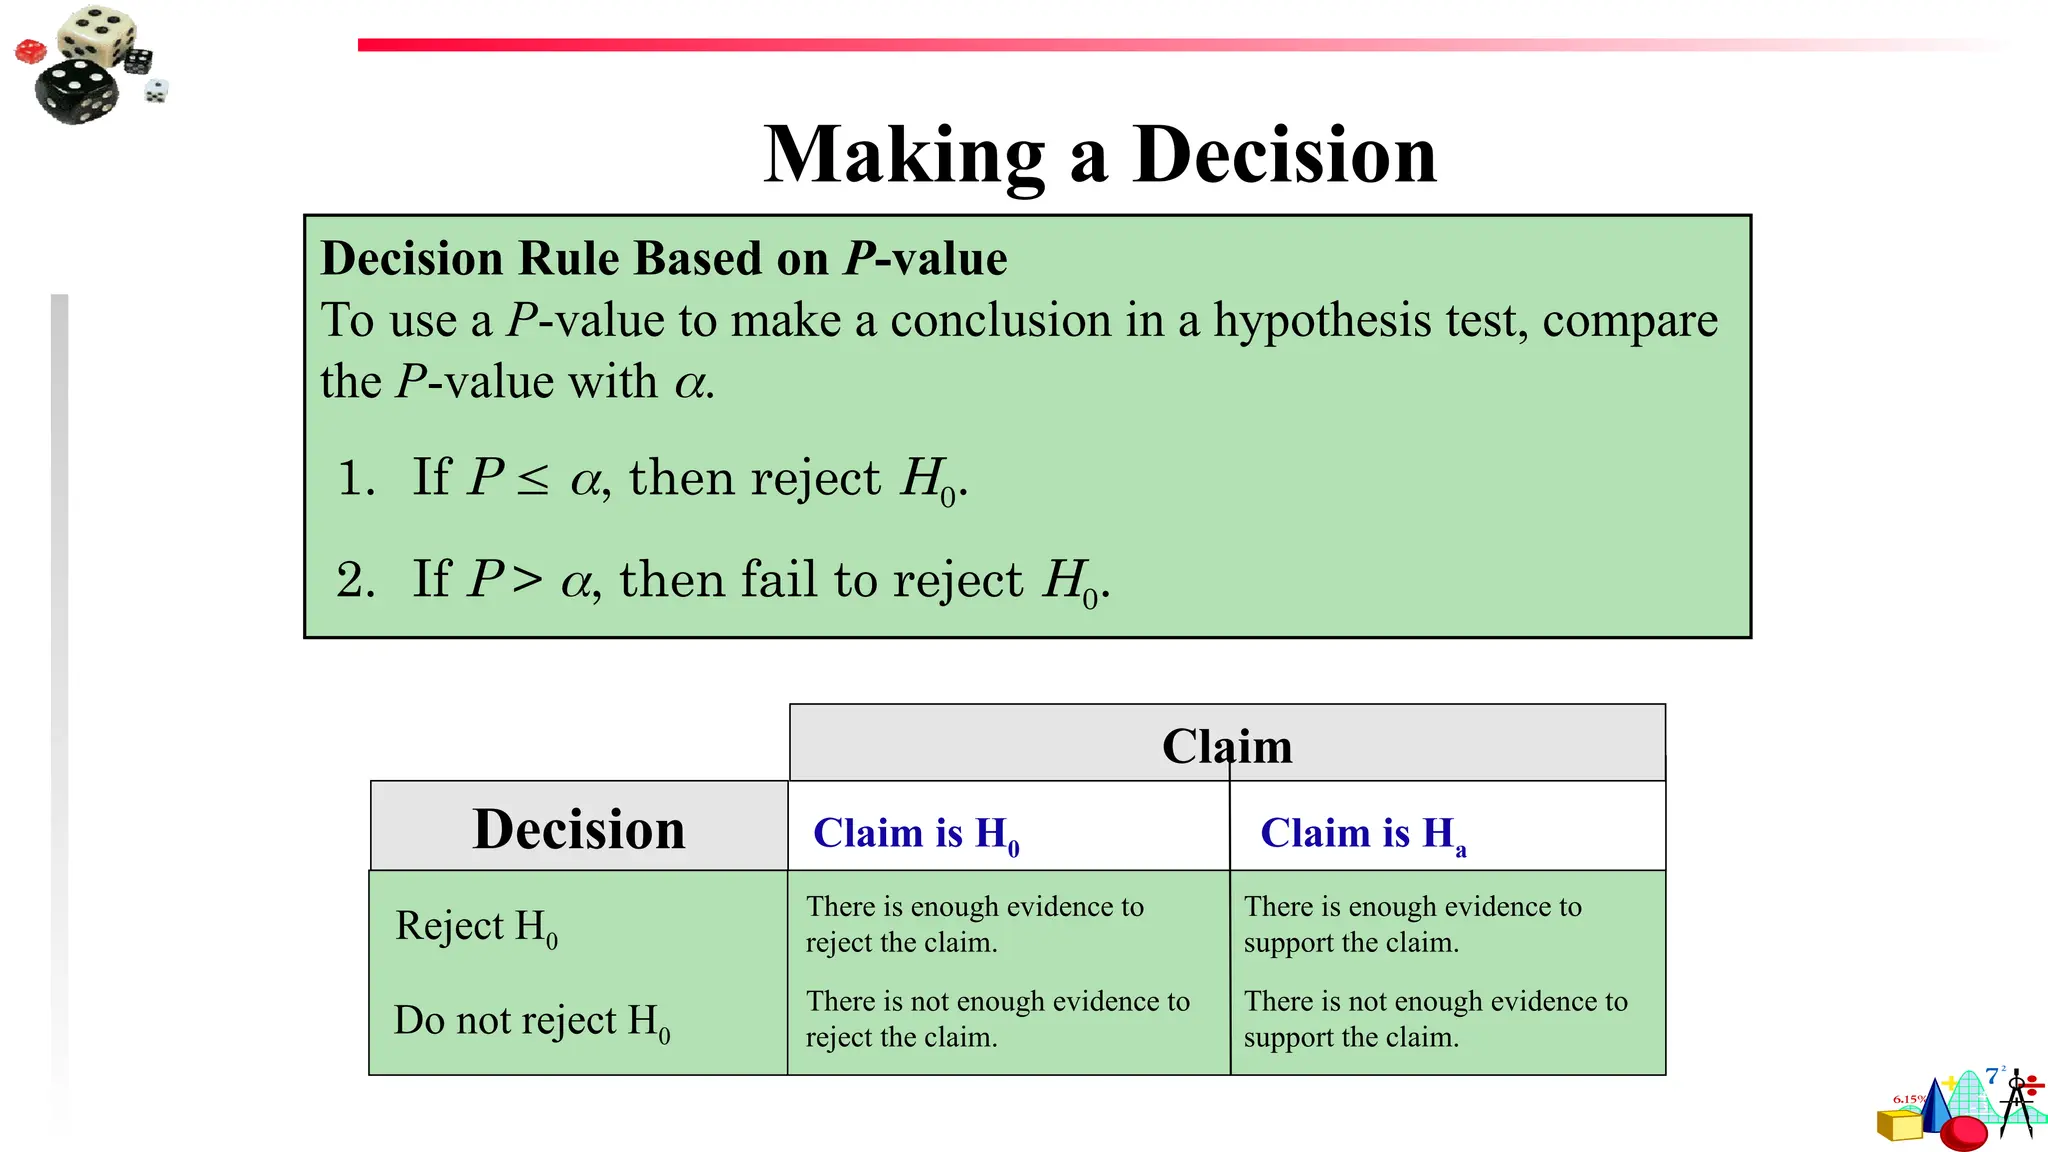
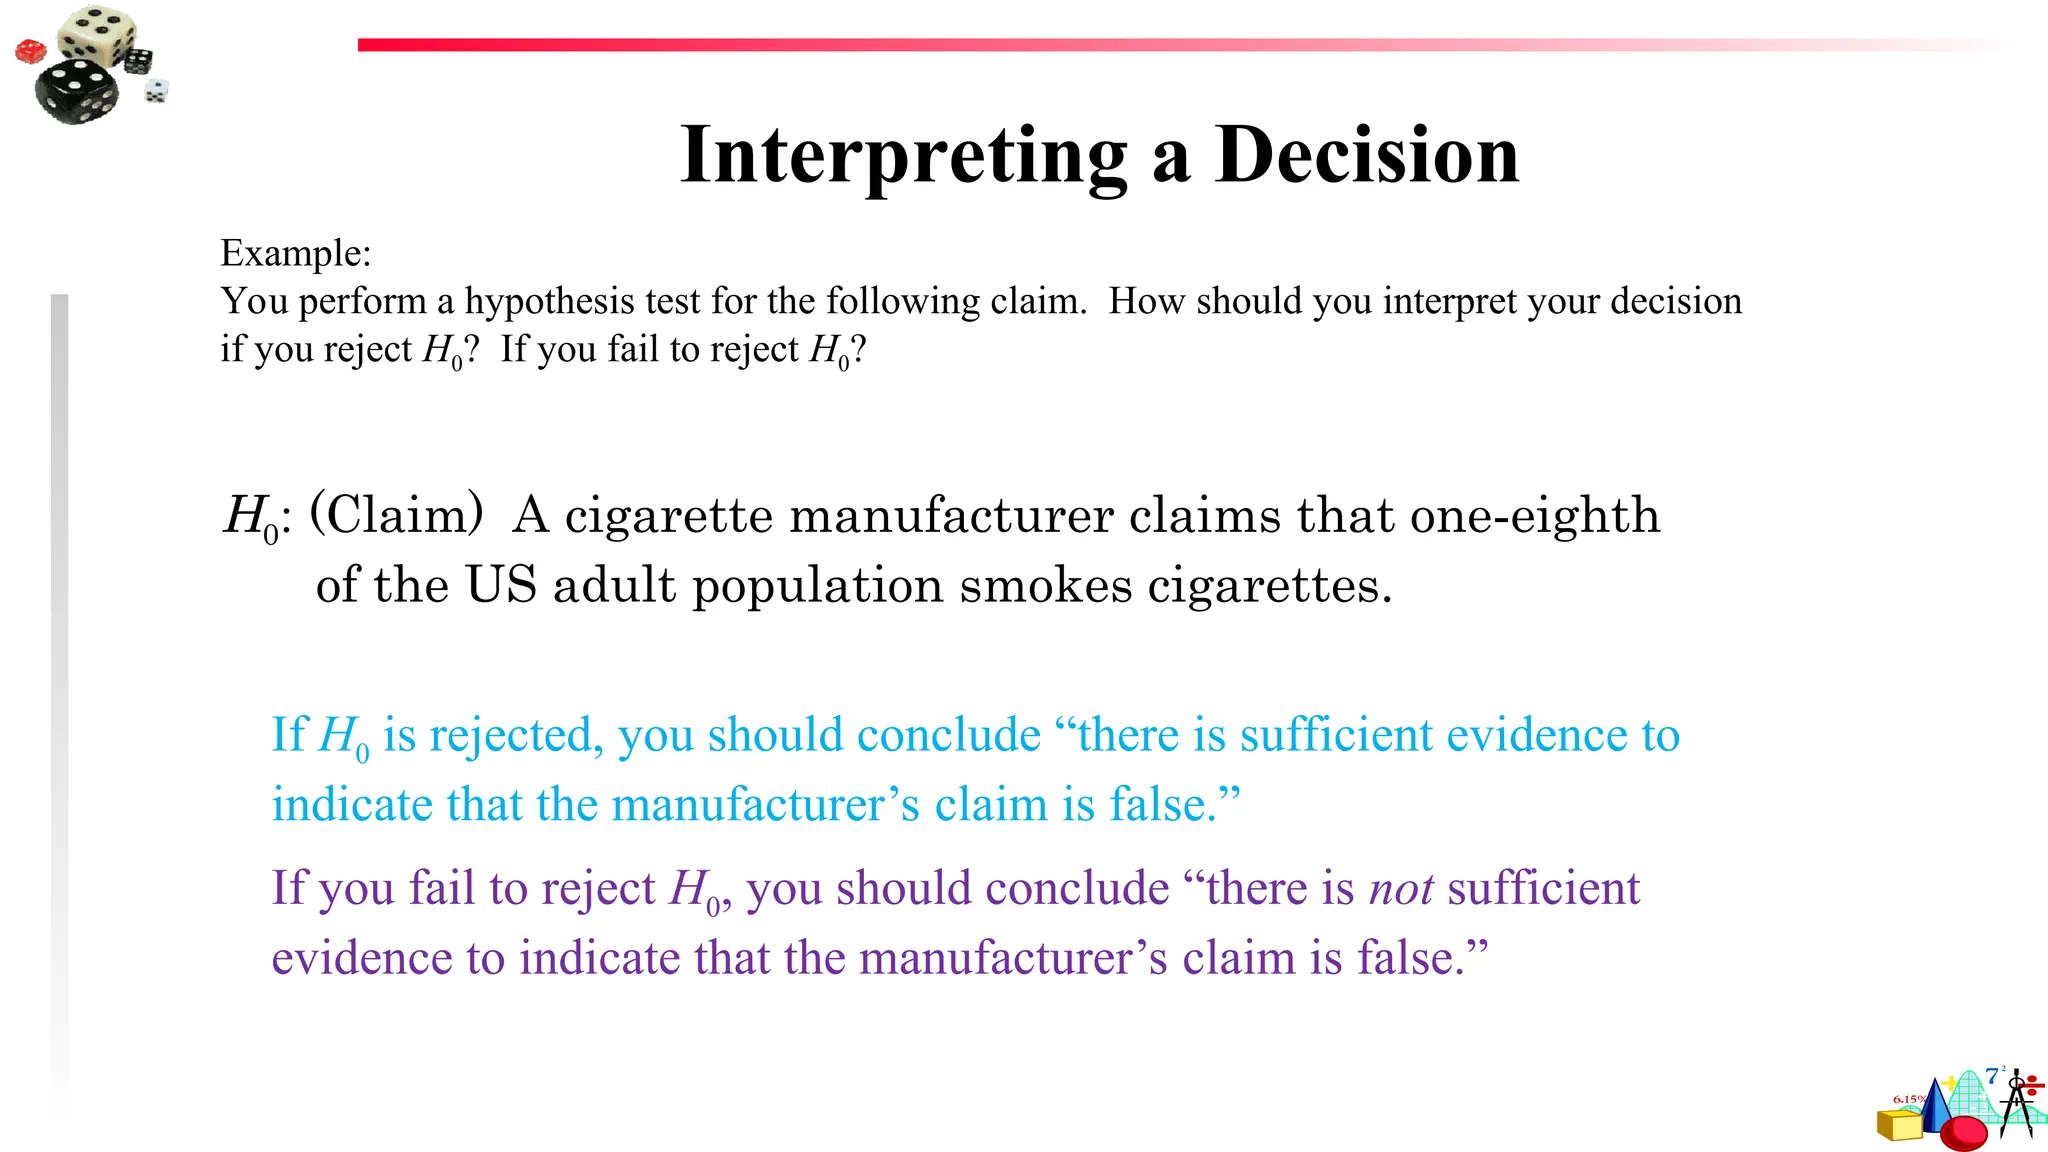
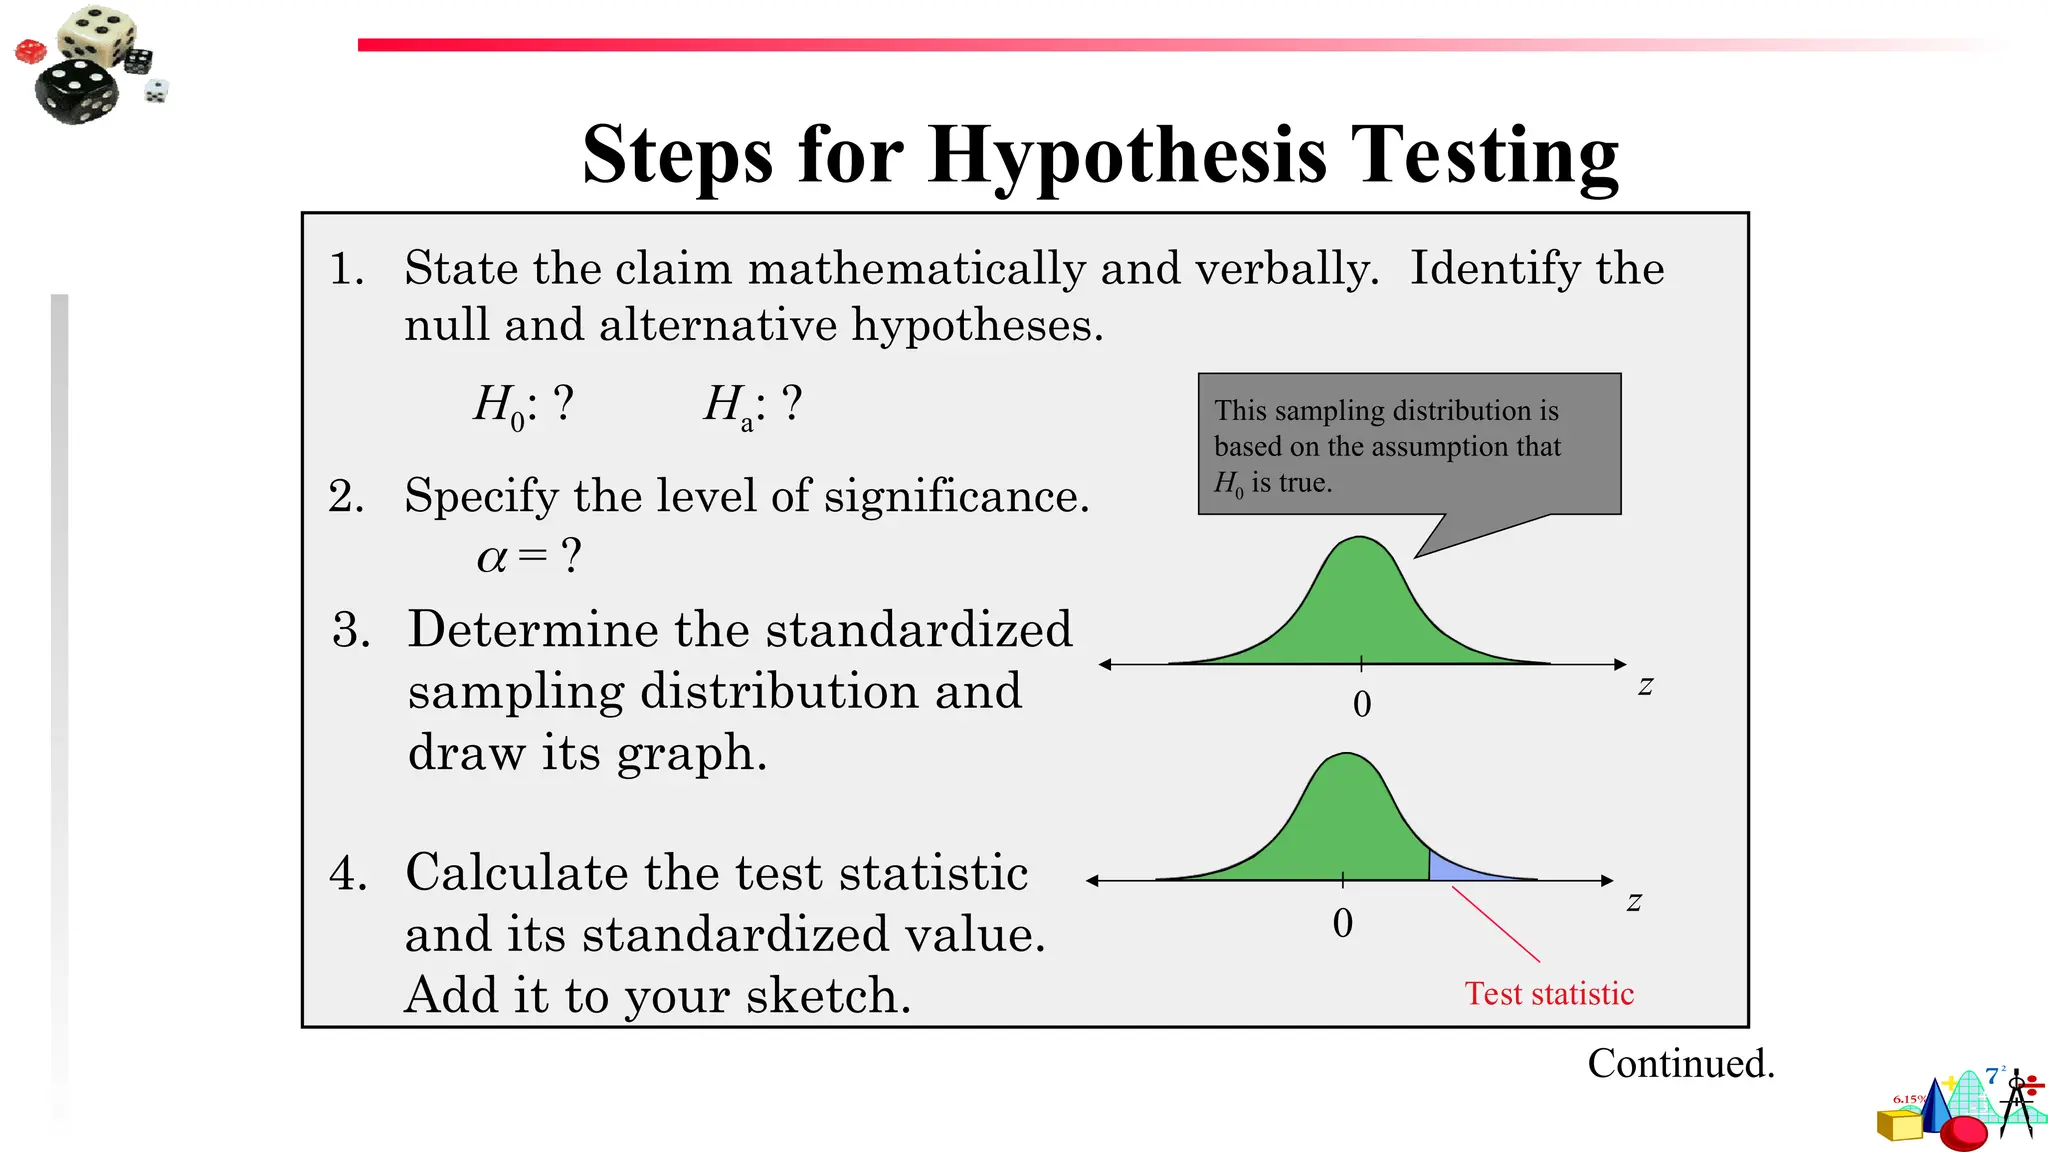
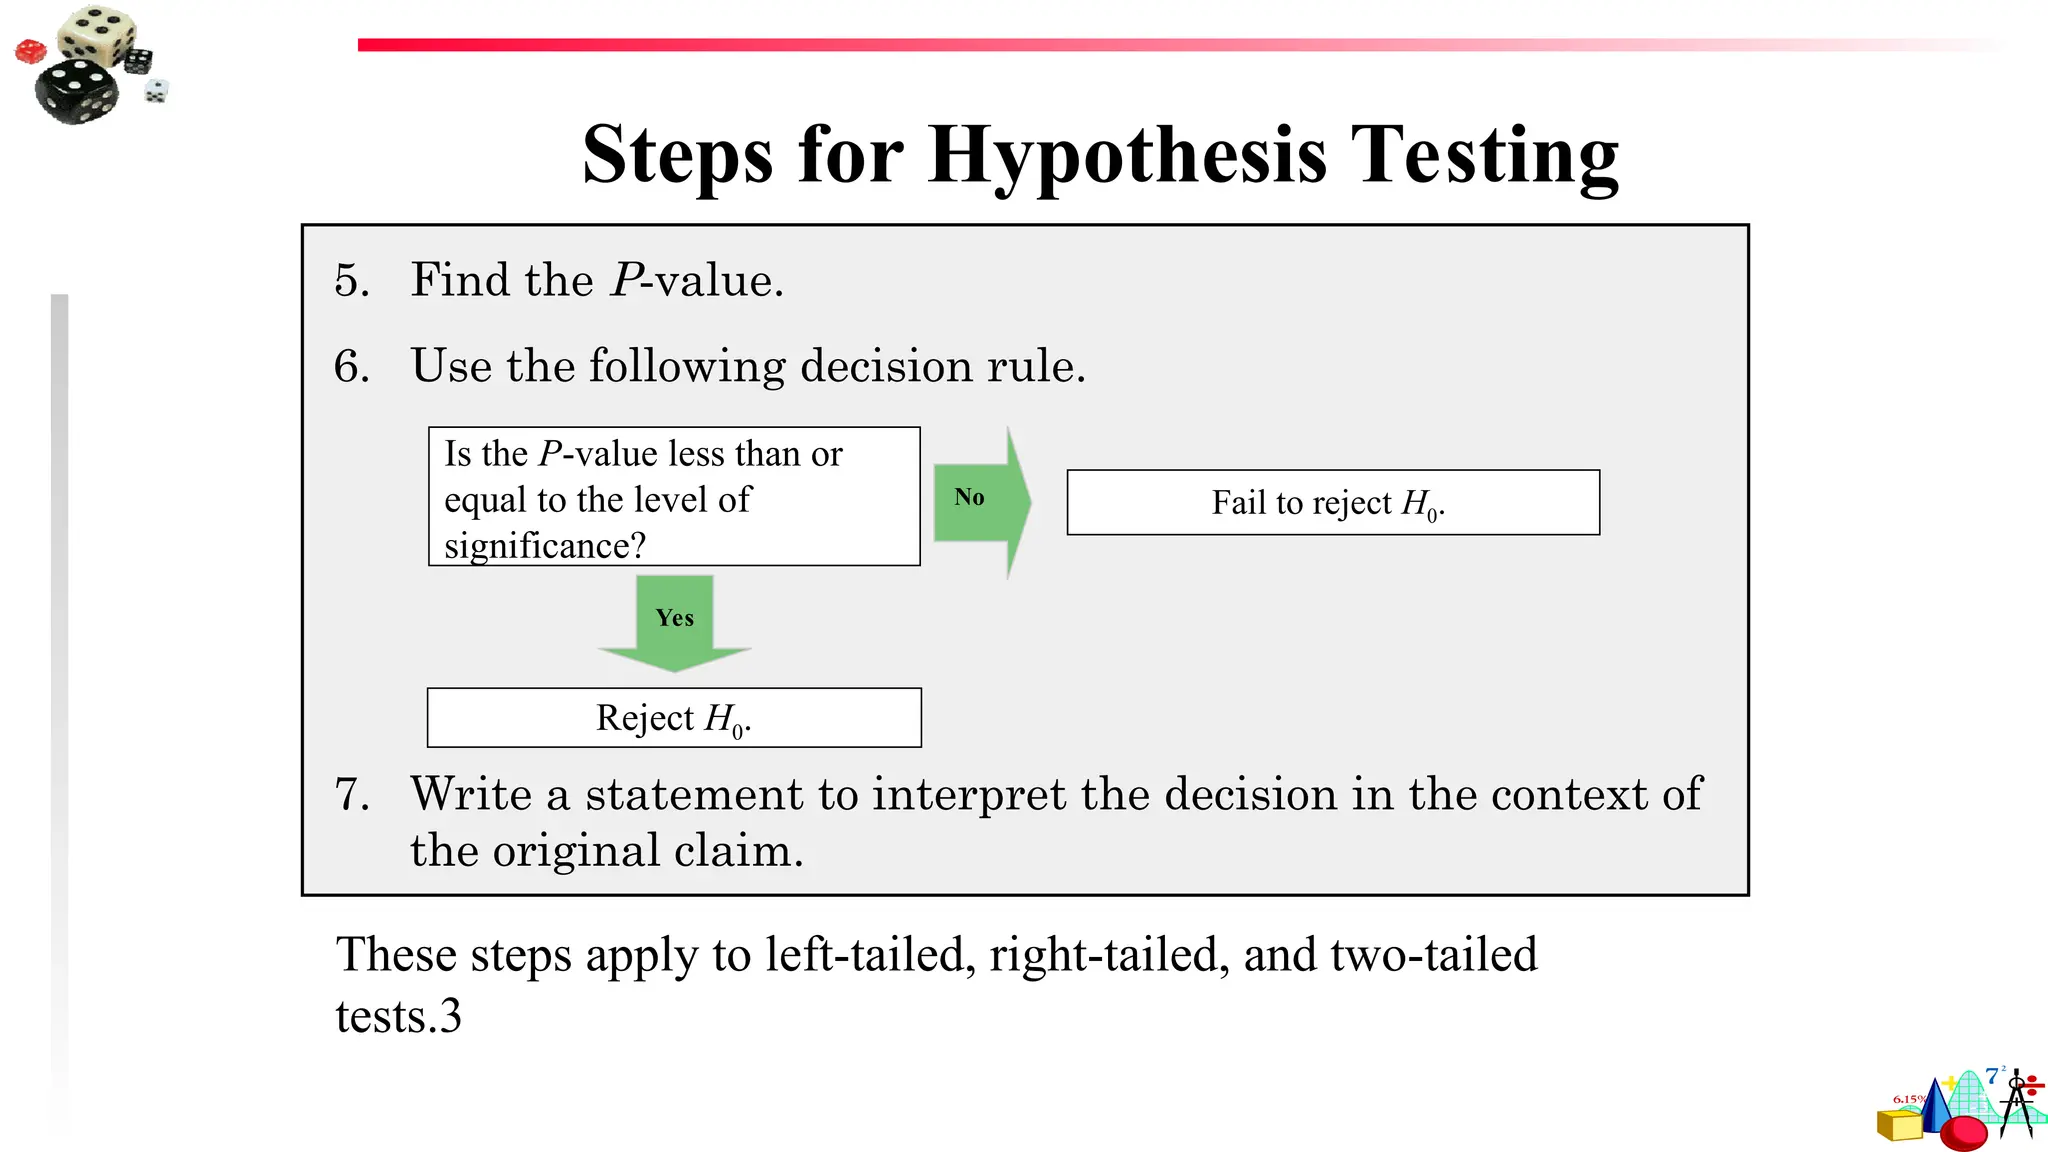

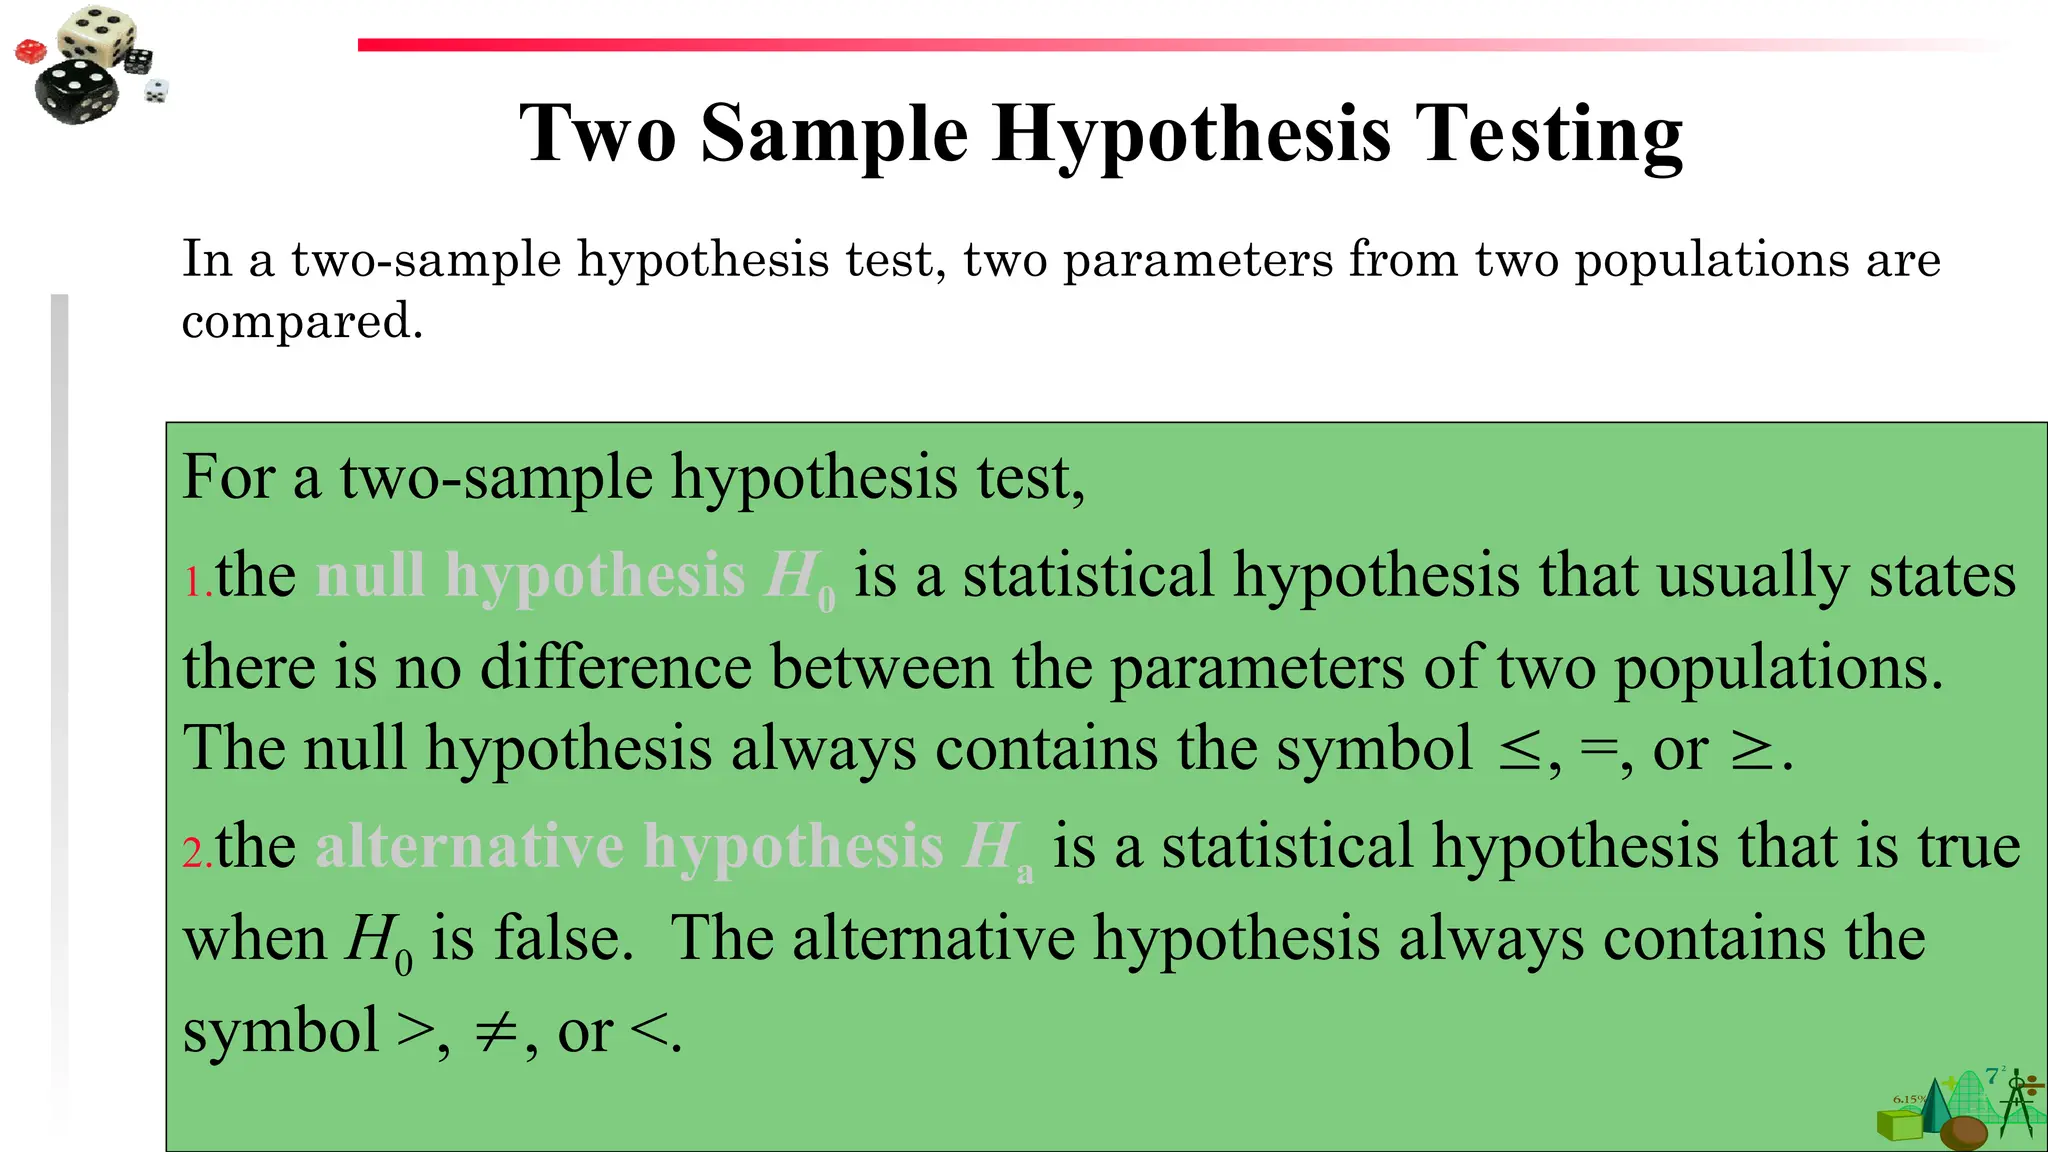
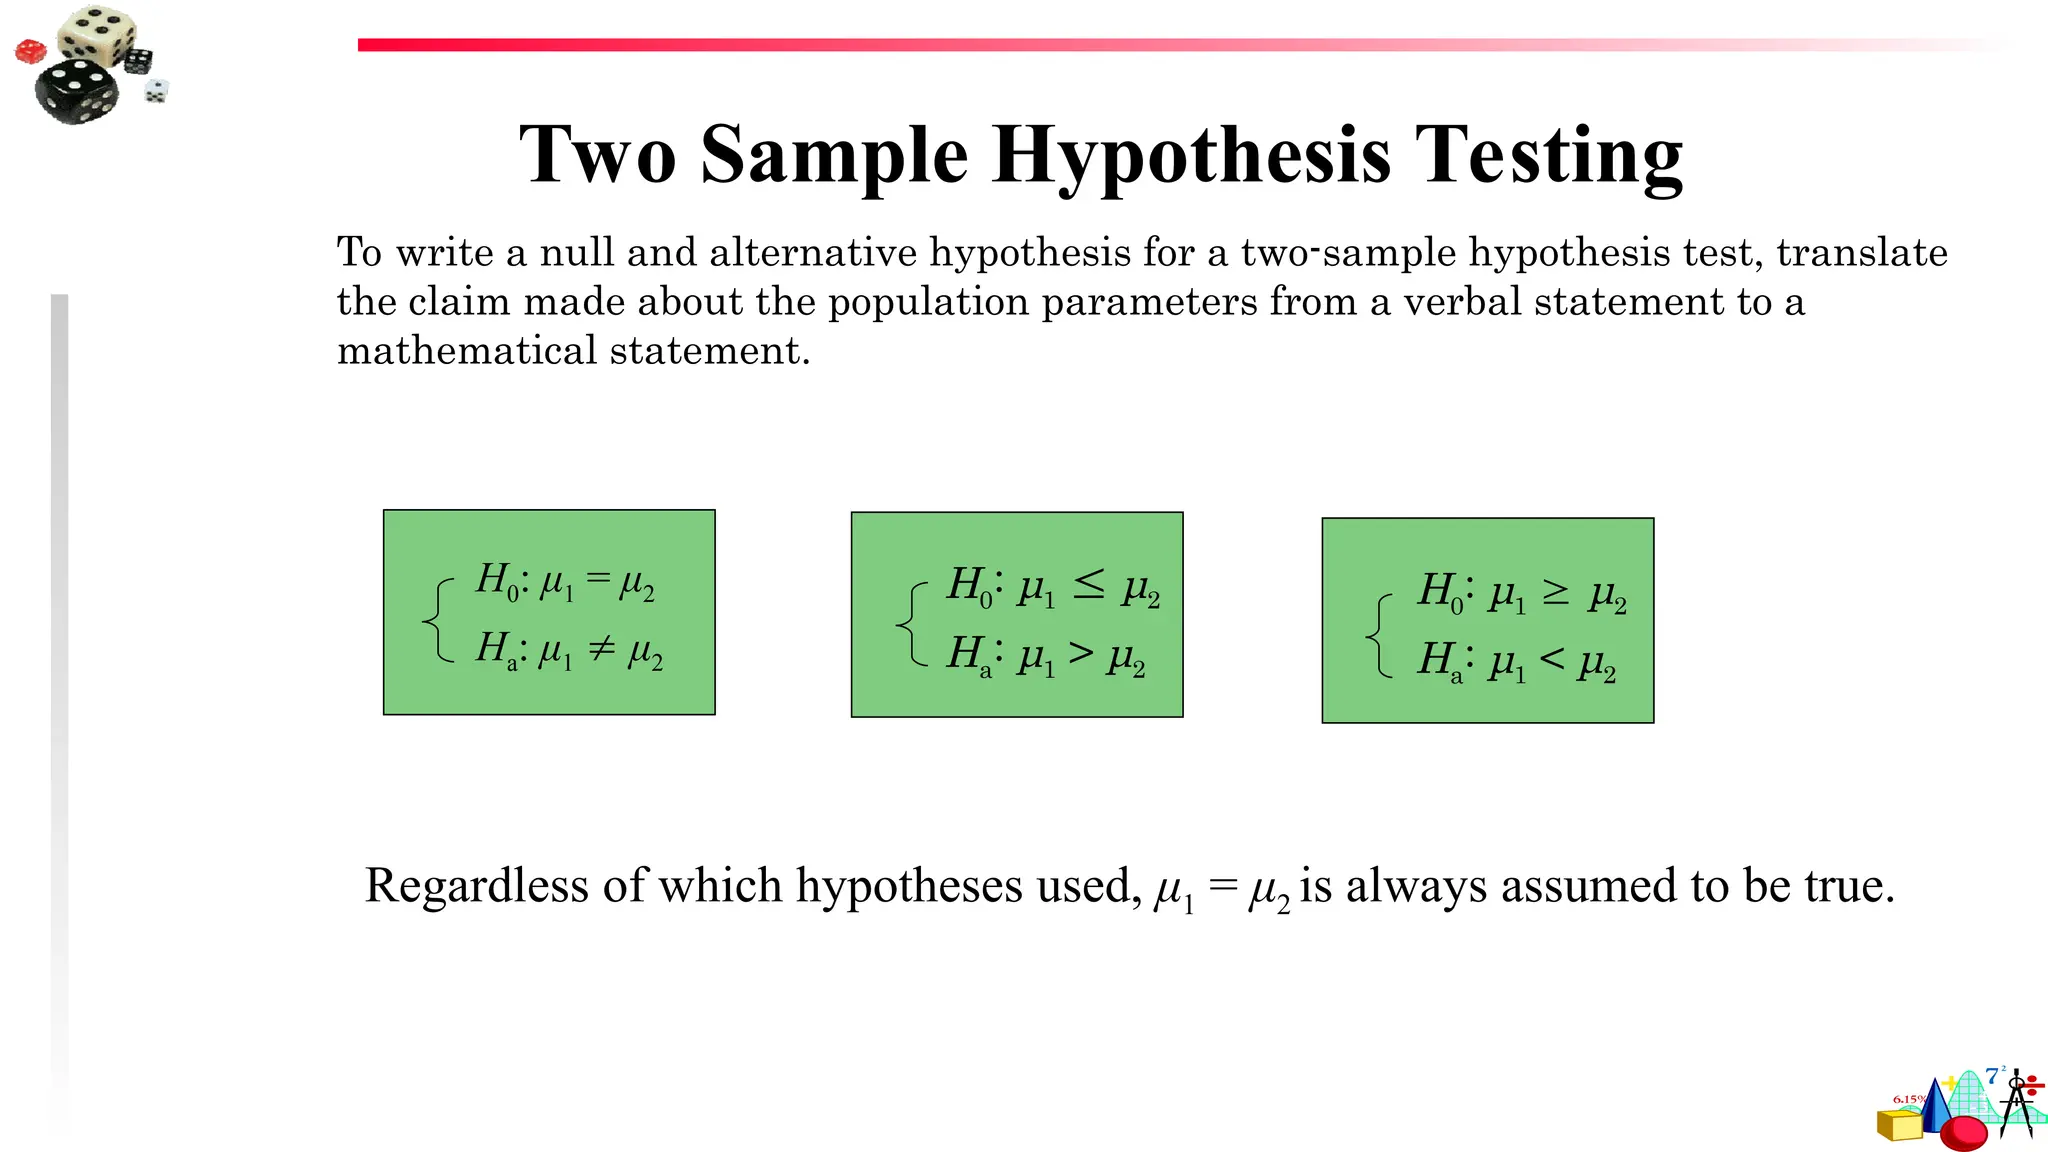


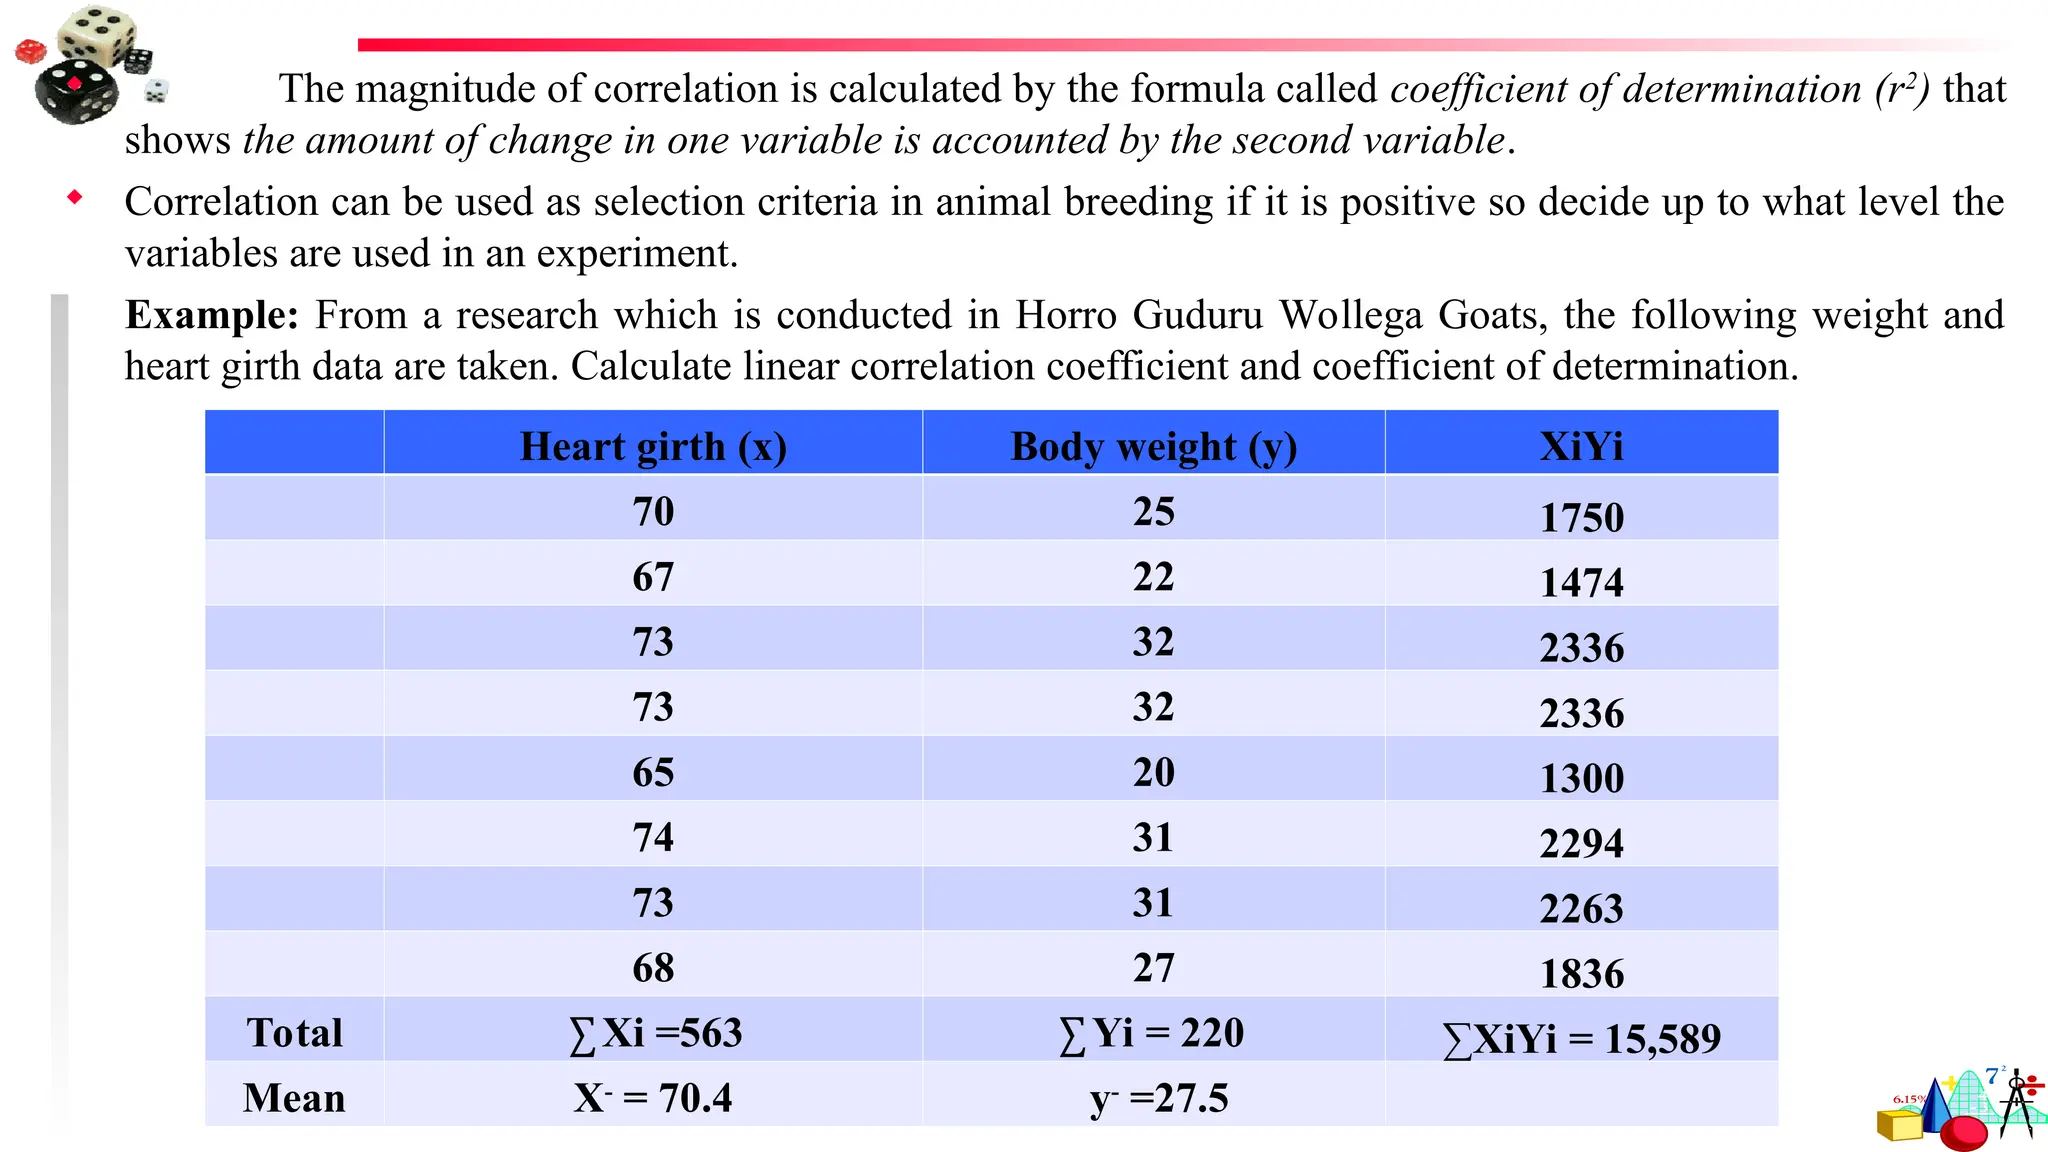
![Solution
SSX =∑ xi2
– (∑ xi)2
= [(70)2
+ (67)2
+--- (68)2
] – (563)2
= 39701-39621.13 =79.87
n 8
SSY = =∑ Yi2
– (∑ Yi)2
= [(25)2
+ (22)2
+--- (27)2
] – (220)2
= 6208 -6050 =158
n 8
Cov XY = ∑XiYi – (∑Xi∑Yi)= [1750 +1474+---1836] – (563x220) = 15589-15482.5 = 106.5
n 8
rXY (correlation coefficient) = Cov XY = 106.5 = 106.5 = 0.95
√SSX*SSY √79.87*158 112.34
r2
(coefficient of determination) = 0.952
= 0.8988 = 89.88%. This shows that
the relation between heart girth(x) and body weight(y) variable is 89.88%.](https://image.slidesharecdn.com/researchmethod-250326202509-d1a53c67/75/Research-method-for-gggggggggggggggg-ppt-100-2048.jpg)

![Solution
SSX =∑ xi2
– (∑ xi)2
= [(70)2
+ (67)2
+--- (68)2
] – (563)2
= 39701-39621.13 =79.87
n 8
SSY = =∑ Yi2
– (∑ Yi)2
= [(25)2
+ (22)2
+--- (27)2
] – (220)2
= 6208 -6050 =158
n 8
Cov XY = ∑XiYi – (∑Xi∑Yi)= [1750 +1474+---1836] – (563x220) = 15589-15482.5 = 106.5
n 8
b = Cov XY/SSx = 106.5/79.87 = 1.33
Y = a + bx
a = y-
-b X-
= 27.5- (1.33 x 70.4) = 27.5 – 93.87 = -66.37
Y = -66.37 + 1.33x
Body weight = -66.37 + 1.33(heart girth)](https://image.slidesharecdn.com/researchmethod-250326202509-d1a53c67/75/Research-method-for-gggggggggggggggg-ppt-106-2048.jpg)
![SAMPLING ERRORS
Sampling errors occur as a result of calculating the estimate (estimated mean, total, proportion,
etc) based on a sample rather than the entire population. This is due to the fact that the estimated
figure obtained from the sample may not be exactly equal to the true value of the population. For
example, if a sample of blocks is used to estimate the total number of persons in the city, and the
blocks in the sample are larger than the average — then this sample will overstate the true
population of the city.
When results from a sample survey are reported, they are often stated in the form “plus or minus”
of the respective units being used. This “plus or minus” reflects sampling errors. Salant and
Dilman, describe, that the statistics based on samples drawn from the same population always vary
from each other (and from the true population value) simply because of chance. This variation is
sampling error and the measure used to estimate the sampling error is the standard error.
se (p) = [(p q)/n] where, se (p) is the standard error of a proportion, p and q is the proportion of the sample
that do (p) and do not (q) have a particular characteristic, and n = the number of units in the sample.](https://image.slidesharecdn.com/researchmethod-250326202509-d1a53c67/75/Research-method-for-gggggggggggggggg-ppt-111-2048.jpg)