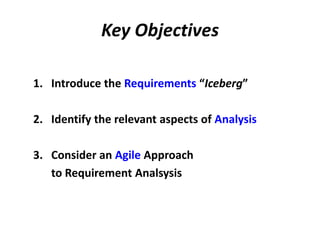
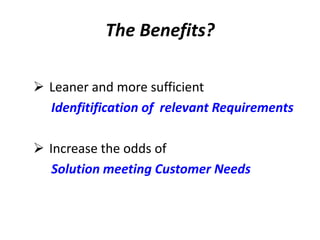
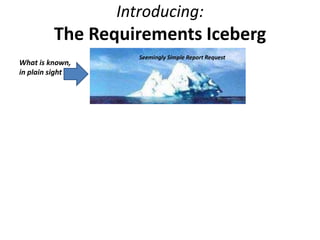
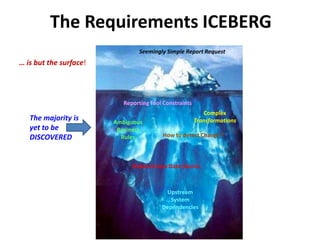
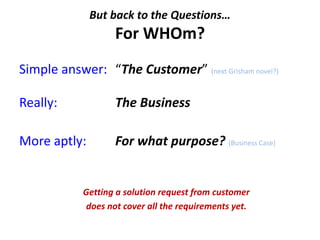
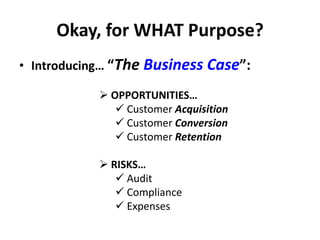
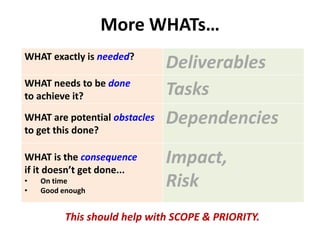
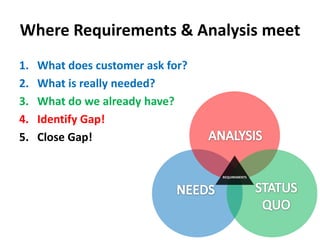
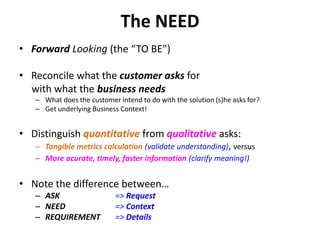
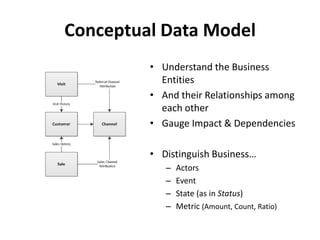
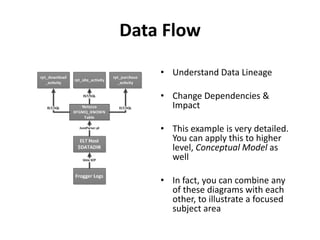
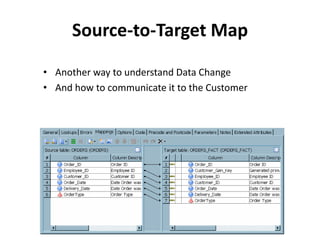
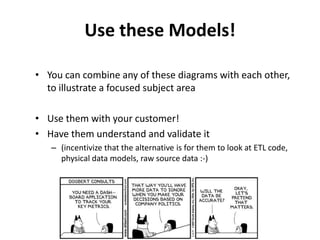
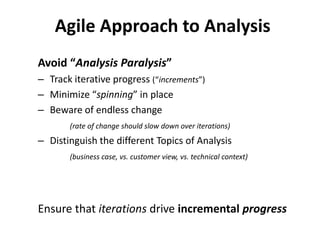
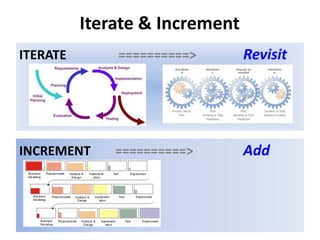
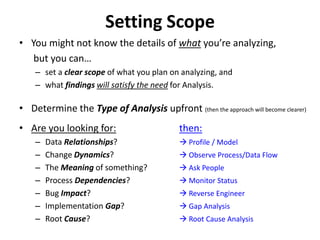
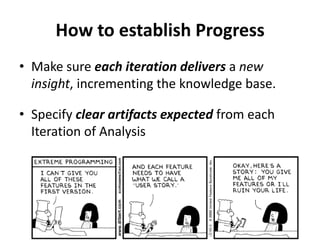
Requirements AnalysisBernd Durrwachter  http://www.linkedin.com/in/bernddu
Key ObjectivesIntroduce the Requirements “Iceberg”Identify the relevant aspects of AnalysisConsider an Agile Approach 	to Requirement Analsysis
The Benefits?Leaner and more sufficient Idenfitification of  relevant RequirementsIncrease the odds of Solution meeting Customer Needs
Relax!Not a new process!No new rules!No additional documentation!Just to inspire your thoughts….and help with communication.
WHY Requirements AnalysisDon’t you need INFORMATION to make decisions?
Try delivering a SOLUTION without knowing…
for WHOm
WHAT purpose it serves
HOW much
WHEN to deliver it
WHERE it is needed
WHY in the first placeGood Question!Didn’t we just get the Requirements from the Customer?No, you got a request for a solution from the customer. We don’t live in a Waterfall world anymore. Now go find out more!
Introducing:The Requirements IcebergSeemingly Simple Report RequestWhat is known, in plain sight
The Requirements ICEBERGSeemingly Simple Report Request… is but the surface!Reporting Tool ConstraintsComplexTransformationsThe majority is yet to be DISCOVEREDAmbiguous Business RulesHow to detect Change ?Onboard new Data SourceUpstream SystemDependencies
But back to the Questions…For WHOm?Simple answer: 	“The Customer” (next Grisham novel?)Really:The BusinessMore aptly: For what purpose? (Business Case)Getting a solution request from customer does not cover all the requirements yet.
Okay, for WHAT Purpose?Introducing… “The Business Case”: OPPORTUNITIES…
 Customer Acquisition
 Customer Conversion
 Customer Retention
 RISKS…
 Audit
 Compliance
 ExpensesMore WHATs…This should help with SCOPE & PRIORITY.
HOW much Analysis?You analyze when you have not enough information.
Ergo, you’re done analyzing, when you have enough informationSo WHEN is “enough” ?Representative samples (“typical” cases, 80/20 rule)
Top 20% of findings, address 80% of the scenarios
Most relevant scenarios (sub-set with the greatest impact)
Or, time-boxed: “do as much as you can within alotted time”In the end, “enough”, “relevant”, “representative” are all relative, depending on context. Clarify your scope with customer!
WHERE is it needed?PURPOSE
What problem is this “solution” trying to solve?
What business challenge does it need to address?
SCOPE
The right solution in the right place
Know the ultimate objective of the request!WHY in the first place?
Where Requirements & Analysis meetWhat does customer ask for?What is really needed?What do we already have?Identify Gap!Close Gap!ANALYSISREQUIREMENTSSTATUS QUONEEDS
Who’s the CUSTOMER ?ExternalThird Party (e.g. Affiliate, Provider)Product MgmtOperations(e.g. Finance, Support)Peer Team(in CIO orgi.e. Marketing)EDW(Technical Debt)
Why does the WHO matter?Different people, teams, business functions have different understandings of…CompletenessQualityPerformanceAccuracyPrecisionDon’t project one customer’s expectations on another
The NEEDForward Looking (the “TO BE”)Reconcile what the customer asks for      with what the business needsWhat does the customer intend to do with the solution (s)he asks for?Get underlying Business Context!Distinguish quantitativefrom qualitativeasks:Tangible metrics calculation(validate understanding), versusMore acurate, timely, faster information(clarify meaning!)Note the difference between…ASK=> RequestNEED=> ContextREQUIREMENT=> Details
The STATUS QUOBackwardLooking(the “WHAT IS”)…ReportsViewsReporting Data (Structure, Content)Persistent Staging Data (a.k.a. ODS, rpt_ tables)Source Data (internal)External Data
Identify GAPMetrics don’t existNot sliceable as desired (dimensions)Data Quality(coverage, numbers, attribution)More DetailMore HistorySubject Area not covered yetChange Delivery Format(CSV, view, XLS, BO, Tableau)More timely Data (finer time grain, or performance)Business Rules changed (ETL/backfill processing)
Close GAPOnboard new external data possibly new data acquisition methodOnboard new internal datamore likely via existing channelsProfile Source DataDesign Reporting Data (Sub) ModelBuild Data StructuresTransform Source Data into Reporting Structures (ETL)Build customer-accessible Reporting ViewsBuild Reports
More Details on GapsCustomer Need:What is the underlying calculation for the needed Business Metric?What Business Rules apply for this Report/Metric?Existing EDW:What does the existing view query code do?How does the existing ETL logic work?What is covered by the source data?How can we access the 3rd party data feed?
Gap Analysis MatrixNEEDto find out about BUSINESS…Business Concepts (Terms, Meanings, Relationships)Business Process Work FlowDecision Points, CriteriaBusiness Rules Possible StatesChanges/Transitions (criteria, scenarios)Formulas, ParametersHAVEunderstanding about the BUSINESS…Business Concepts (Terms, Meanings, Relationships)Business Process Work FlowDecision Points, CriteriaBusiness Rules Possible StatesChanges/Transitions (criteria, scenarios)Formulas, ParametersHAVE in EDW…Reports (Metrics, Slicers)Views (Query Logic)ETL (Transformation Logic)Tables(Facts, Dimensions, Reporting, Staging)Data(Coverage, Quality, History)Source(Availability, Connection, Understanding)NEED in EDW…Reports (Metrics, Slicers)Views (Query Logic)ETL (Transformation Logic)Tables(Facts, Dimensions, Reporting, Staging)Data(Coverage, Quality, History)Source(Availability, Connection, Understanding)
Business Process – Flow & StepsAd-hoc model drives better understandingWe do it all the time on the white boardHelps you understand the steps and concepts involved
Business Process - OutcomesUnderstand the relevant outcomes of Business ProcessesAnd how the influence each otherMost likely we have to model, capture and report on these in the EDWAlso known as “State Transitions”
Decision TreeUnderstand what leads to outcomesWhat decisions influence the process?Similar: “Fishbone” Diagrams
Conceptual Data ModelUnderstand the Business EntitiesAnd their Relationships among each otherGauge Impact & DependenciesDistinguish Business…ActorsEventState (as in Status)Metric (Amount, Count, Ratio)
Data FlowUnderstand Data LineageChange Dependencies & ImpactThis example is very detailed. You can apply this to higher level, Conceptual Model as wellIn fact, you can combine any of these diagrams with each other, to illustrate a focused subject area

Requirements analysis 2011

  • 1.
    Requirements AnalysisBernd Durrwachter http://www.linkedin.com/in/bernddu
  • 2.
    Key ObjectivesIntroduce theRequirements “Iceberg”Identify the relevant aspects of AnalysisConsider an Agile Approach to Requirement Analsysis
  • 3.
    The Benefits?Leaner andmore sufficient Idenfitification of relevant RequirementsIncrease the odds of Solution meeting Customer Needs
  • 4.
    Relax!Not a newprocess!No new rules!No additional documentation!Just to inspire your thoughts….and help with communication.
  • 5.
    WHY Requirements AnalysisDon’tyou need INFORMATION to make decisions?
  • 6.
    Try delivering aSOLUTION without knowing…
  • 7.
  • 8.
  • 9.
  • 10.
  • 11.
  • 12.
    WHY in thefirst placeGood Question!Didn’t we just get the Requirements from the Customer?No, you got a request for a solution from the customer. We don’t live in a Waterfall world anymore. Now go find out more!
  • 13.
    Introducing:The Requirements IcebergSeeminglySimple Report RequestWhat is known, in plain sight
  • 14.
    The Requirements ICEBERGSeeminglySimple Report Request… is but the surface!Reporting Tool ConstraintsComplexTransformationsThe majority is yet to be DISCOVEREDAmbiguous Business RulesHow to detect Change ?Onboard new Data SourceUpstream SystemDependencies
  • 15.
    But back tothe Questions…For WHOm?Simple answer: “The Customer” (next Grisham novel?)Really:The BusinessMore aptly: For what purpose? (Business Case)Getting a solution request from customer does not cover all the requirements yet.
  • 16.
    Okay, for WHATPurpose?Introducing… “The Business Case”: OPPORTUNITIES…
  • 17.
  • 18.
  • 19.
  • 20.
  • 21.
  • 22.
  • 23.
    ExpensesMore WHATs…Thisshould help with SCOPE & PRIORITY.
  • 24.
    HOW much Analysis?Youanalyze when you have not enough information.
  • 25.
    Ergo, you’re doneanalyzing, when you have enough informationSo WHEN is “enough” ?Representative samples (“typical” cases, 80/20 rule)
  • 26.
    Top 20% offindings, address 80% of the scenarios
  • 27.
    Most relevant scenarios(sub-set with the greatest impact)
  • 28.
    Or, time-boxed: “doas much as you can within alotted time”In the end, “enough”, “relevant”, “representative” are all relative, depending on context. Clarify your scope with customer!
  • 29.
    WHERE is itneeded?PURPOSE
  • 30.
    What problem isthis “solution” trying to solve?
  • 31.
    What business challengedoes it need to address?
  • 32.
  • 33.
    The right solutionin the right place
  • 34.
    Know the ultimateobjective of the request!WHY in the first place?
  • 35.
    Where Requirements &Analysis meetWhat does customer ask for?What is really needed?What do we already have?Identify Gap!Close Gap!ANALYSISREQUIREMENTSSTATUS QUONEEDS
  • 36.
    Who’s the CUSTOMER?ExternalThird Party (e.g. Affiliate, Provider)Product MgmtOperations(e.g. Finance, Support)Peer Team(in CIO orgi.e. Marketing)EDW(Technical Debt)
  • 37.
    Why does theWHO matter?Different people, teams, business functions have different understandings of…CompletenessQualityPerformanceAccuracyPrecisionDon’t project one customer’s expectations on another
  • 38.
    The NEEDForward Looking(the “TO BE”)Reconcile what the customer asks for with what the business needsWhat does the customer intend to do with the solution (s)he asks for?Get underlying Business Context!Distinguish quantitativefrom qualitativeasks:Tangible metrics calculation(validate understanding), versusMore acurate, timely, faster information(clarify meaning!)Note the difference between…ASK=> RequestNEED=> ContextREQUIREMENT=> Details
  • 39.
    The STATUS QUOBackwardLooking(the“WHAT IS”)…ReportsViewsReporting Data (Structure, Content)Persistent Staging Data (a.k.a. ODS, rpt_ tables)Source Data (internal)External Data
  • 40.
    Identify GAPMetrics don’texistNot sliceable as desired (dimensions)Data Quality(coverage, numbers, attribution)More DetailMore HistorySubject Area not covered yetChange Delivery Format(CSV, view, XLS, BO, Tableau)More timely Data (finer time grain, or performance)Business Rules changed (ETL/backfill processing)
  • 41.
    Close GAPOnboard newexternal data possibly new data acquisition methodOnboard new internal datamore likely via existing channelsProfile Source DataDesign Reporting Data (Sub) ModelBuild Data StructuresTransform Source Data into Reporting Structures (ETL)Build customer-accessible Reporting ViewsBuild Reports
  • 42.
    More Details onGapsCustomer Need:What is the underlying calculation for the needed Business Metric?What Business Rules apply for this Report/Metric?Existing EDW:What does the existing view query code do?How does the existing ETL logic work?What is covered by the source data?How can we access the 3rd party data feed?
  • 43.
    Gap Analysis MatrixNEEDtofind out about BUSINESS…Business Concepts (Terms, Meanings, Relationships)Business Process Work FlowDecision Points, CriteriaBusiness Rules Possible StatesChanges/Transitions (criteria, scenarios)Formulas, ParametersHAVEunderstanding about the BUSINESS…Business Concepts (Terms, Meanings, Relationships)Business Process Work FlowDecision Points, CriteriaBusiness Rules Possible StatesChanges/Transitions (criteria, scenarios)Formulas, ParametersHAVE in EDW…Reports (Metrics, Slicers)Views (Query Logic)ETL (Transformation Logic)Tables(Facts, Dimensions, Reporting, Staging)Data(Coverage, Quality, History)Source(Availability, Connection, Understanding)NEED in EDW…Reports (Metrics, Slicers)Views (Query Logic)ETL (Transformation Logic)Tables(Facts, Dimensions, Reporting, Staging)Data(Coverage, Quality, History)Source(Availability, Connection, Understanding)
  • 44.
    Business Process –Flow & StepsAd-hoc model drives better understandingWe do it all the time on the white boardHelps you understand the steps and concepts involved
  • 45.
    Business Process -OutcomesUnderstand the relevant outcomes of Business ProcessesAnd how the influence each otherMost likely we have to model, capture and report on these in the EDWAlso known as “State Transitions”
  • 46.
    Decision TreeUnderstand whatleads to outcomesWhat decisions influence the process?Similar: “Fishbone” Diagrams
  • 47.
    Conceptual Data ModelUnderstandthe Business EntitiesAnd their Relationships among each otherGauge Impact & DependenciesDistinguish Business…ActorsEventState (as in Status)Metric (Amount, Count, Ratio)
  • 48.
    Data FlowUnderstand DataLineageChange Dependencies & ImpactThis example is very detailed. You can apply this to higher level, Conceptual Model as wellIn fact, you can combine any of these diagrams with each other, to illustrate a focused subject area

Editor's Notes

  • #38 MEANING: What is it? A “Cellular Automaton” (rather: the output of such algorithm)Root cause: mathematical algorithmsPurpose: simulate/model natural processes, like biological, or chemicalSCALE: number of triangles (uncountable) -> group by size, colorDYNAMICS: this picture doesn’t move, but during it’s creation, you’d see the triangles evolveCONTEXT:Computer ScienceCERTAINTY:Mathematical algorithm well knownBackground of picture without sub title only known to experts
  • #39 For our very unscientific view here, let’s say the main contributors to COMPLEXITY are:SCALE: SizeVolume (number of elements)DYNAMICS:ChangeSpeedMEANINGPurpose/IntentRoot CauseCONTEXT:RelationshipsDependencies (upstream)Impact (downstream)EnvironmentScope, QualifierFocus
  • #45 A solution is often inFocusing scope, summarizing, generalizing, aggregating, grouping. One can aways make it more complicated later
  • #47 Inspired by Occam’s Razor: “ a principle which … recommends selecting the … hypothesis that makes the fewest new assumptions;  … that suggests we should tend towards simpler theories until we can trade some simplicity for increased explanatory power”*and yes, we are not scientists here, this wouldn’t hold up to scrutiny 